| Param | Original file | Final file |
|---|---|---|
| Filename | modeM0/AS1T03_243T01_9000003918_27195cztM0_level2.evt | modeM0/AS1T03_243T01_9000003918_27195cztM0_level2_quad_clean.evt |
| Size (bytes) | 591,799,680 | 97,056,000 |
| Size | 564.4 MB | 92.6 MB |
| Events in quadrant A | 3,450,936 | 643,669 |
| Events in quadrant B | 6,002,967 | 627,050 |
| Events in quadrant C | 3,381,465 | 613,311 |
| Events in quadrant D | 4,642,901 | 597,398 |
| Mode M9 | |||
|---|---|---|---|
| Quadrant | BADHDUFLAG | Total packets | Discarded packets |
| A | 0 | 14 | 0 |
| B | 0 | 15 | 0 |
| C | 0 | 15 | 0 |
| D | 0 | 15 | 0 |
| Mode M0 | |||
|---|---|---|---|
| Quadrant | BADHDUFLAG | Total packets | Discarded packets |
| A | 0 | 14529 | 0 |
| B | 0 | 22382 | 0 |
| C | 0 | 14346 | 0 |
| D | 0 | 18183 | 0 |
| Quadrant | Total seconds | Saturated seconds | Saturation percentage |
|---|---|---|---|
| A | 6569 | 89 | 1.354849% |
| B | 6568 | 957 | 14.570646% |
| C | 6568 | 127 | 1.933618% |
| D | 6568 | 183 | 2.786236% |
Noise dominated data is calculated using 1-second bins in cleaned event files. If a bin has >2000 counts, and if more than 50% of those come from <1% of pixels, then it is considered to be noise-dominated and hence unusable.
| Quadrant | # 1 sec bins | Bins with >0 counts | Bins with >2000 counts | High rate bins dominated by noise | Noise dominated (total time) | Noise dominated (detector-on time) | Marked lightcurve |
|---|---|---|---|---|---|---|---|
| A | 7664 | 6570 | 0 | 0 | 0.00% | 0.00% | 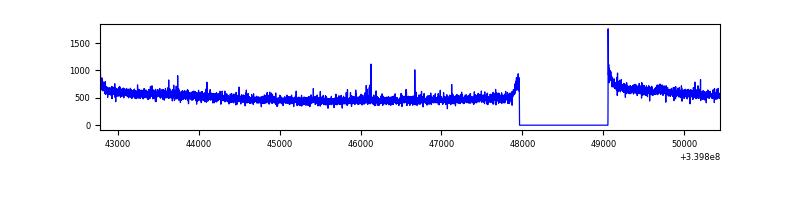 |
| B | 7663 | 6569 | 569 | 569 | 7.43% | 8.66% | 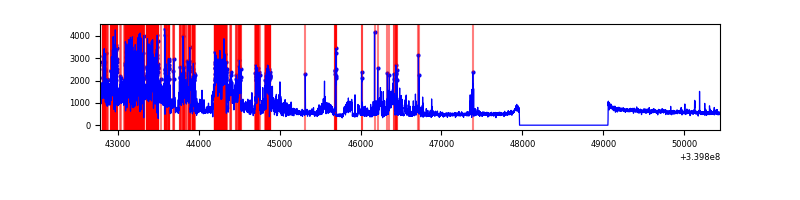 |
| C | 7663 | 6569 | 3 | 3 | 0.04% | 0.05% | 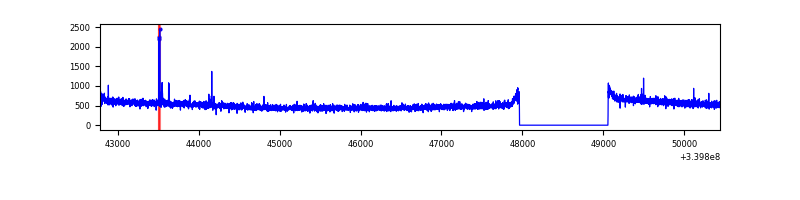 |
| D | 7663 | 6569 | 112 | 112 | 1.46% | 1.70% | 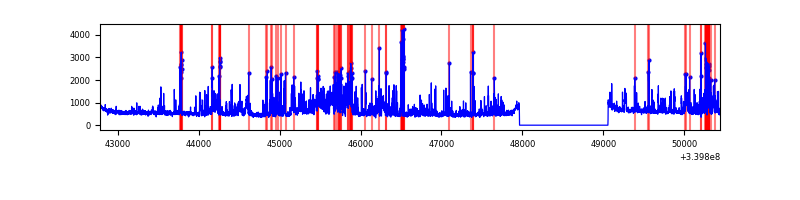 |
Top three noisy pixels from each quadrant. If the there are fewer than three noisy pixels in the level2.evt file, extra rows are filled as -1
| Pixel properties | Quadrant properties | ||||||
|---|---|---|---|---|---|---|---|
| Quadrant | DetID | PixID | Counts | Sigma | Mean | Median | Sigma |
| A | 6 | 16 | 34383 | 191.69 | 878 | 862 | 174.9 |
| A | 13 | 254 | 10297 | 53.96 | 878 | 862 | 174.9 |
| A | 14 | 235 | 9191 | 47.63 | 878 | 862 | 174.9 |
| B | 3 | 64 | 2689998 | 17555.49 | 806 | 786 | 153.2 |
| B | 15 | 33 | 92206 | 596.8 | 806 | 786 | 153.2 |
| B | 0 | 190 | 29294 | 186.1 | 806 | 786 | 153.2 |
| C | 14 | 238 | 132771 | 684.29 | 825 | 829 | 192.8 |
| C | 15 | 208 | 28225 | 142.08 | 825 | 829 | 192.8 |
| C | 13 | 61 | 5632 | 24.91 | 825 | 829 | 192.8 |
| D | 1 | 52 | 1105001 | 5000.23 | 832 | 820 | 220.8 |
| D | 2 | 250 | 141232 | 635.85 | 832 | 820 | 220.8 |
| D | 12 | 233 | 90949 | 408.14 | 832 | 820 | 220.8 |
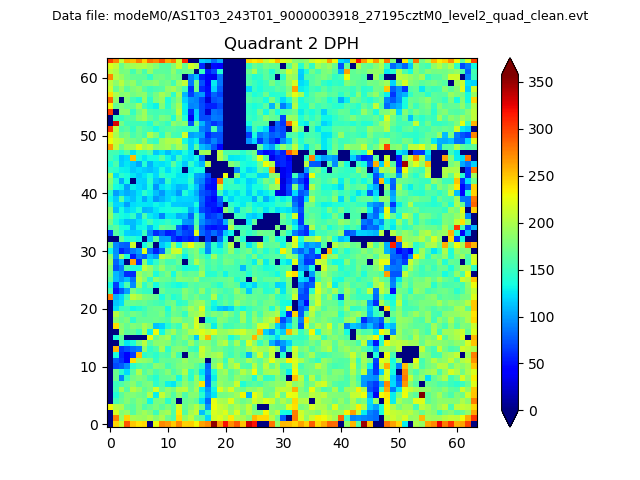
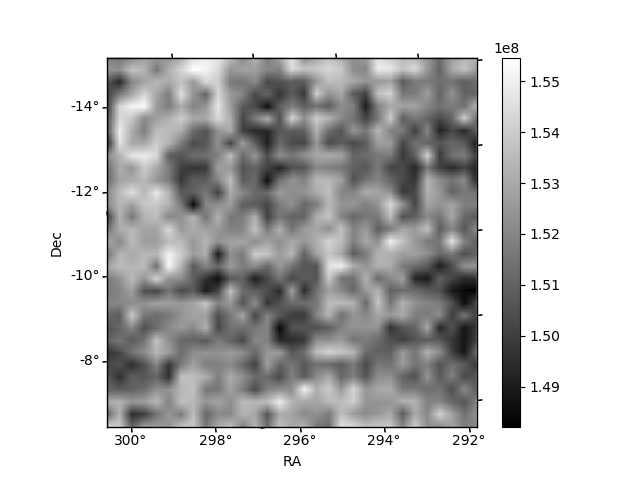
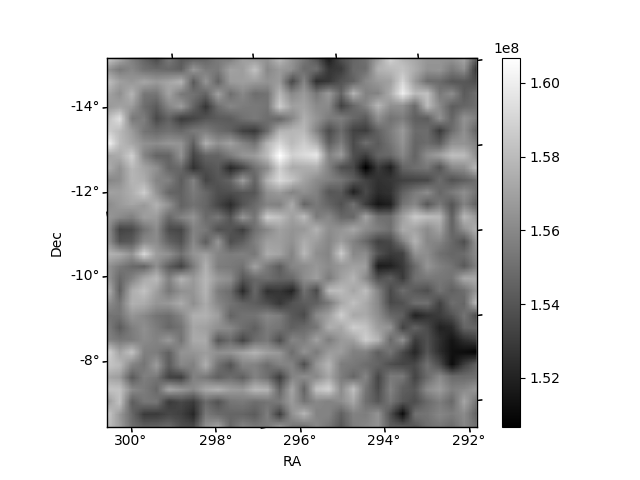
Histogram calculated using DETX and DETY for each event in the final _common_clean file
| Quadrant A | 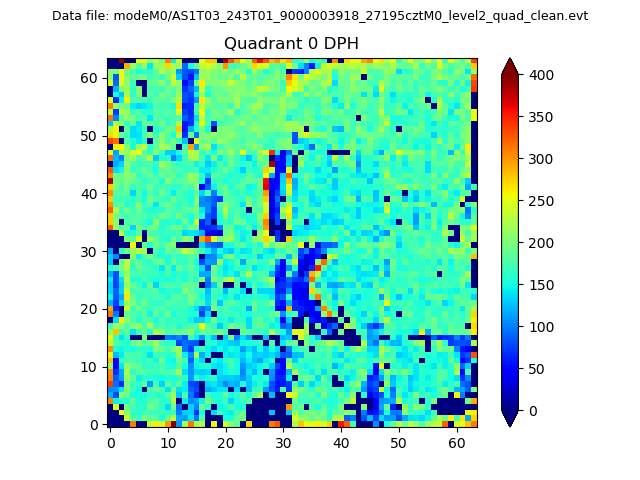 |
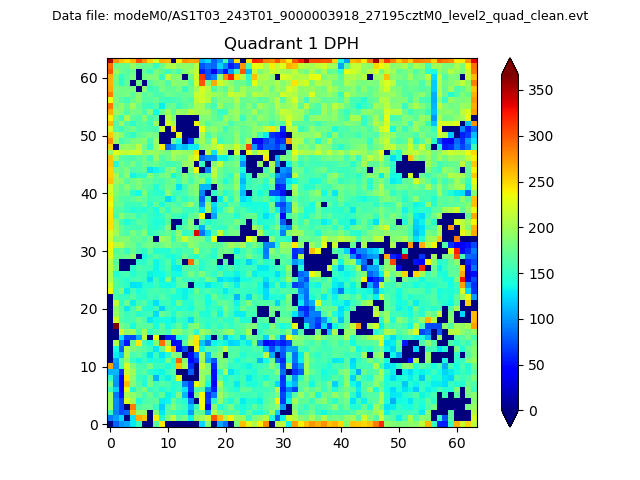 |
Quadrant B |
|---|---|---|---|
| Quadrant D | 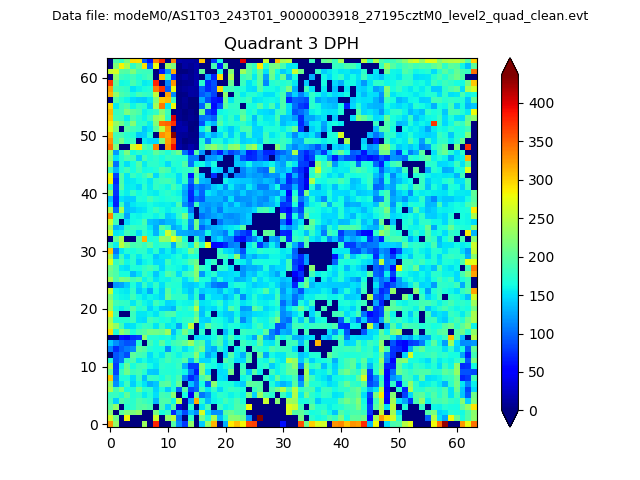 |
 |
Quadrant C |
| Plot type | Count rate plots | Images |
|---|---|---|
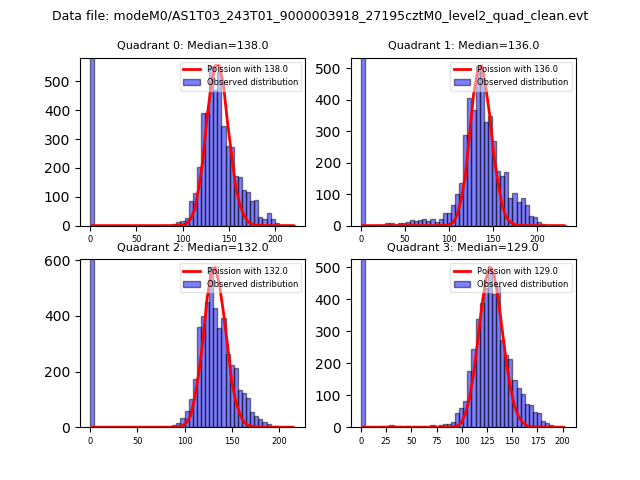
| Comparison with Poisson distribution Blue bars denote a histogram of data divided into 1 sec bins. Red curve is a Poisson curve with rate = median count rate of data. |
 |
 |
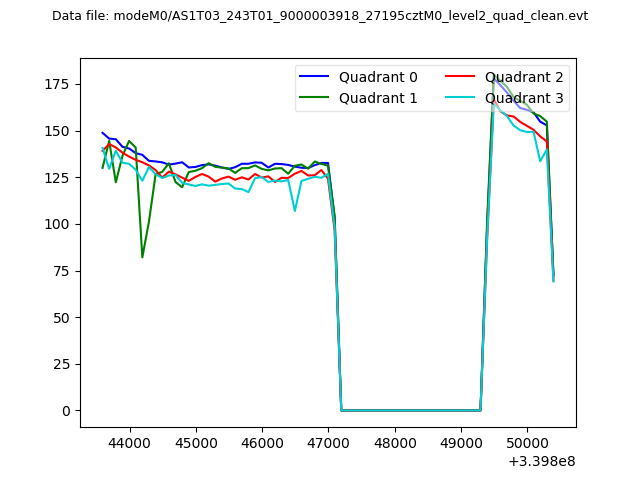
| Quadrant-wise count rates Data is divided into 100 sec bins |
 |
|
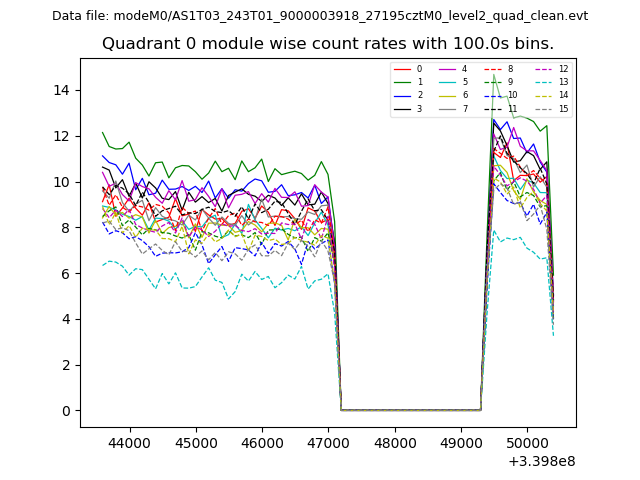
| Module-wise count rates for Quadrant A Data is divided into 100 sec bins |
 |
 |
| Module-wise count rates for Quadrant B Data is divided into 100 sec bins |
 |
 |
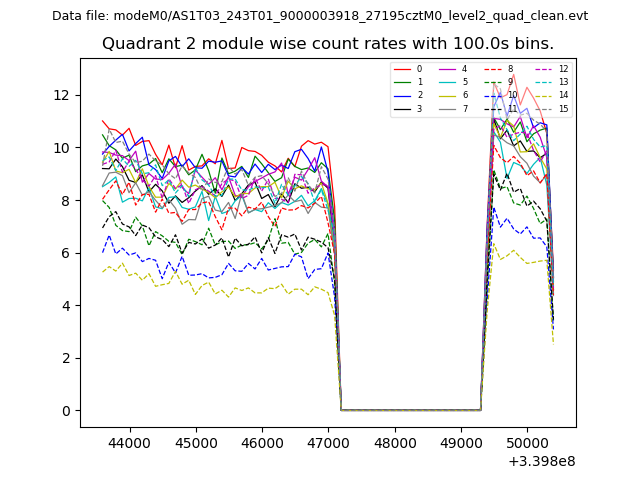
| Module-wise count rates for Quadrant C Data is divided into 100 sec bins |
 |
 |
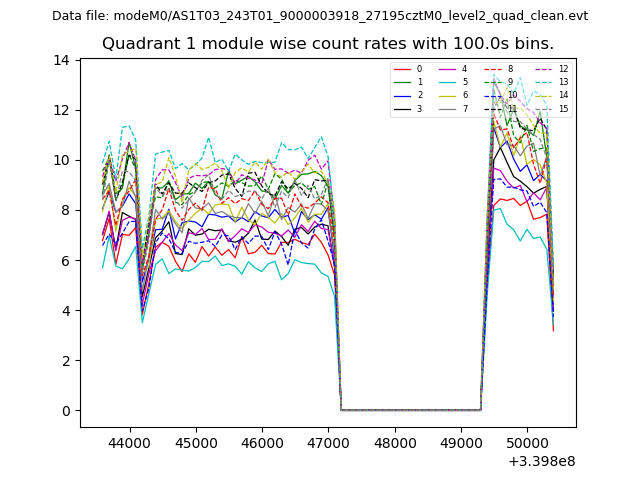
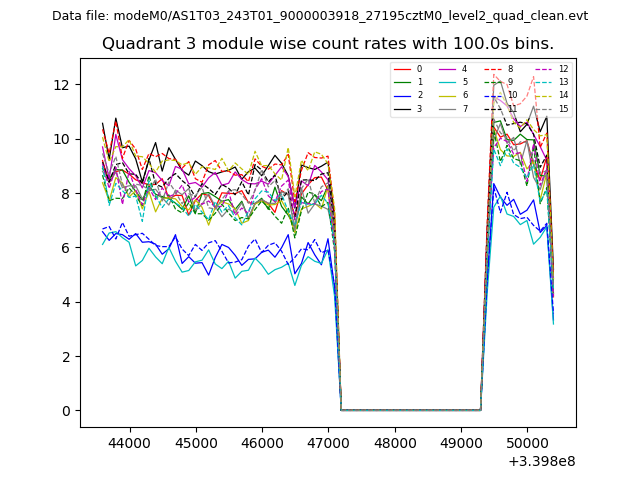
| Module-wise count rates for Quadrant D Data is divided into 100 sec bins |
 |
 |
| Parameter | Plot |
|---|---|
| CZT HV Monitor | 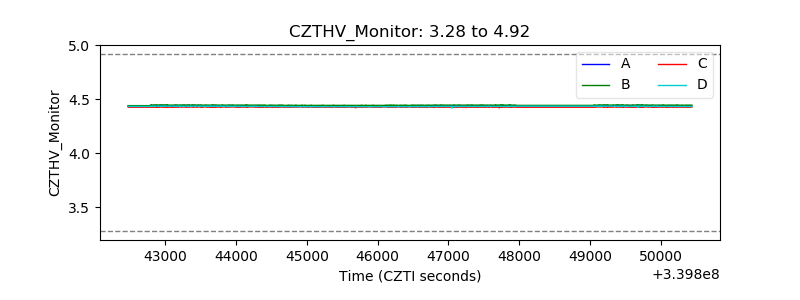 |
| D_VDD | 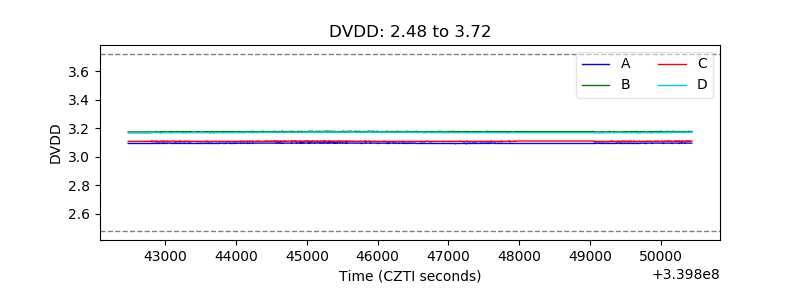 |
| Temperature 1 | 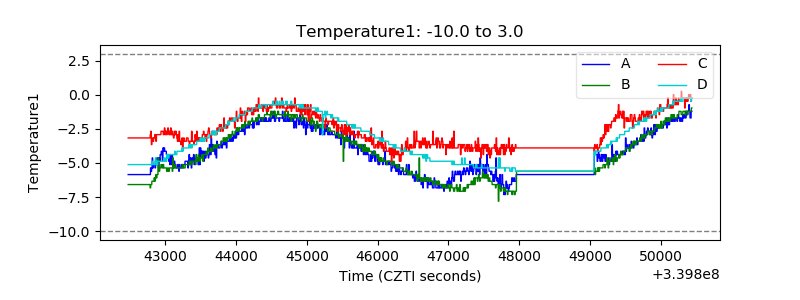 |
| Veto HV Monitor | 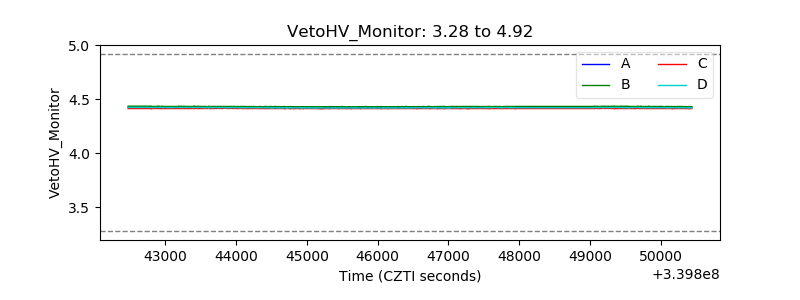 |
| Veto LLD | 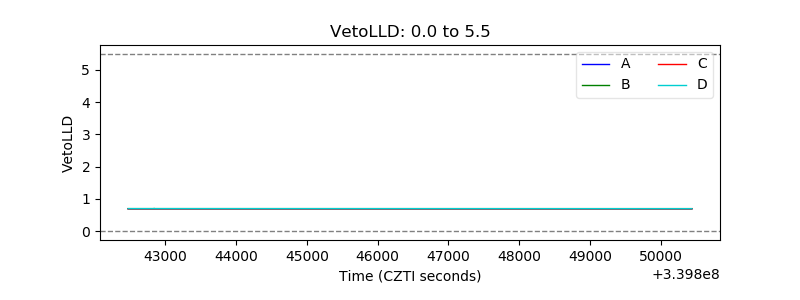 |
| Alpha Counter | 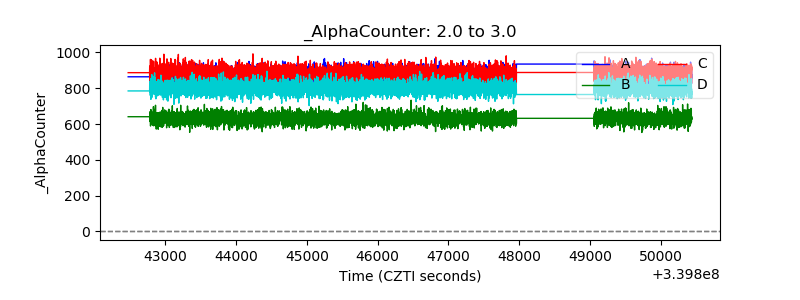 |
| _CPM_Rate | 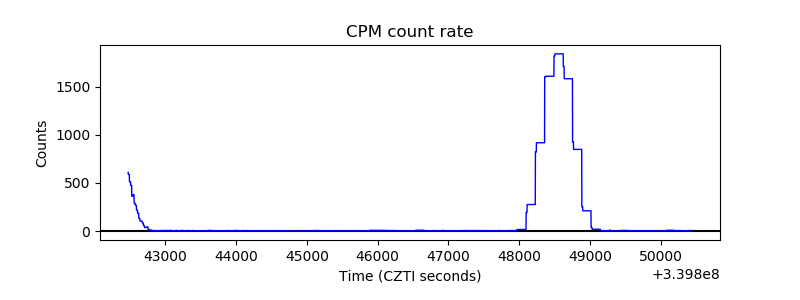 |
| CZT Counter | 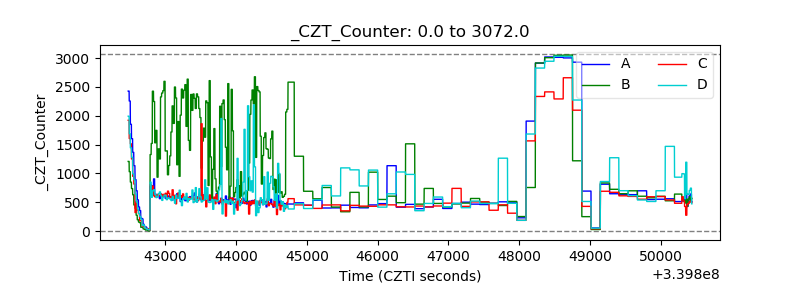 |
| +2.5 Volts monitor |  |
| +5 Volts monitor |  |
| _ROLL_ROT | 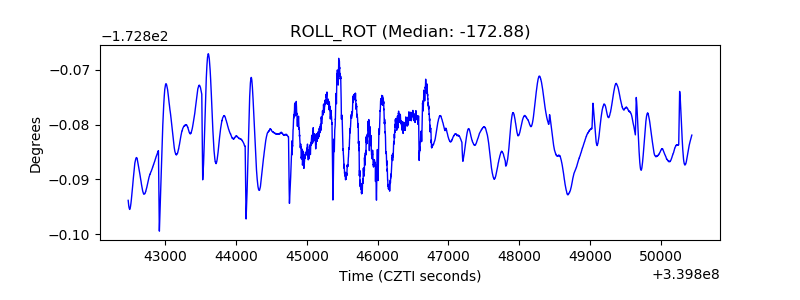 |
| _Roll_DEC | 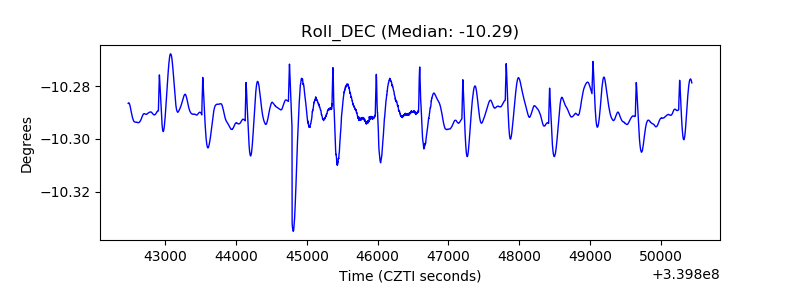 |
| _Roll_RA | 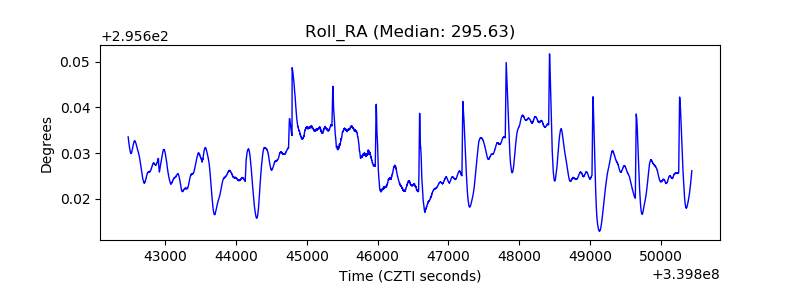 |
| Veto Counter | 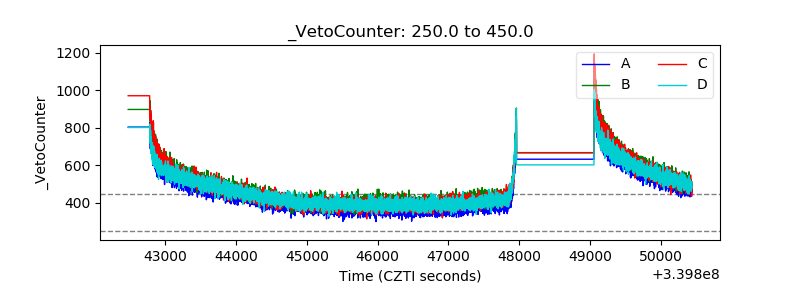 |