| Param | Original file | Final file |
|---|---|---|
| Filename | modeM0/AS1T03_243T01_9000003918_27196cztM0_level2.evt | modeM0/AS1T03_243T01_9000003918_27196cztM0_level2_quad_clean.evt |
| Size (bytes) | 538,133,760 | 113,365,440 |
| Size | 513.2 MB | 108.1 MB |
| Events in quadrant A | 3,626,764 | 775,530 |
| Events in quadrant B | 3,739,792 | 781,476 |
| Events in quadrant C | 3,427,365 | 728,820 |
| Events in quadrant D | 5,070,132 | 701,323 |
| Mode M9 | |||
|---|---|---|---|
| Quadrant | BADHDUFLAG | Total packets | Discarded packets |
| A | 0 | 12 | 0 |
| B | 0 | 12 | 0 |
| C | 0 | 12 | 0 |
| D | 0 | 12 | 0 |
| Mode M0 | |||
|---|---|---|---|
| Quadrant | BADHDUFLAG | Total packets | Discarded packets |
| A | 0 | 15028 | 0 |
| B | 0 | 15229 | 0 |
| C | 0 | 14421 | 0 |
| D | 0 | 19586 | 0 |
| Quadrant | Total seconds | Saturated seconds | Saturation percentage |
|---|---|---|---|
| A | 6394 | 89 | 1.391930% |
| B | 6395 | 112 | 1.751368% |
| C | 6395 | 133 | 2.079750% |
| D | 6395 | 404 | 6.317435% |
Noise dominated data is calculated using 1-second bins in cleaned event files. If a bin has >2000 counts, and if more than 50% of those come from <1% of pixels, then it is considered to be noise-dominated and hence unusable.
| Quadrant | # 1 sec bins | Bins with >0 counts | Bins with >2000 counts | High rate bins dominated by noise | Noise dominated (total time) | Noise dominated (detector-on time) | Marked lightcurve |
|---|---|---|---|---|---|---|---|
| A | 7589 | 6395 | 1 | 1 | 0.01% | 0.02% | 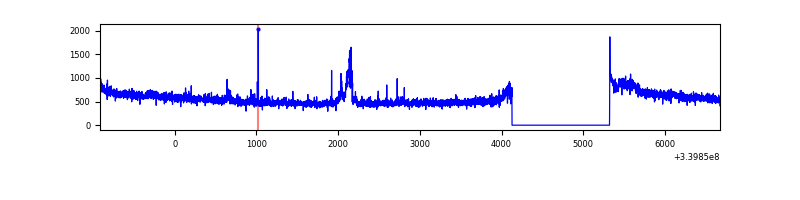 |
| B | 7590 | 6396 | 2 | 2 | 0.03% | 0.03% | 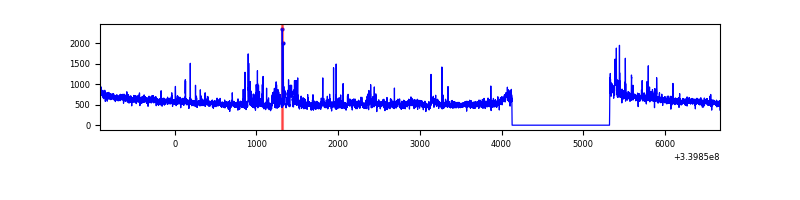 |
| C | 7590 | 6396 | 5 | 5 | 0.07% | 0.08% | 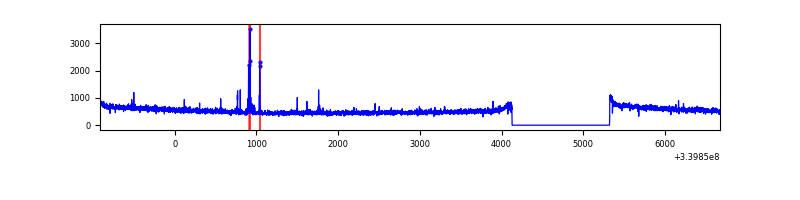 |
| D | 7590 | 6396 | 317 | 317 | 4.18% | 4.96% | 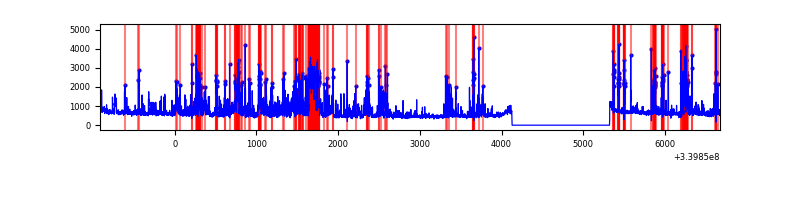 |
Top three noisy pixels from each quadrant. If the there are fewer than three noisy pixels in the level2.evt file, extra rows are filled as -1
| Pixel properties | Quadrant properties | ||||||
|---|---|---|---|---|---|---|---|
| Quadrant | DetID | PixID | Counts | Sigma | Mean | Median | Sigma |
| A | 15 | 174 | 100457 | 561.84 | 893 | 878 | 177.2 |
| A | 6 | 16 | 63621 | 354.01 | 893 | 878 | 177.2 |
| A | 13 | 248 | 10656 | 55.17 | 893 | 878 | 177.2 |
| B | 3 | 64 | 218312 | 1318.9 | 875 | 855 | 164.9 |
| B | 0 | 190 | 43291 | 257.38 | 875 | 855 | 164.9 |
| B | 10 | 245 | 33669 | 199.02 | 875 | 855 | 164.9 |
| C | 14 | 238 | 135552 | 699.92 | 832 | 837 | 192.5 |
| C | 15 | 208 | 36254 | 184.01 | 832 | 837 | 192.5 |
| C | 0 | 207 | 9264 | 43.78 | 832 | 837 | 192.5 |
| D | 1 | 52 | 977947 | 4956.1 | 839 | 821 | 197.2 |
| D | 7 | 38 | 267284 | 1351.53 | 839 | 821 | 197.2 |
| D | 12 | 233 | 266508 | 1347.6 | 839 | 821 | 197.2 |
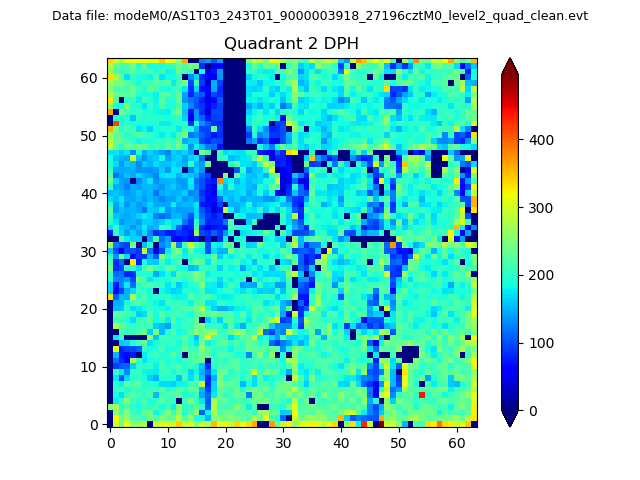
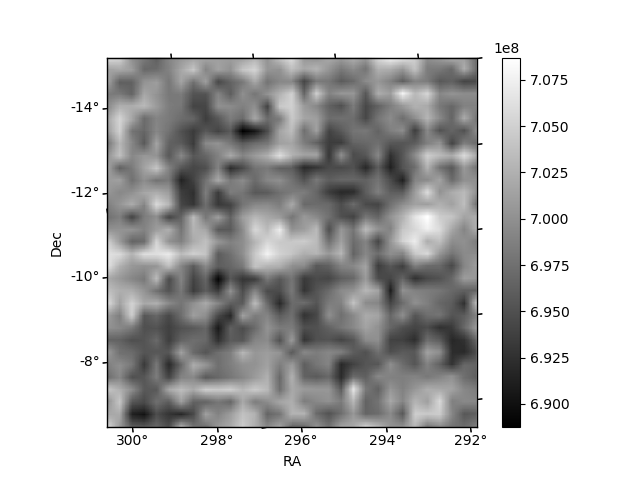
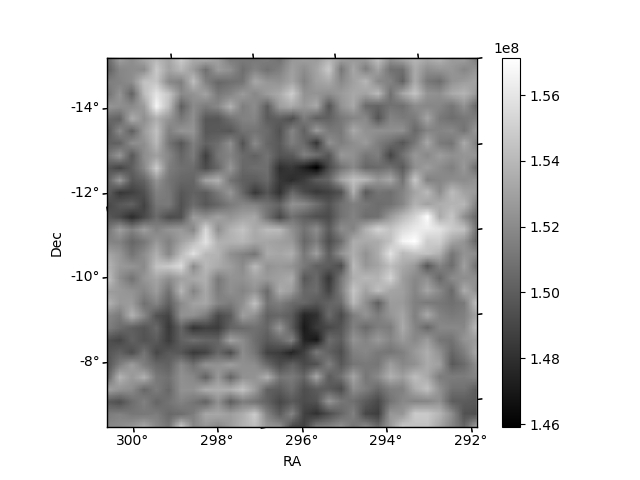
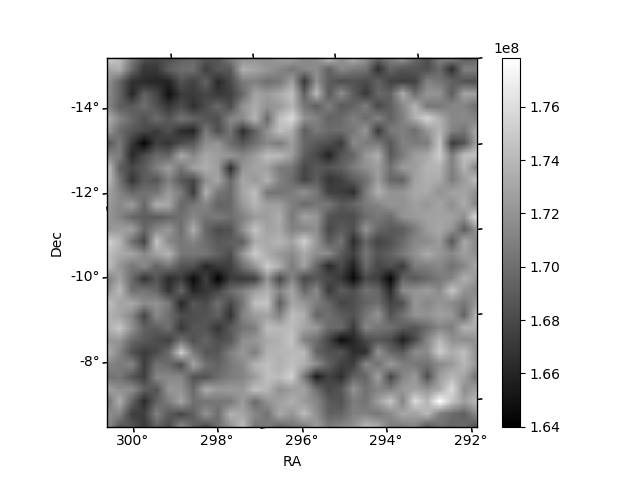
Histogram calculated using DETX and DETY for each event in the final _common_clean file
| Quadrant A | 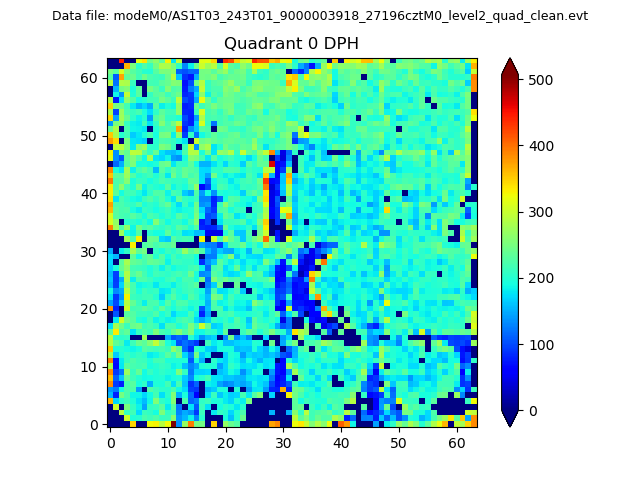 |
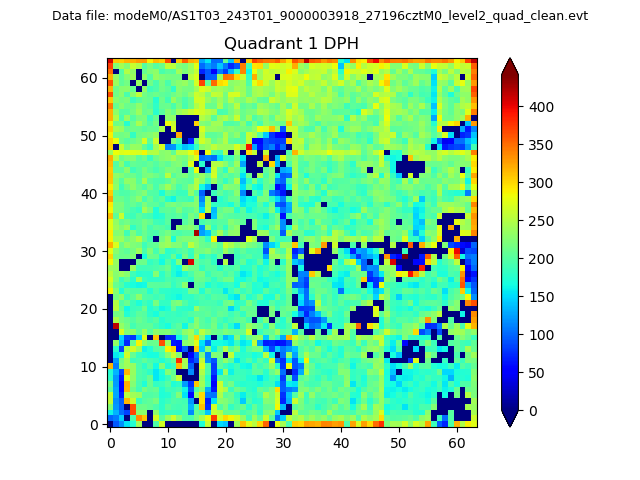 |
Quadrant B |
|---|---|---|---|
| Quadrant D | 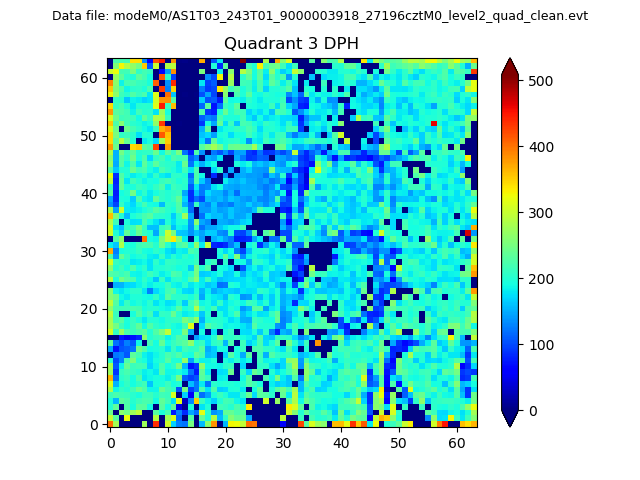 |
 |
Quadrant C |
| Plot type | Count rate plots | Images |
|---|---|---|
| Comparison with Poisson distribution Blue bars denote a histogram of data divided into 1 sec bins. Red curve is a Poisson curve with rate = median count rate of data. |
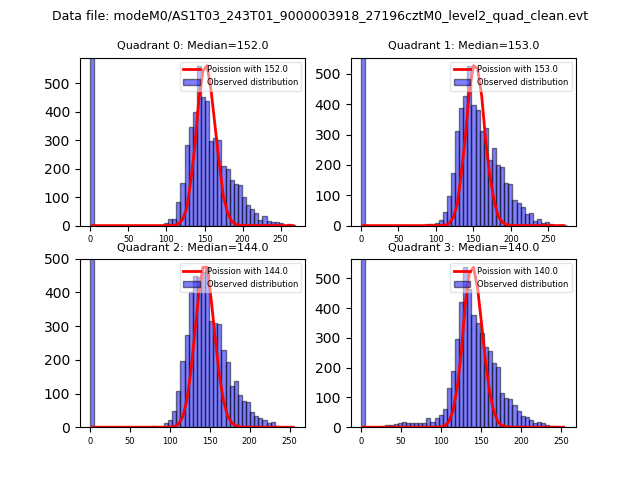 |
 |
| Quadrant-wise count rates Data is divided into 100 sec bins |
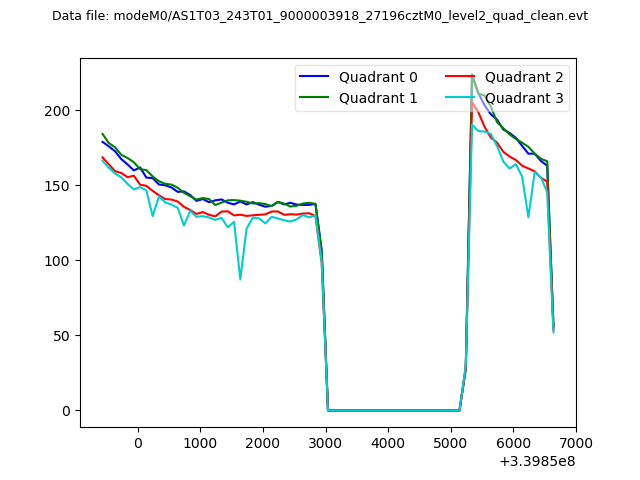 |
|
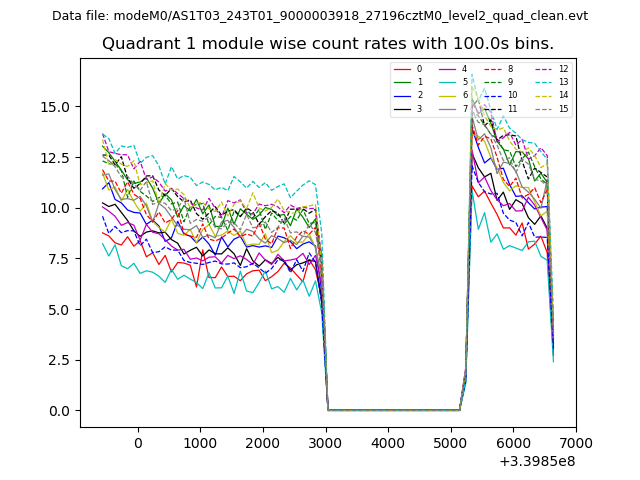
| Module-wise count rates for Quadrant A Data is divided into 100 sec bins |
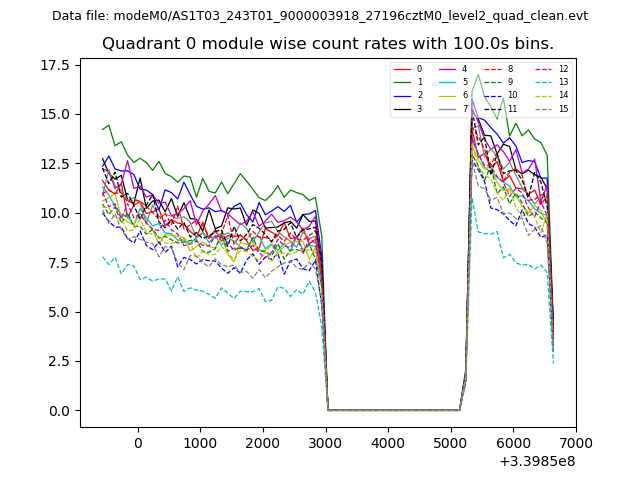 |
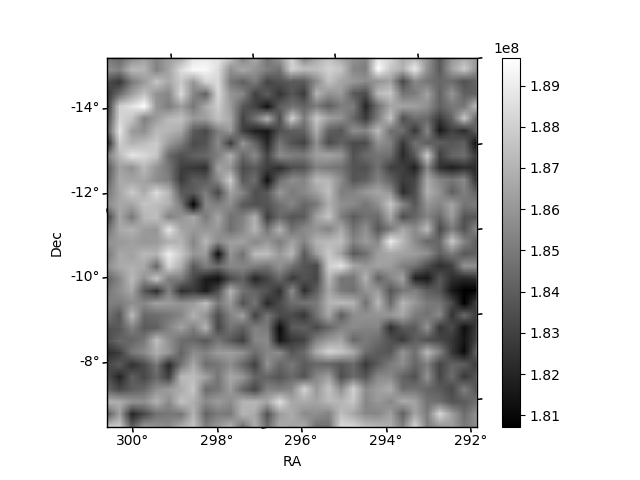 |
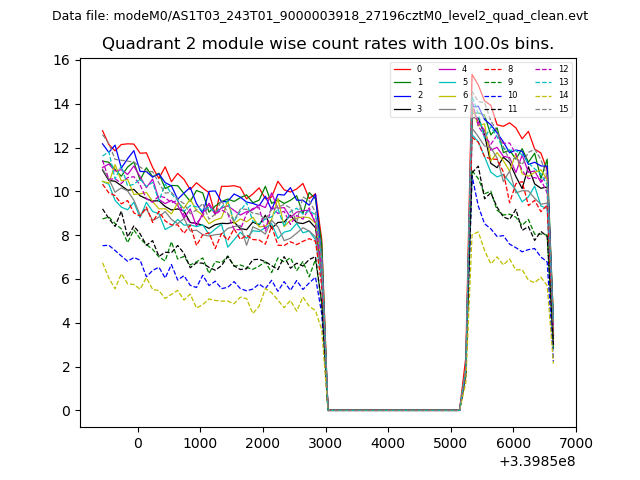
| Module-wise count rates for Quadrant B Data is divided into 100 sec bins |
 |
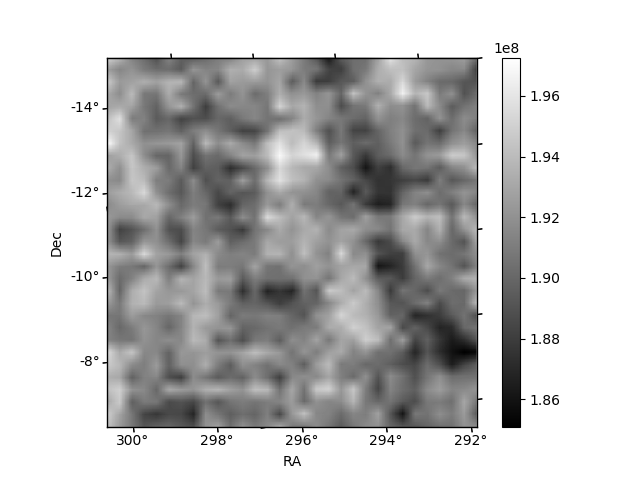 |
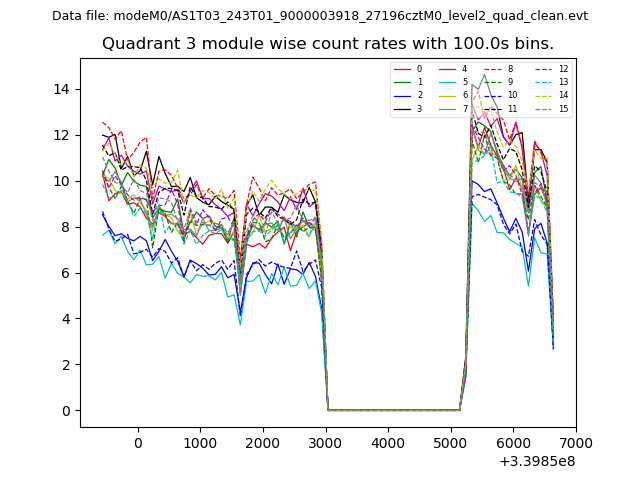
| Module-wise count rates for Quadrant C Data is divided into 100 sec bins |
 |
 |
| Module-wise count rates for Quadrant D Data is divided into 100 sec bins |
 |
 |
| Parameter | Plot |
|---|---|
| CZT HV Monitor | 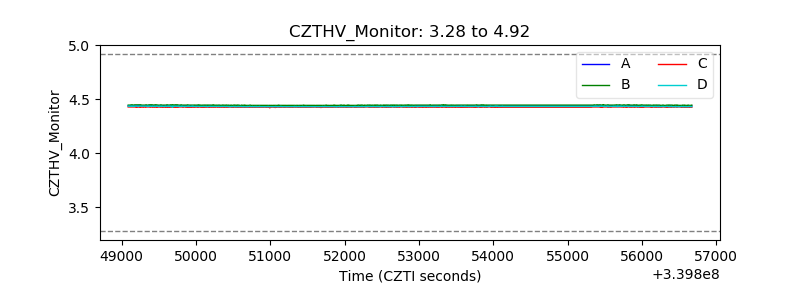 |
| D_VDD | 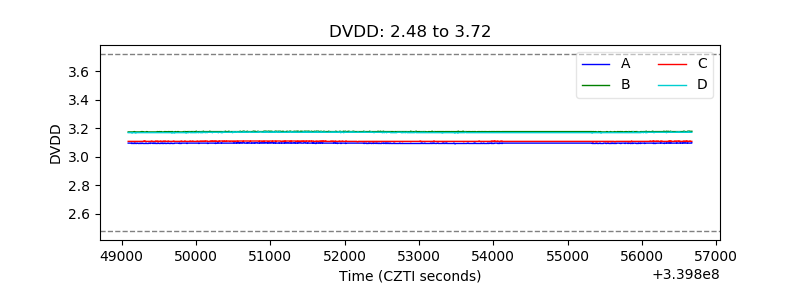 |
| Temperature 1 | 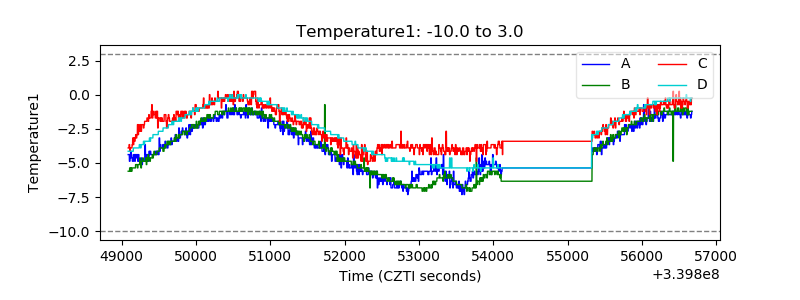 |
| Veto HV Monitor | 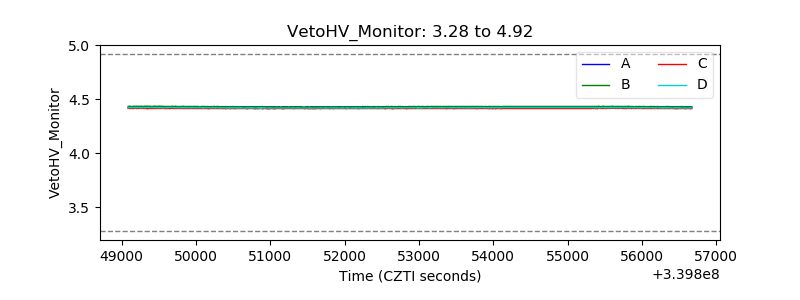 |
| Veto LLD | 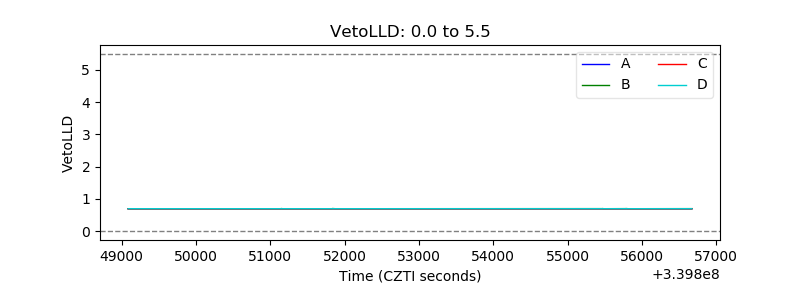 |
| Alpha Counter | 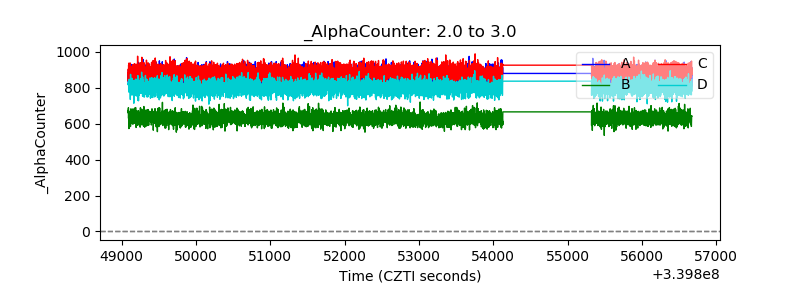 |
| _CPM_Rate | 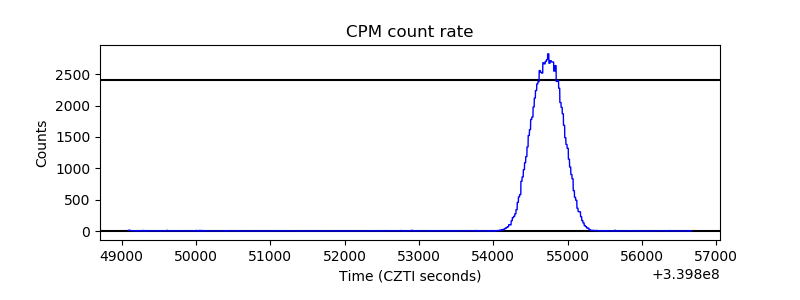 |
| CZT Counter |  |
| +2.5 Volts monitor |  |
| +5 Volts monitor |  |
| _ROLL_ROT | 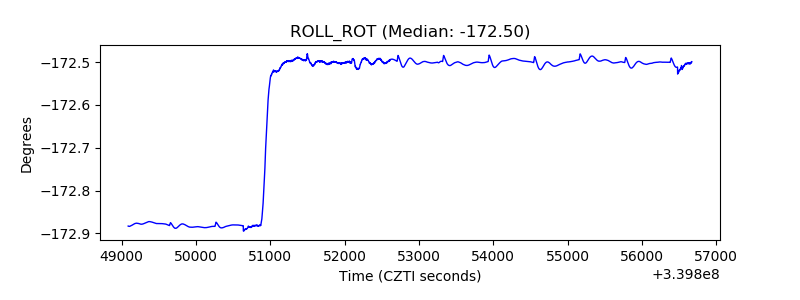 |
| _Roll_DEC |  |
| _Roll_RA | 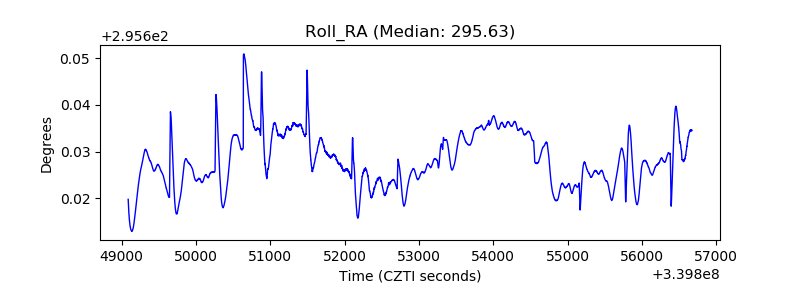 |
| Veto Counter | 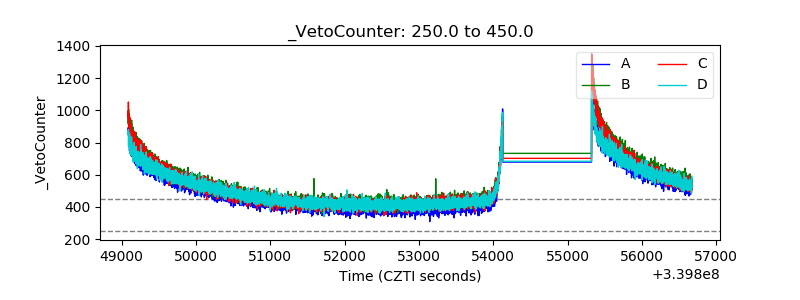 |