| Param | Original file | Final file |
|---|---|---|
| Filename | modeM0/AS1T03_243T01_9000003918_27198cztM0_level2.evt | modeM0/AS1T03_243T01_9000003918_27198cztM0_level2_quad_clean.evt |
| Size (bytes) | 537,393,600 | 112,104,000 |
| Size | 512.5 MB | 106.9 MB |
| Events in quadrant A | 3,522,811 | 768,673 |
| Events in quadrant B | 3,861,157 | 775,091 |
| Events in quadrant C | 3,415,831 | 720,834 |
| Events in quadrant D | 5,045,895 | 688,548 |
| Mode M9 | |||
|---|---|---|---|
| Quadrant | BADHDUFLAG | Total packets | Discarded packets |
| A | 0 | 13 | 0 |
| B | 0 | 13 | 0 |
| C | 0 | 13 | 0 |
| D | 0 | 13 | 0 |
| Mode M0 | |||
|---|---|---|---|
| Quadrant | BADHDUFLAG | Total packets | Discarded packets |
| A | 0 | 14516 | 0 |
| B | 0 | 15867 | 0 |
| C | 0 | 14057 | 0 |
| D | 0 | 19185 | 0 |
| Quadrant | Total seconds | Saturated seconds | Saturation percentage |
|---|---|---|---|
| A | 6330 | 90 | 1.421801% |
| B | 6331 | 107 | 1.690096% |
| C | 6331 | 123 | 1.942821% |
| D | 6331 | 390 | 6.160164% |
Noise dominated data is calculated using 1-second bins in cleaned event files. If a bin has >2000 counts, and if more than 50% of those come from <1% of pixels, then it is considered to be noise-dominated and hence unusable.
| Quadrant | # 1 sec bins | Bins with >0 counts | Bins with >2000 counts | High rate bins dominated by noise | Noise dominated (total time) | Noise dominated (detector-on time) | Marked lightcurve |
|---|---|---|---|---|---|---|---|
| A | 7685 | 6331 | 1 | 1 | 0.01% | 0.02% | 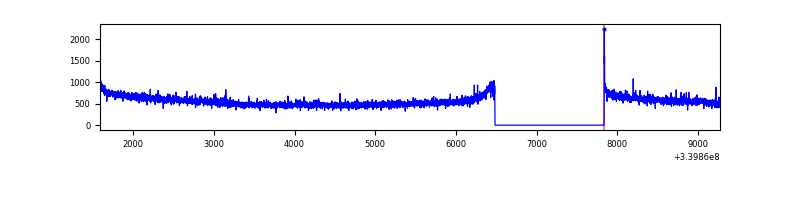 |
| B | 7686 | 6332 | 5 | 5 | 0.07% | 0.08% | 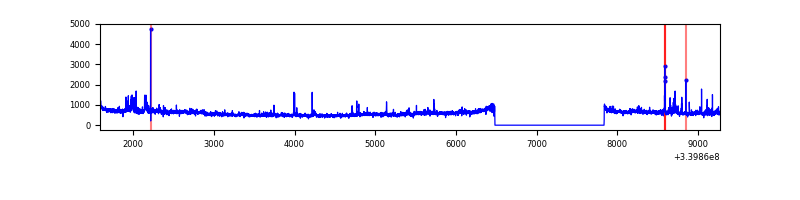 |
| C | 7686 | 6332 | 0 | 0 | 0.00% | 0.00% | 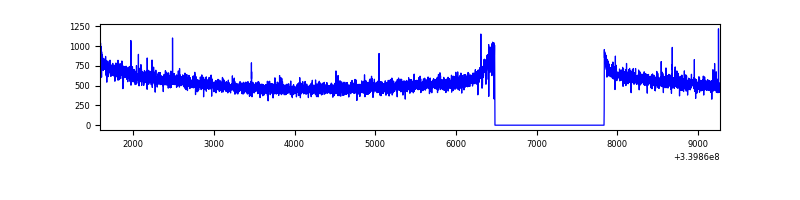 |
| D | 7686 | 6332 | 319 | 319 | 4.15% | 5.04% | 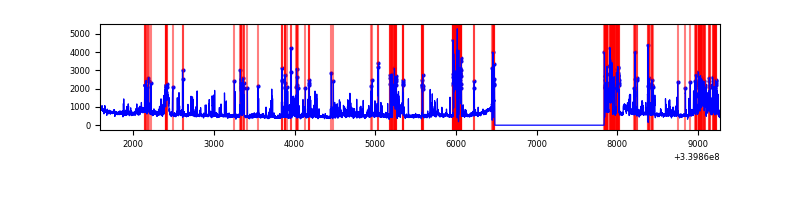 |
Top three noisy pixels from each quadrant. If the there are fewer than three noisy pixels in the level2.evt file, extra rows are filled as -1
| Pixel properties | Quadrant properties | ||||||
|---|---|---|---|---|---|---|---|
| Quadrant | DetID | PixID | Counts | Sigma | Mean | Median | Sigma |
| A | 6 | 16 | 41311 | 228.06 | 899 | 888 | 177.2 |
| A | 13 | 254 | 10800 | 55.92 | 899 | 888 | 177.2 |
| A | 0 | 226 | 7996 | 40.1 | 899 | 888 | 177.2 |
| B | 3 | 64 | 239660 | 1476.36 | 882 | 866 | 161.7 |
| B | 10 | 245 | 71417 | 436.19 | 882 | 866 | 161.7 |
| B | 5 | 172 | 28776 | 172.56 | 882 | 866 | 161.7 |
| C | 14 | 238 | 136280 | 694.8 | 838 | 845 | 194.9 |
| C | 15 | 208 | 14059 | 67.79 | 838 | 845 | 194.9 |
| C | 13 | 61 | 5871 | 25.78 | 838 | 845 | 194.9 |
| D | 1 | 52 | 1008780 | 4620.71 | 826 | 813 | 218.1 |
| D | 2 | 250 | 282372 | 1290.72 | 826 | 813 | 218.1 |
| D | 5 | 222 | 240962 | 1100.89 | 826 | 813 | 218.1 |
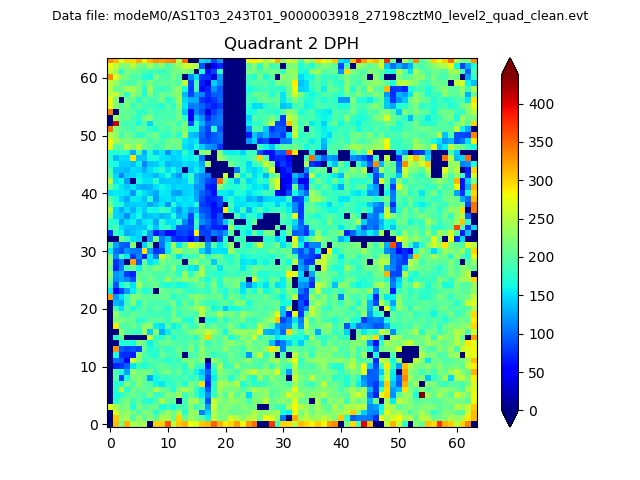
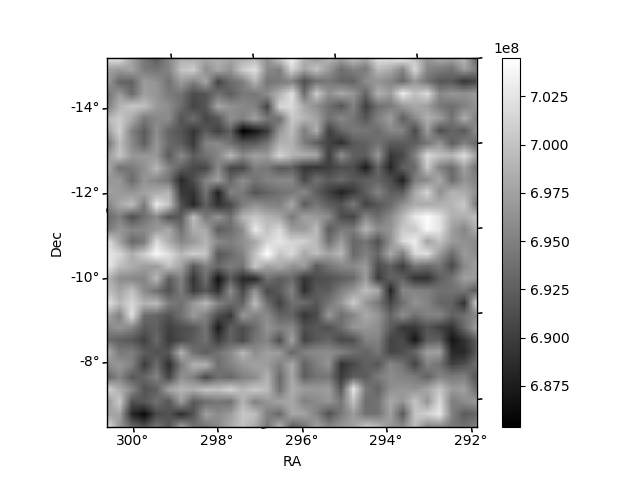
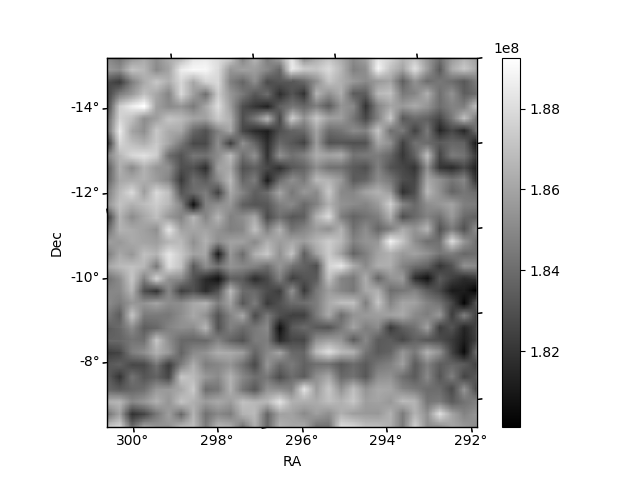
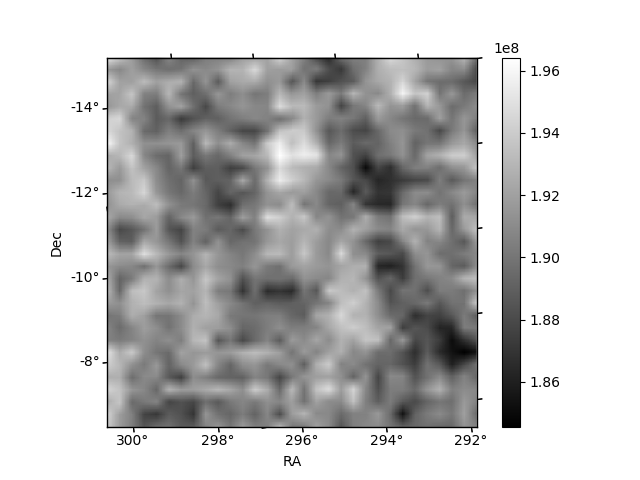
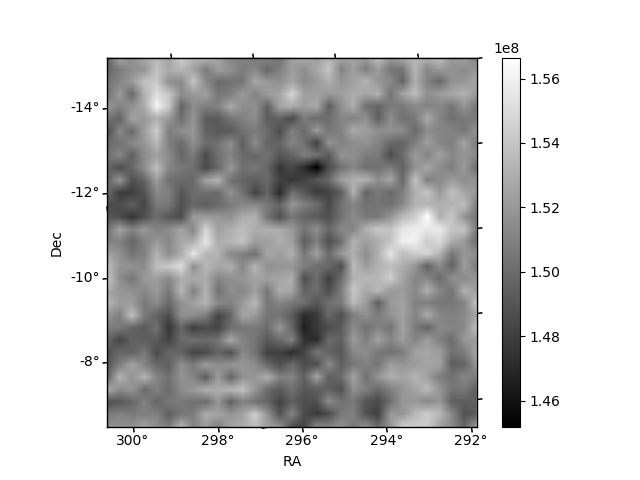
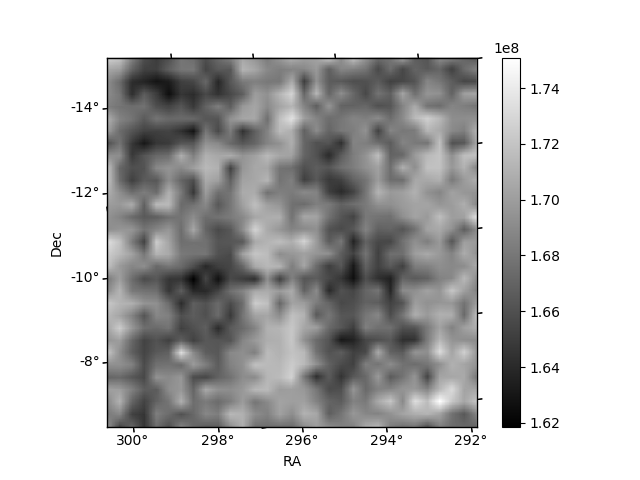
Histogram calculated using DETX and DETY for each event in the final _common_clean file
| Quadrant A | 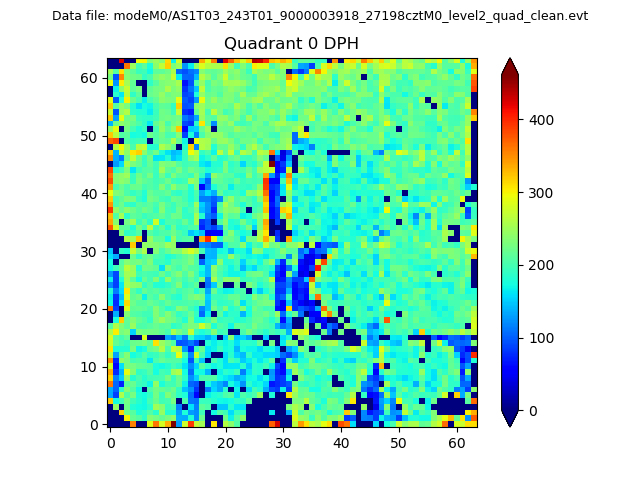 |
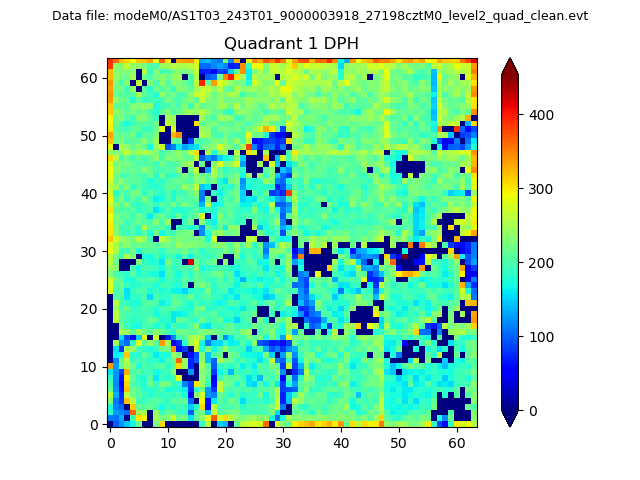 |
Quadrant B |
|---|---|---|---|
| Quadrant D | 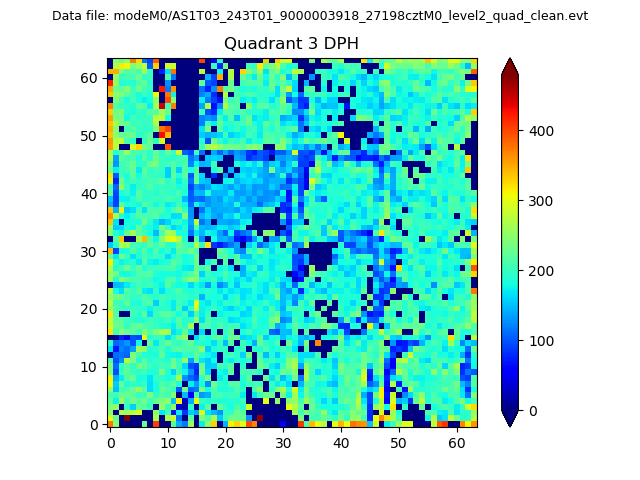 |
 |
Quadrant C |
| Plot type | Count rate plots | Images |
|---|---|---|
| Comparison with Poisson distribution Blue bars denote a histogram of data divided into 1 sec bins. Red curve is a Poisson curve with rate = median count rate of data. |
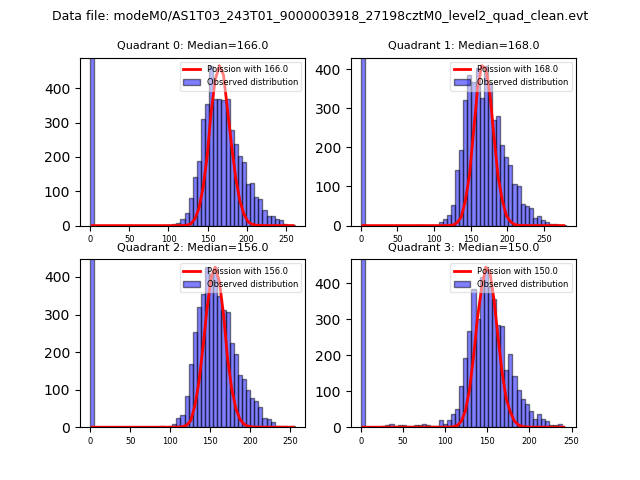 |
 |
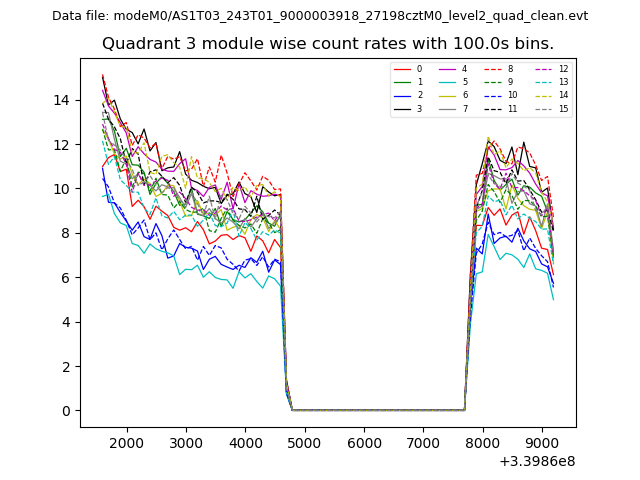
| Quadrant-wise count rates Data is divided into 100 sec bins |
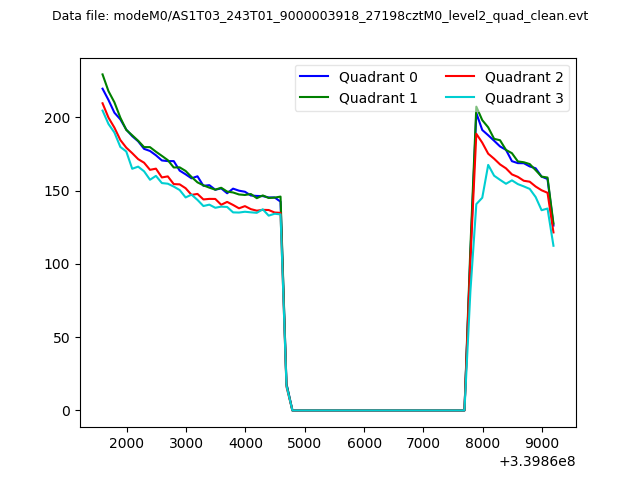 |
|
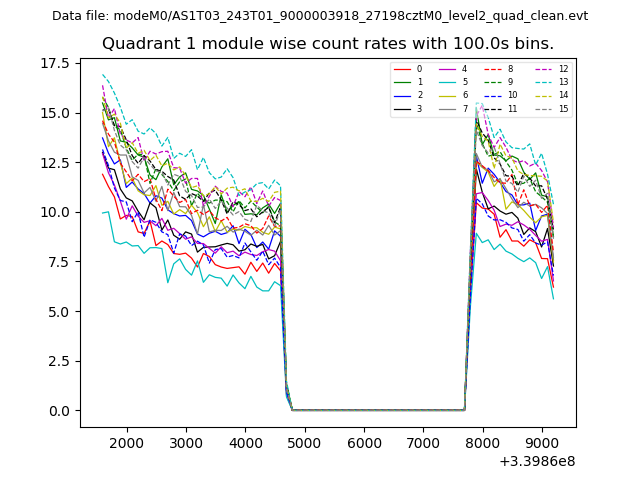
| Module-wise count rates for Quadrant A Data is divided into 100 sec bins |
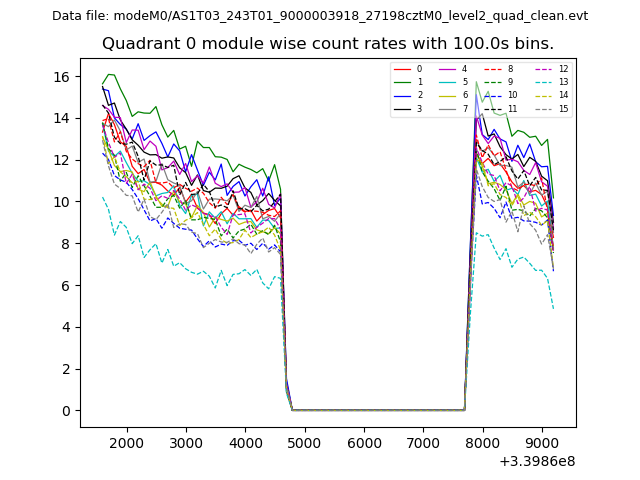 |
 |
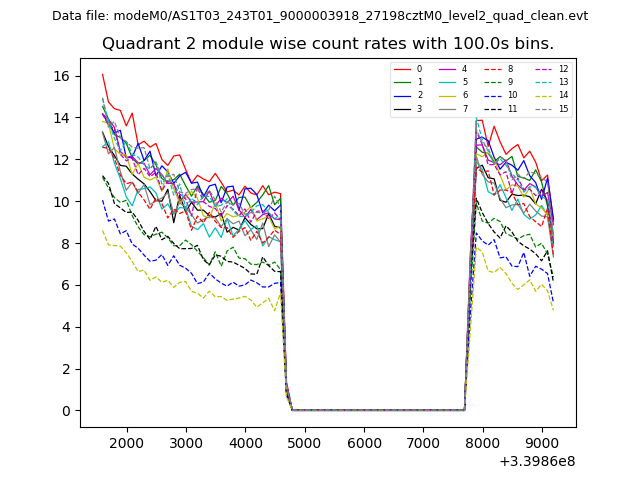
| Module-wise count rates for Quadrant B Data is divided into 100 sec bins |
 |
 |
| Module-wise count rates for Quadrant C Data is divided into 100 sec bins |
 |
 |
| Module-wise count rates for Quadrant D Data is divided into 100 sec bins |
 |
 |
| Parameter | Plot |
|---|---|
| CZT HV Monitor | 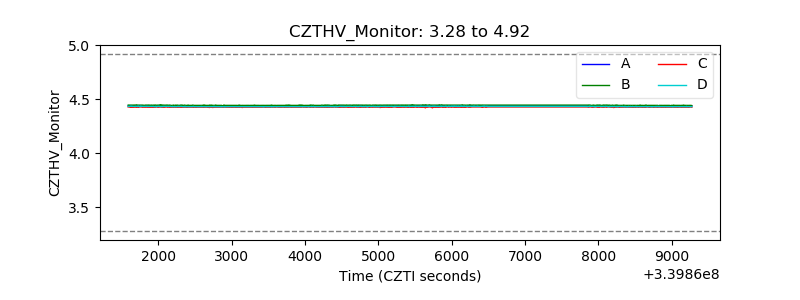 |
| D_VDD | 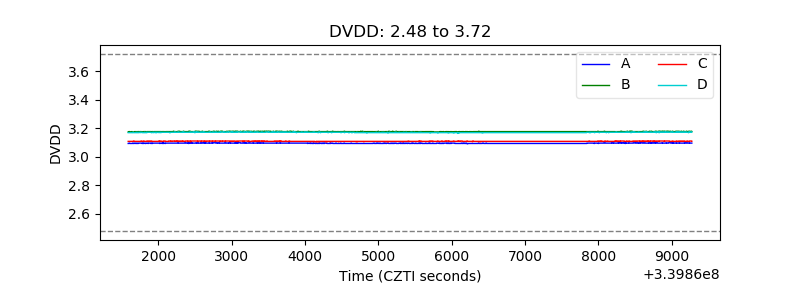 |
| Temperature 1 | 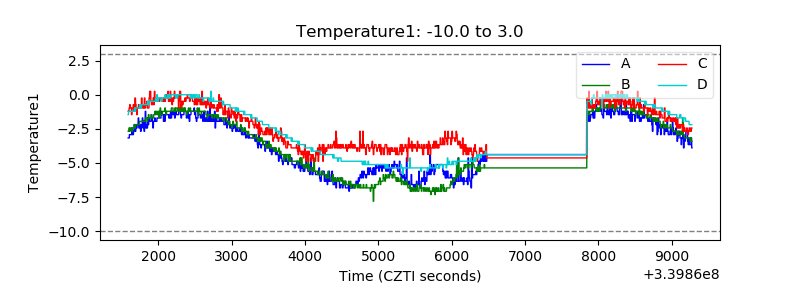 |
| Veto HV Monitor | 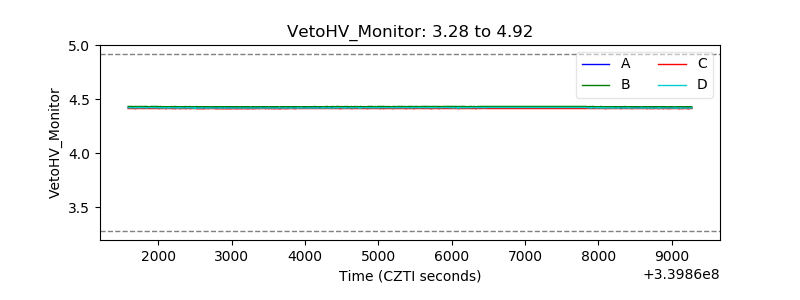 |
| Veto LLD | 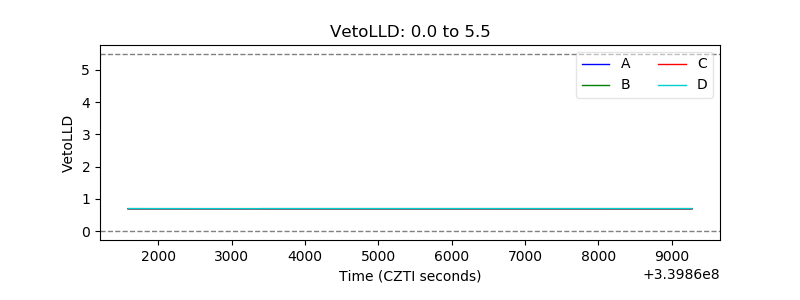 |
| Alpha Counter | 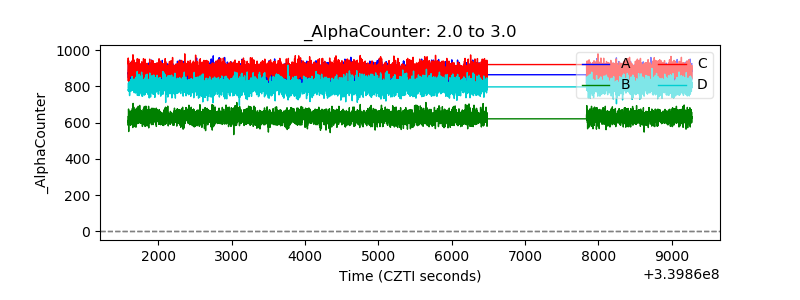 |
| _CPM_Rate | 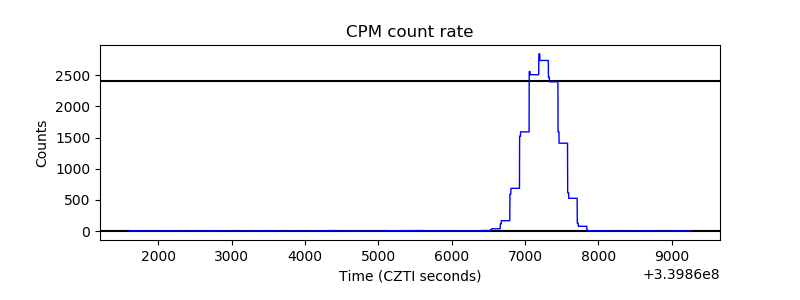 |
| CZT Counter | 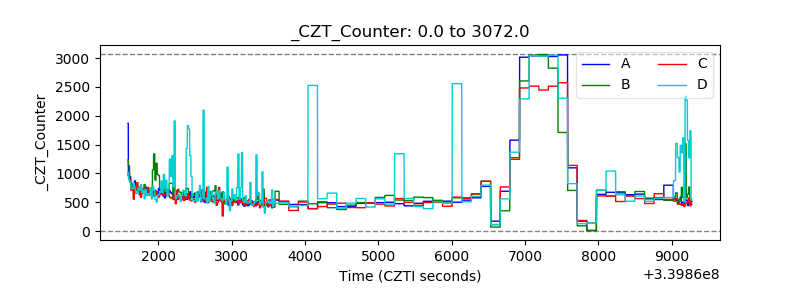 |
| +2.5 Volts monitor |  |
| +5 Volts monitor |  |
| _ROLL_ROT | 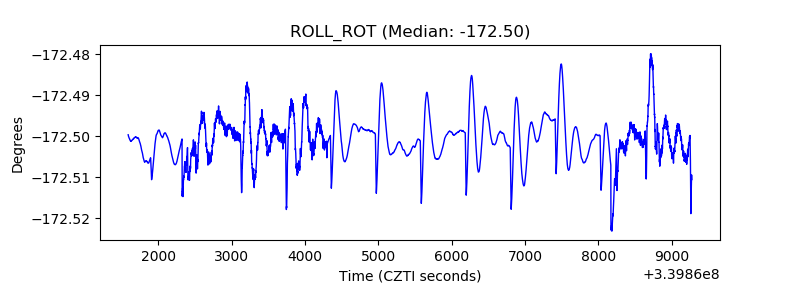 |
| _Roll_DEC | 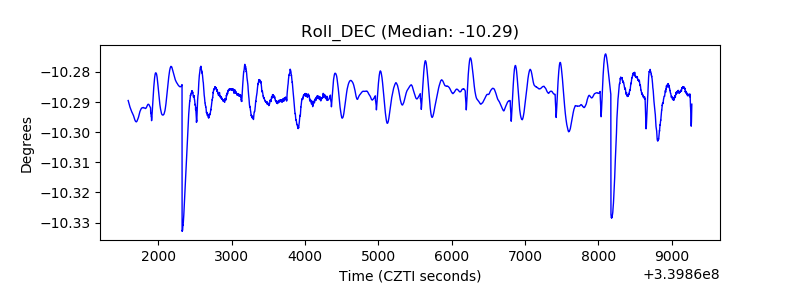 |
| _Roll_RA | 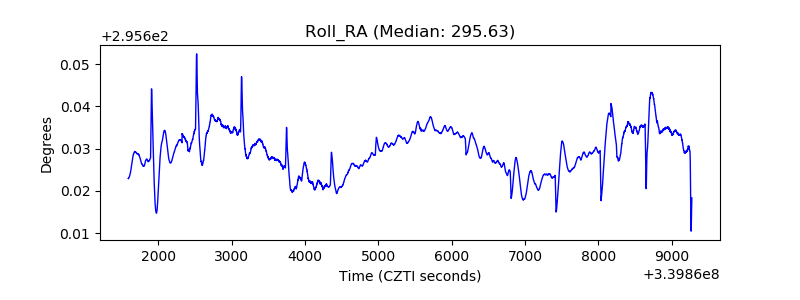 |
| Veto Counter | 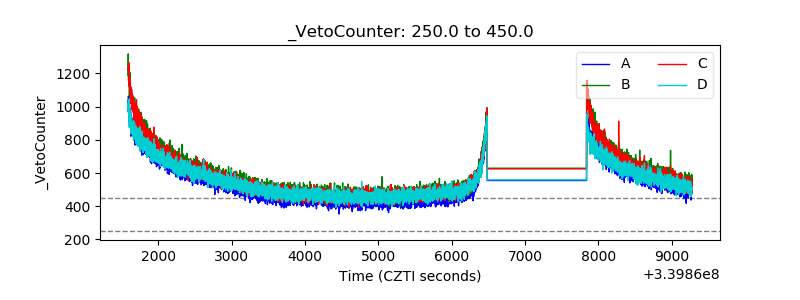 |