| Param | Original file | Final file |
|---|---|---|
| Filename | modeM0/AS1T03_243T01_9000003918_27199cztM0_level2.evt | modeM0/AS1T03_243T01_9000003918_27199cztM0_level2_quad_clean.evt |
| Size (bytes) | 559,883,520 | 97,318,080 |
| Size | 533.9 MB | 92.8 MB |
| Events in quadrant A | 3,368,943 | 657,998 |
| Events in quadrant B | 4,843,287 | 650,668 |
| Events in quadrant C | 3,277,419 | 621,174 |
| Events in quadrant D | 5,041,229 | 579,194 |
| Mode M9 | |||
|---|---|---|---|
| Quadrant | BADHDUFLAG | Total packets | Discarded packets |
| A | 0 | 15 | 0 |
| B | 0 | 16 | 0 |
| C | 0 | 16 | 0 |
| D | 0 | 16 | 0 |
| Mode M0 | |||
|---|---|---|---|
| Quadrant | BADHDUFLAG | Total packets | Discarded packets |
| A | 0 | 13929 | 0 |
| B | 0 | 18624 | 0 |
| C | 0 | 13565 | 0 |
| D | 0 | 19134 | 0 |
| Quadrant | Total seconds | Saturated seconds | Saturation percentage |
|---|---|---|---|
| A | 6276 | 86 | 1.370300% |
| B | 6276 | 486 | 7.743786% |
| C | 6276 | 110 | 1.752709% |
| D | 6275 | 408 | 6.501992% |
Noise dominated data is calculated using 1-second bins in cleaned event files. If a bin has >2000 counts, and if more than 50% of those come from <1% of pixels, then it is considered to be noise-dominated and hence unusable.
| Quadrant | # 1 sec bins | Bins with >0 counts | Bins with >2000 counts | High rate bins dominated by noise | Noise dominated (total time) | Noise dominated (detector-on time) | Marked lightcurve |
|---|---|---|---|---|---|---|---|
| A | 7611 | 6277 | 2 | 2 | 0.03% | 0.03% | 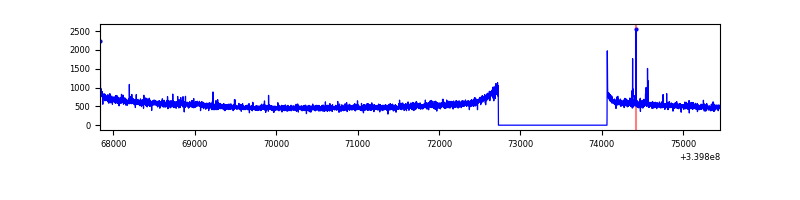 |
| B | 7611 | 6277 | 240 | 240 | 3.15% | 3.82% | 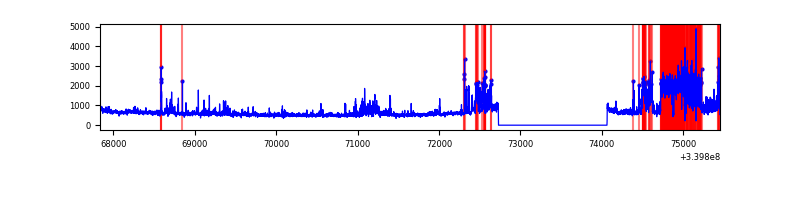 |
| C | 7611 | 6277 | 0 | 0 | 0.00% | 0.00% | 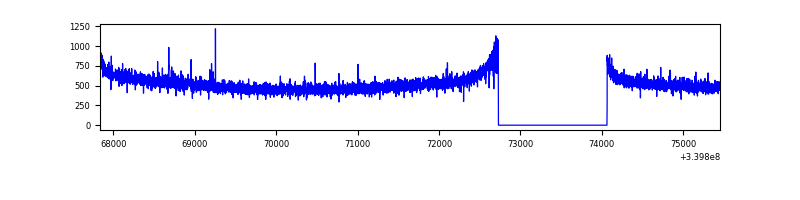 |
| D | 7610 | 6276 | 342 | 342 | 4.49% | 5.45% | 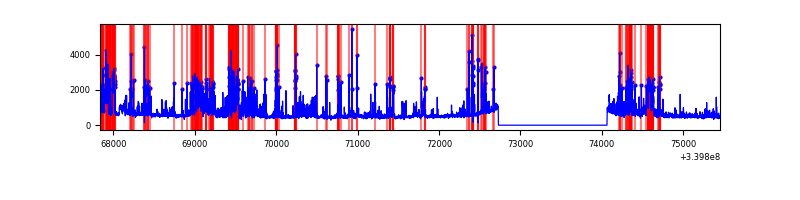 |
Top three noisy pixels from each quadrant. If the there are fewer than three noisy pixels in the level2.evt file, extra rows are filled as -1
| Pixel properties | Quadrant properties | ||||||
|---|---|---|---|---|---|---|---|
| Quadrant | DetID | PixID | Counts | Sigma | Mean | Median | Sigma |
| A | 6 | 16 | 32441 | 183.62 | 856 | 843 | 172.1 |
| A | 13 | 248 | 18857 | 104.68 | 856 | 843 | 172.1 |
| A | 8 | 192 | 13400 | 72.97 | 856 | 843 | 172.1 |
| B | 3 | 64 | 788591 | 5084.48 | 834 | 818 | 154.9 |
| B | 0 | 189 | 675809 | 4356.56 | 834 | 818 | 154.9 |
| B | 5 | 172 | 47309 | 300.06 | 834 | 818 | 154.9 |
| C | 14 | 238 | 131931 | 694.26 | 805 | 811 | 188.9 |
| C | 15 | 208 | 8721 | 41.88 | 805 | 811 | 188.9 |
| C | 13 | 61 | 5526 | 24.97 | 805 | 811 | 188.9 |
| D | 1 | 52 | 815189 | 4345.81 | 796 | 776 | 187.4 |
| D | 5 | 222 | 482681 | 2571.5 | 796 | 776 | 187.4 |
| D | 2 | 250 | 463244 | 2467.79 | 796 | 776 | 187.4 |
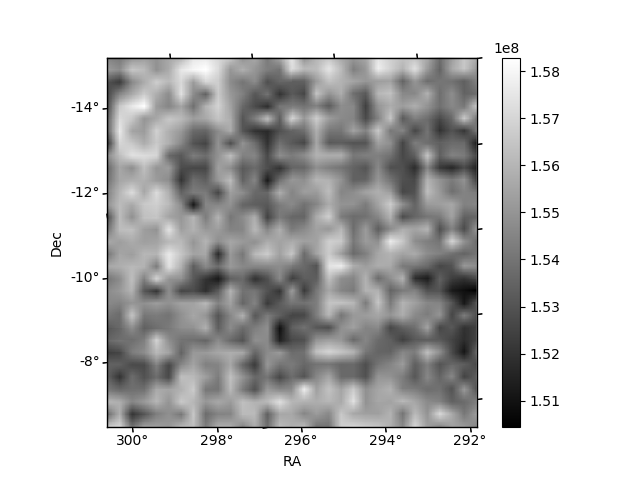
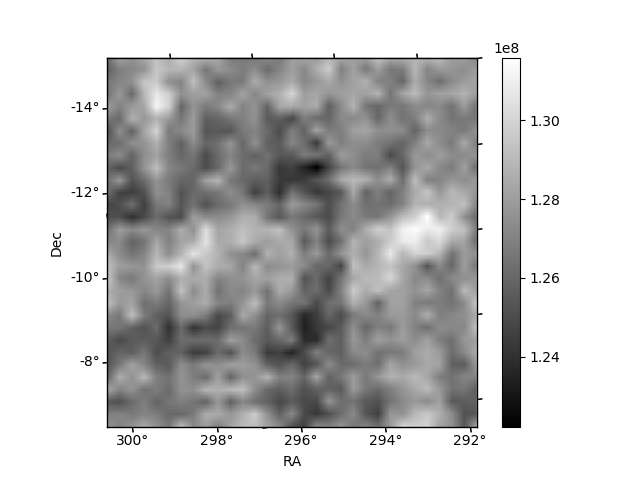
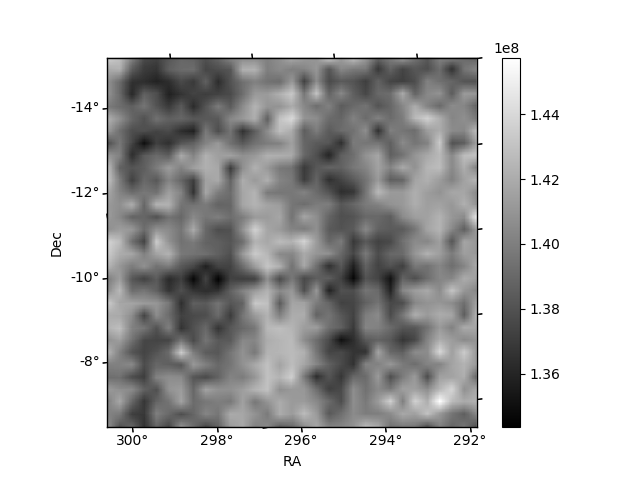
Histogram calculated using DETX and DETY for each event in the final _common_clean file
| Quadrant A | 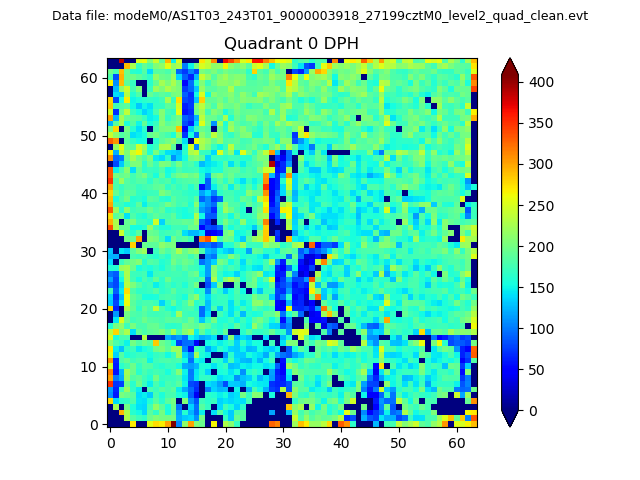 |
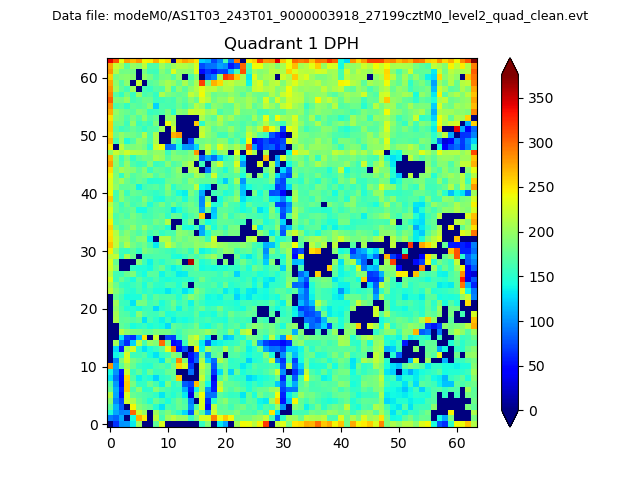 |
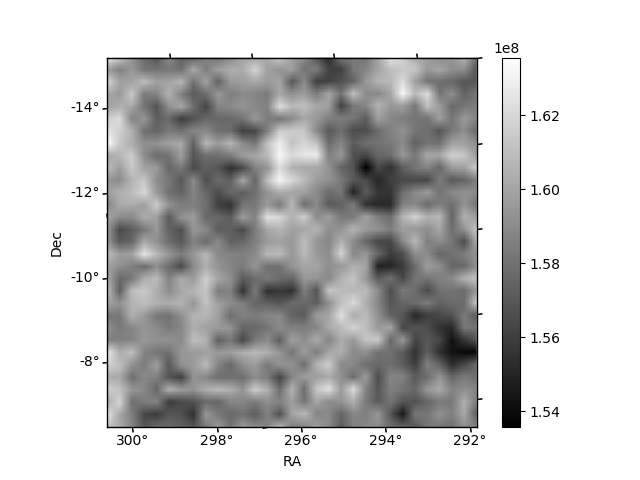
Quadrant B |
|---|---|---|---|
| Quadrant D | 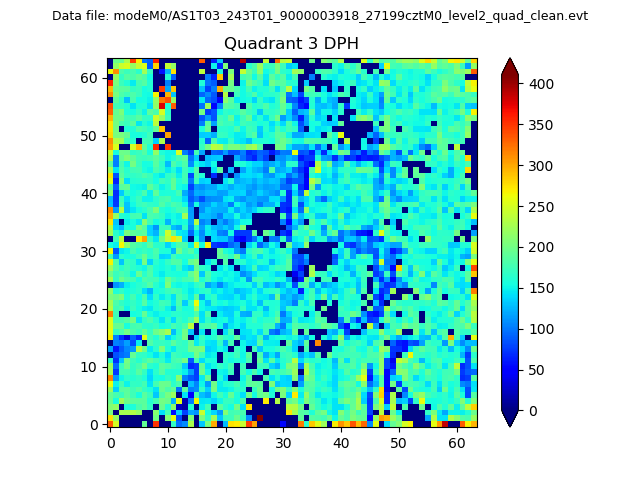 |
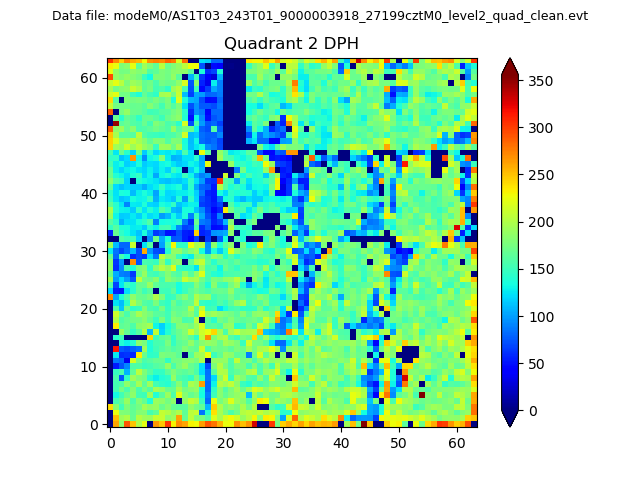 |
Quadrant C |
| Plot type | Count rate plots | Images |
|---|---|---|
| Comparison with Poisson distribution Blue bars denote a histogram of data divided into 1 sec bins. Red curve is a Poisson curve with rate = median count rate of data. |
 |
 |
| Quadrant-wise count rates Data is divided into 100 sec bins |
 |
|
| Module-wise count rates for Quadrant A Data is divided into 100 sec bins |
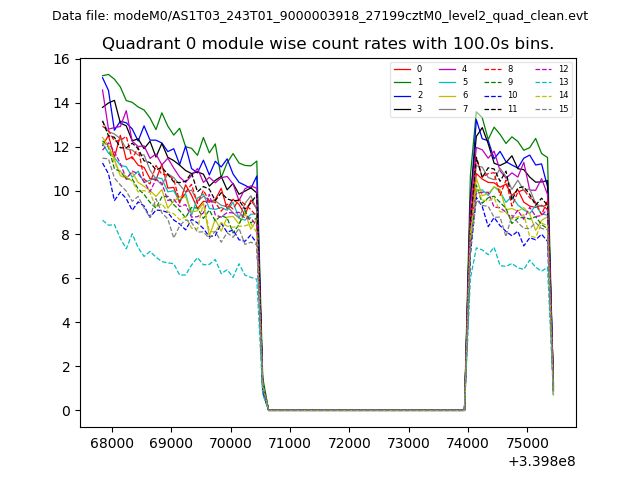 |
 |
| Module-wise count rates for Quadrant B Data is divided into 100 sec bins |
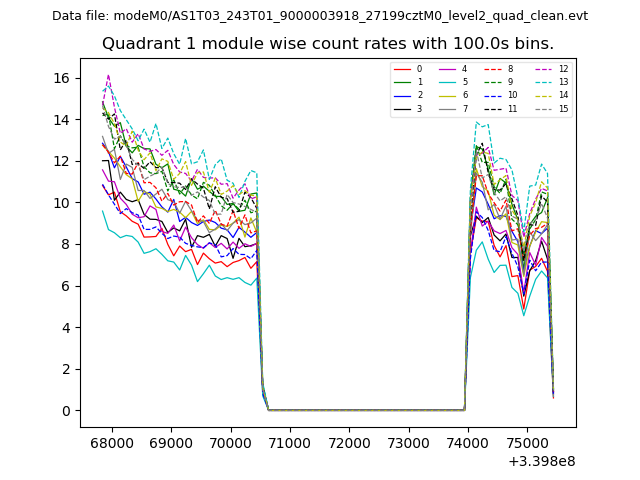 |
 |
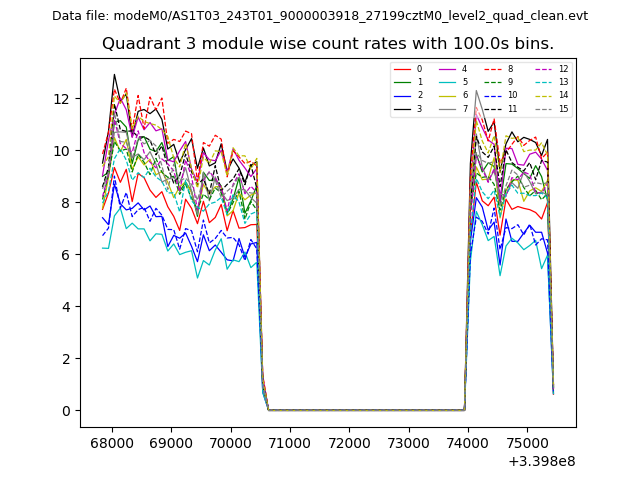
| Module-wise count rates for Quadrant C Data is divided into 100 sec bins |
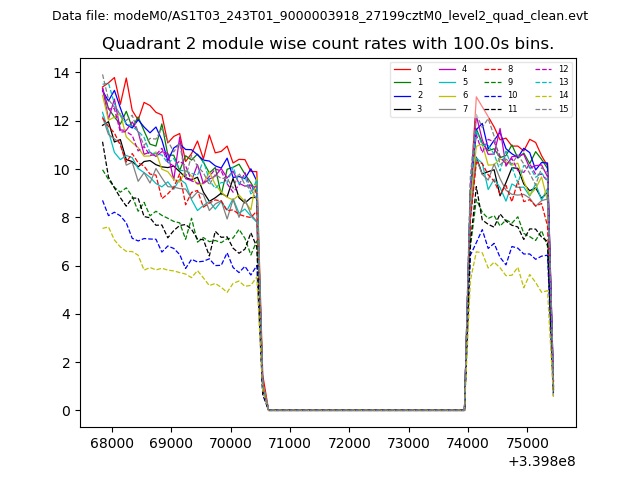 |
 |
| Module-wise count rates for Quadrant D Data is divided into 100 sec bins |
 |
 |
| Parameter | Plot |
|---|---|
| CZT HV Monitor | 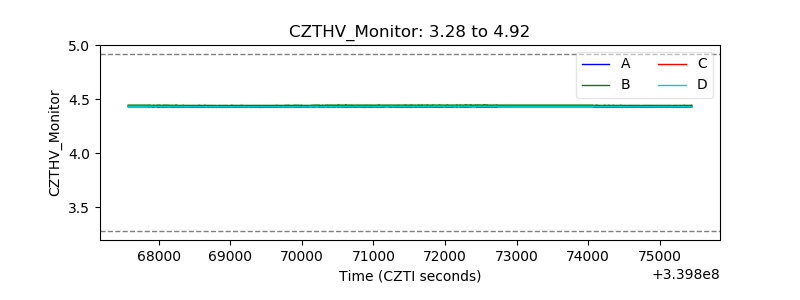 |
| D_VDD | 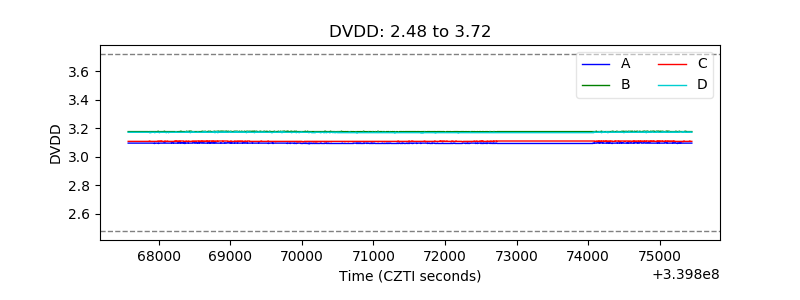 |
| Temperature 1 | 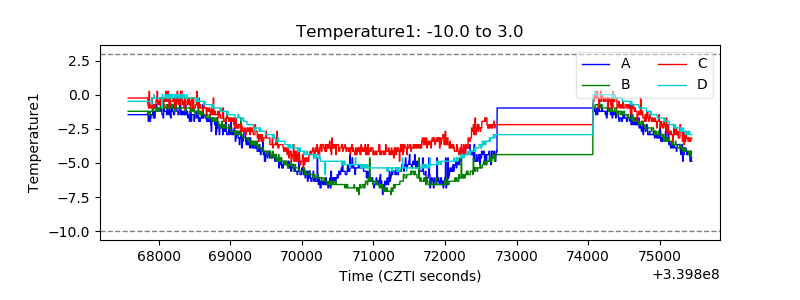 |
| Veto HV Monitor | 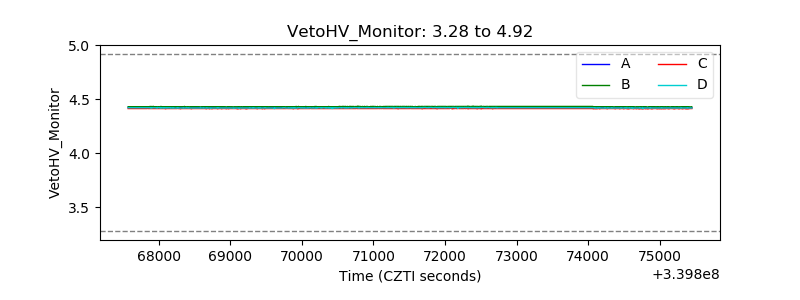 |
| Veto LLD | 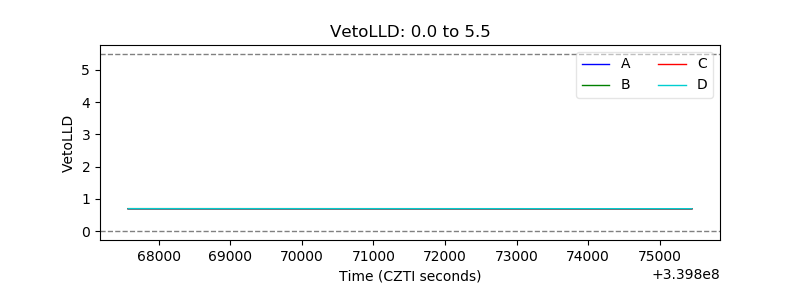 |
| Alpha Counter |  |
| _CPM_Rate | 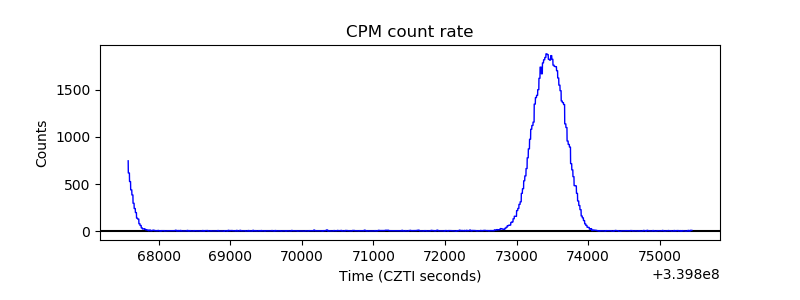 |
| CZT Counter | 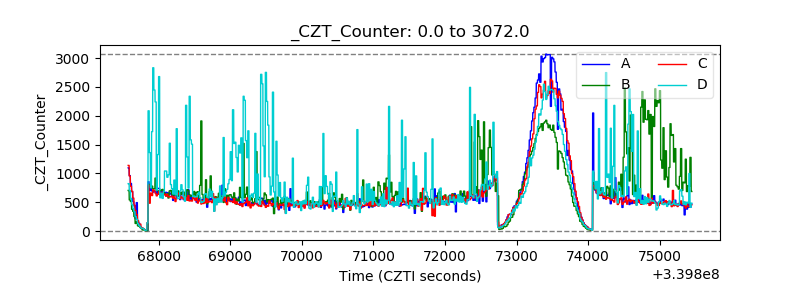 |
| +2.5 Volts monitor |  |
| +5 Volts monitor |  |
| _ROLL_ROT | 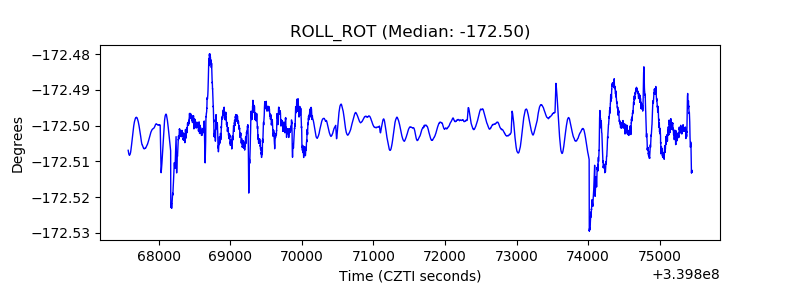 |
| _Roll_DEC | 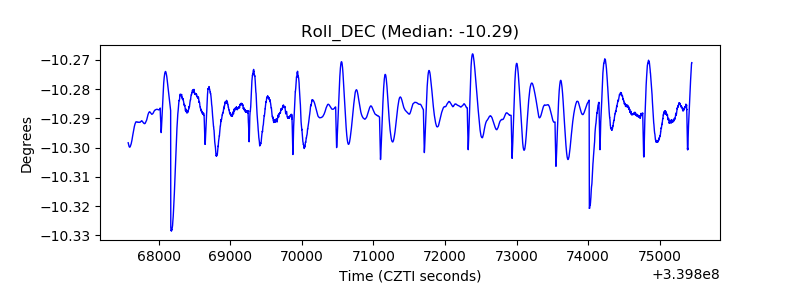 |
| _Roll_RA | 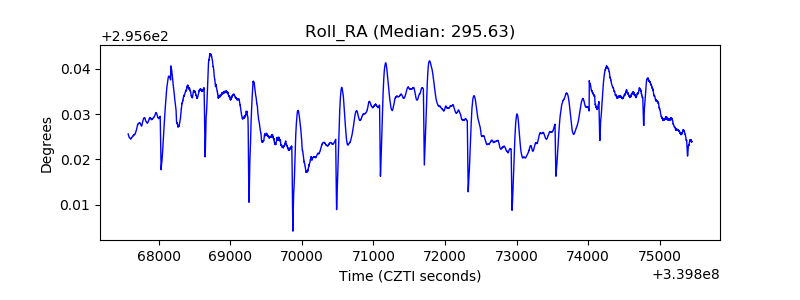 |
| Veto Counter | 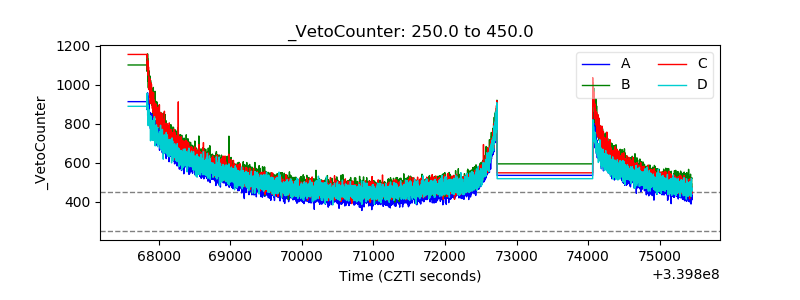 |