| Param | Original file | Final file |
|---|---|---|
| Filename | modeM0/AS1T03_243T01_9000003918_27200cztM0_level2.evt | modeM0/AS1T03_243T01_9000003918_27200cztM0_level2_quad_clean.evt |
| Size (bytes) | 624,009,600 | 88,479,360 |
| Size | 595.1 MB | 84.4 MB |
| Events in quadrant A | 3,301,264 | 622,330 |
| Events in quadrant B | 7,051,921 | 431,555 |
| Events in quadrant C | 3,272,463 | 600,422 |
| Events in quadrant D | 4,832,566 | 571,343 |
| Mode M9 | |||
|---|---|---|---|
| Quadrant | BADHDUFLAG | Total packets | Discarded packets |
| A | 0 | 17 | 0 |
| B | 0 | 18 | 0 |
| C | 0 | 18 | 0 |
| D | 0 | 18 | 0 |
| Mode M0 | |||
|---|---|---|---|
| Quadrant | BADHDUFLAG | Total packets | Discarded packets |
| A | 0 | 13918 | 0 |
| B | 0 | 25323 | 0 |
| C | 0 | 13781 | 0 |
| D | 0 | 18793 | 0 |
| Quadrant | Total seconds | Saturated seconds | Saturation percentage |
|---|---|---|---|
| A | 6493 | 69 | 1.062683% |
| B | 6493 | 1874 | 28.861851% |
| C | 6493 | 85 | 1.309102% |
| D | 6492 | 233 | 3.589033% |
Noise dominated data is calculated using 1-second bins in cleaned event files. If a bin has >2000 counts, and if more than 50% of those come from <1% of pixels, then it is considered to be noise-dominated and hence unusable.
| Quadrant | # 1 sec bins | Bins with >0 counts | Bins with >2000 counts | High rate bins dominated by noise | Noise dominated (total time) | Noise dominated (detector-on time) | Marked lightcurve |
|---|---|---|---|---|---|---|---|
| A | 7668 | 6495 | 2 | 2 | 0.03% | 0.03% | 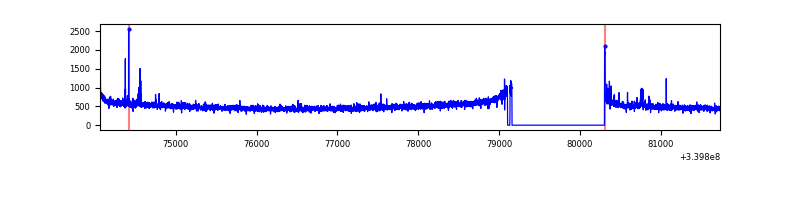 |
| B | 7667 | 6490 | 1090 | 1090 | 14.22% | 16.80% | 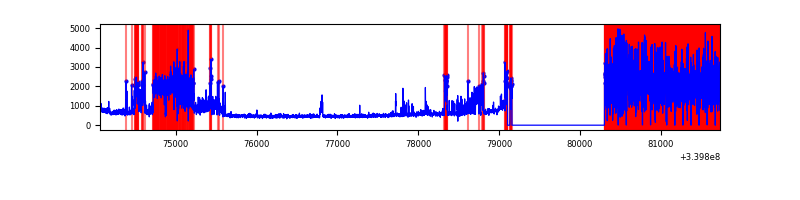 |
| C | 7668 | 6495 | 0 | 0 | 0.00% | 0.00% | 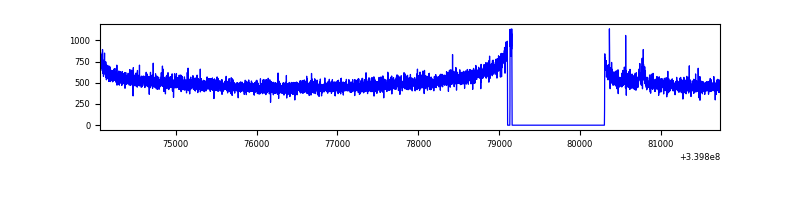 |
| D | 7667 | 6494 | 202 | 202 | 2.63% | 3.11% | 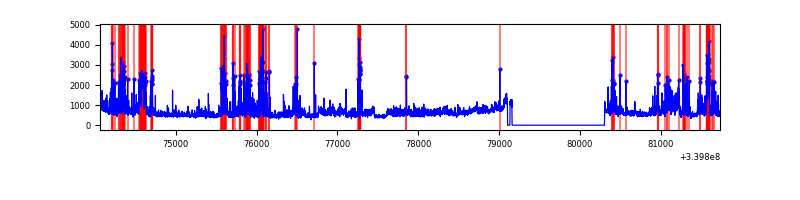 |
Top three noisy pixels from each quadrant. If the there are fewer than three noisy pixels in the level2.evt file, extra rows are filled as -1
| Pixel properties | Quadrant properties | ||||||
|---|---|---|---|---|---|---|---|
| Quadrant | DetID | PixID | Counts | Sigma | Mean | Median | Sigma |
| A | 13 | 248 | 31399 | 180.49 | 842 | 827 | 169.4 |
| A | 8 | 192 | 15627 | 87.37 | 842 | 827 | 169.4 |
| A | 13 | 254 | 10501 | 57.11 | 842 | 827 | 169.4 |
| B | 3 | 64 | 3596981 | 28635.65 | 670 | 655 | 125.6 |
| B | 0 | 189 | 733363 | 5834.17 | 670 | 655 | 125.6 |
| B | 5 | 172 | 20325 | 156.62 | 670 | 655 | 125.6 |
| C | 14 | 238 | 128838 | 673.73 | 802 | 807 | 190.0 |
| C | 14 | 225 | 15387 | 76.72 | 802 | 807 | 190.0 |
| C | 13 | 61 | 5483 | 24.61 | 802 | 807 | 190.0 |
| D | 1 | 52 | 777322 | 3784.44 | 792 | 777 | 205.2 |
| D | 2 | 250 | 359986 | 1750.58 | 792 | 777 | 205.2 |
| D | 7 | 38 | 292217 | 1420.31 | 792 | 777 | 205.2 |
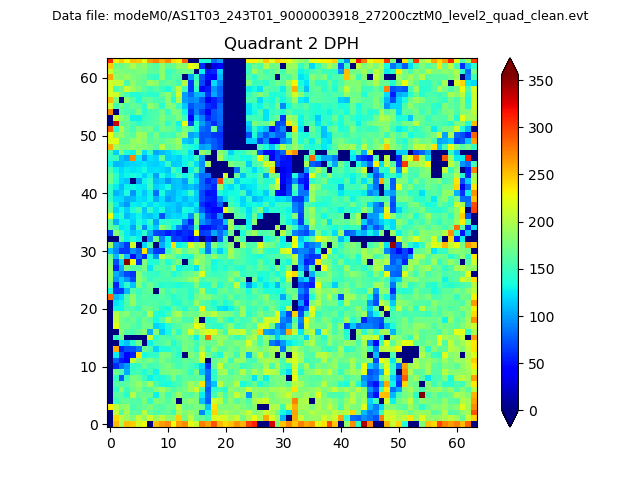
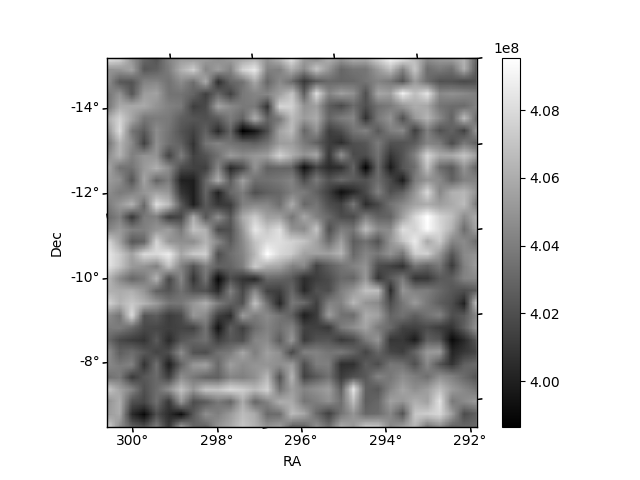
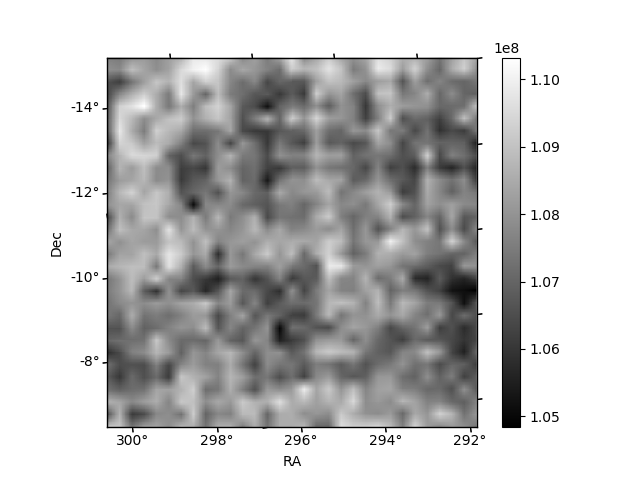
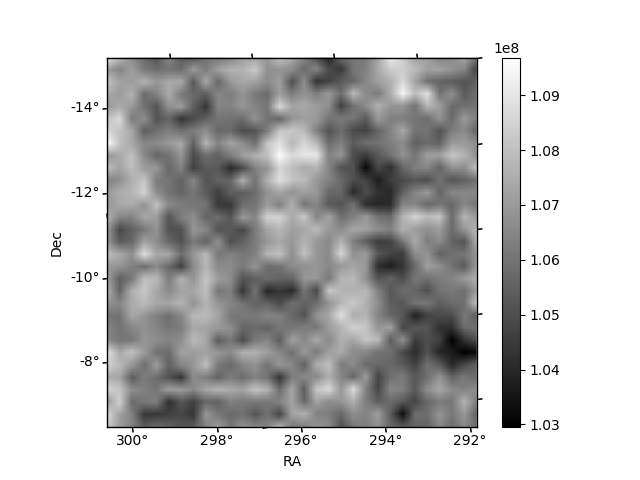
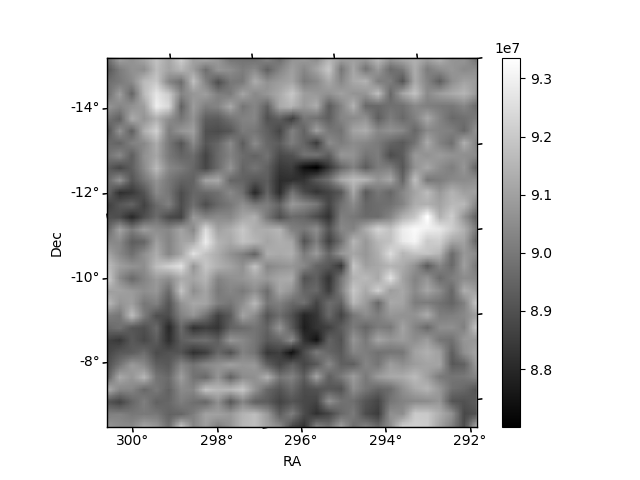
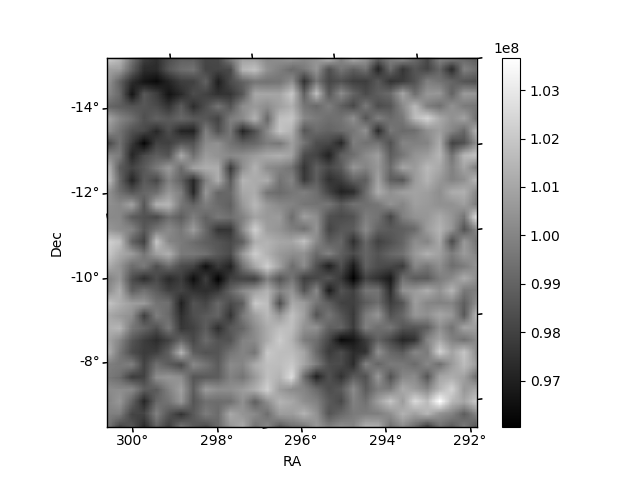
Histogram calculated using DETX and DETY for each event in the final _common_clean file
| Quadrant A | 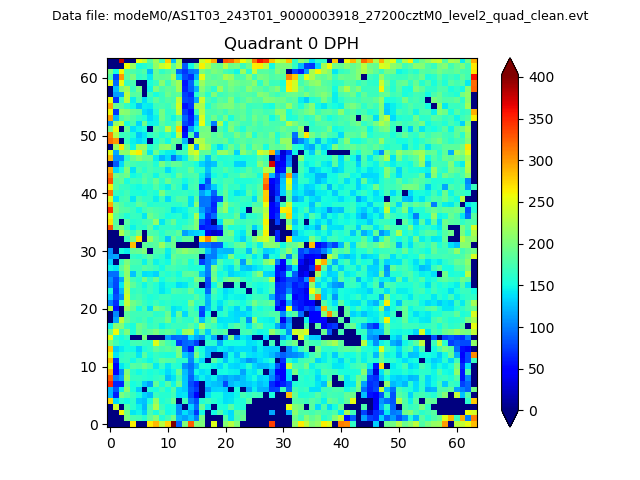 |
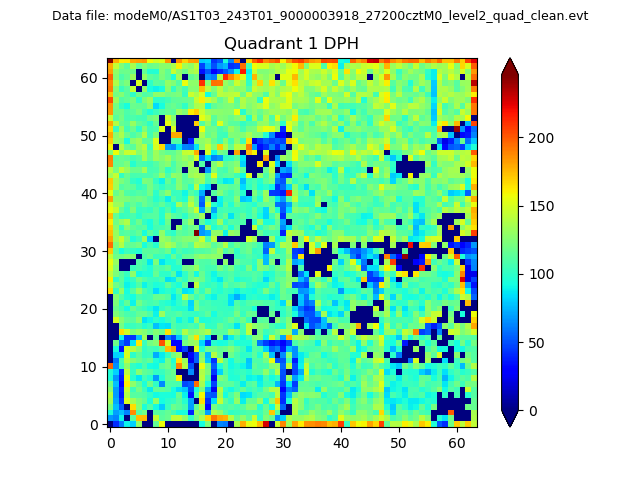 |
Quadrant B |
|---|---|---|---|
| Quadrant D | 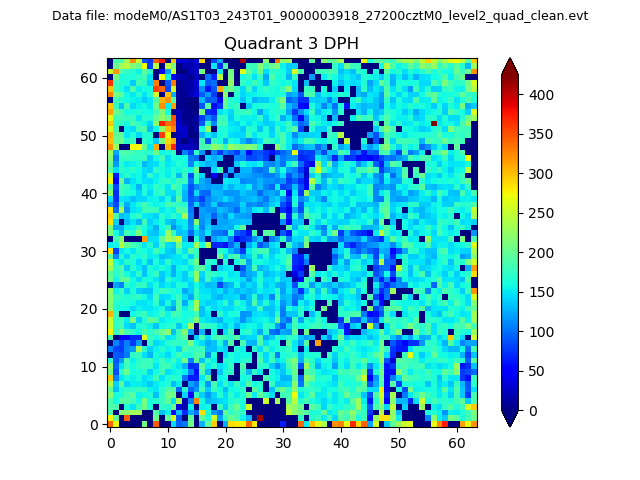 |
 |
Quadrant C |
| Plot type | Count rate plots | Images |
|---|---|---|
| Comparison with Poisson distribution Blue bars denote a histogram of data divided into 1 sec bins. Red curve is a Poisson curve with rate = median count rate of data. |
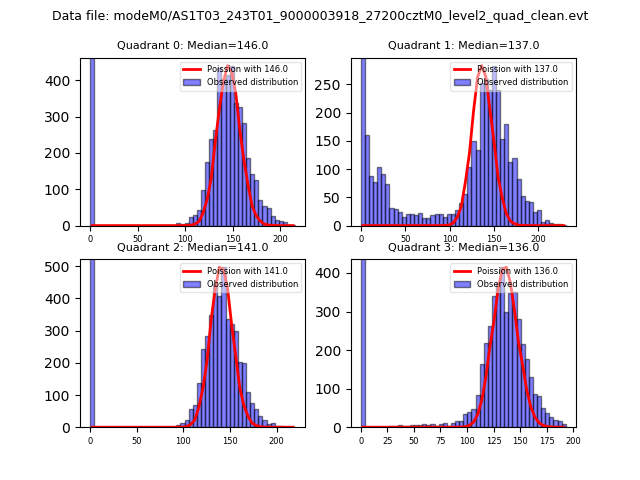 |
 |
| Quadrant-wise count rates Data is divided into 100 sec bins |
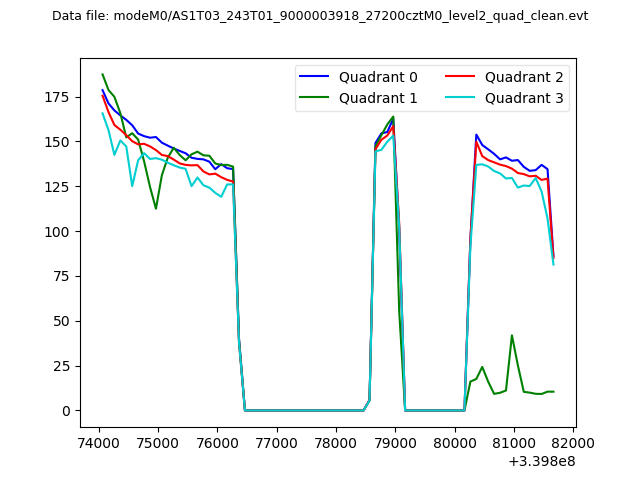 |
|
| Module-wise count rates for Quadrant A Data is divided into 100 sec bins |
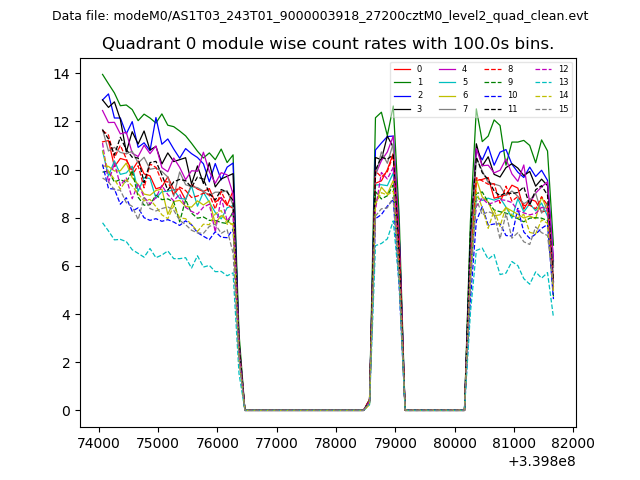 |
 |
| Module-wise count rates for Quadrant B Data is divided into 100 sec bins |
 |
 |
| Module-wise count rates for Quadrant C Data is divided into 100 sec bins |
 |
 |
| Module-wise count rates for Quadrant D Data is divided into 100 sec bins |
 |
 |
| Parameter | Plot |
|---|---|
| CZT HV Monitor |  |
| D_VDD | 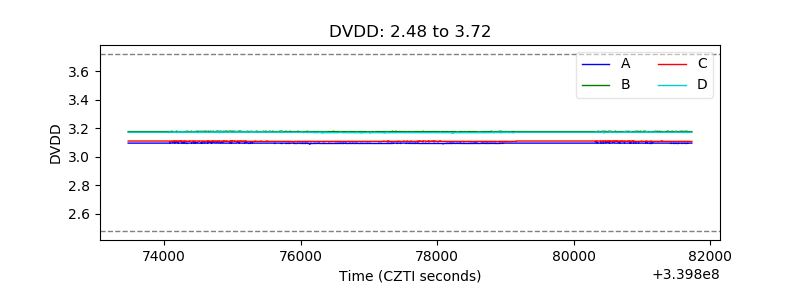 |
| Temperature 1 | 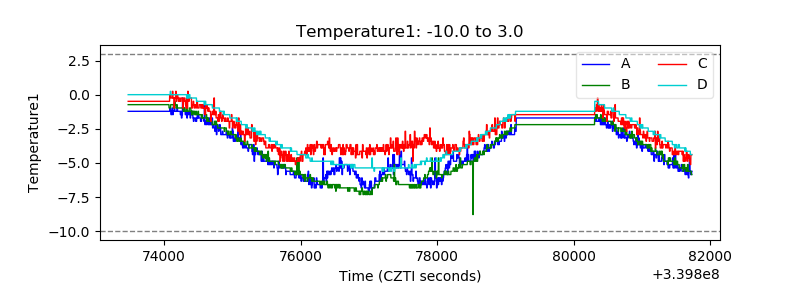 |
| Veto HV Monitor |  |
| Veto LLD | 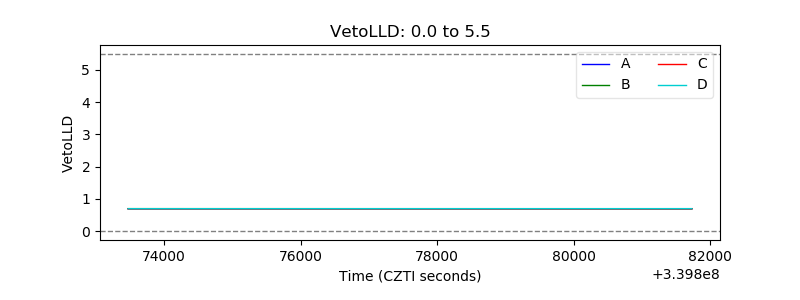 |
| Alpha Counter | 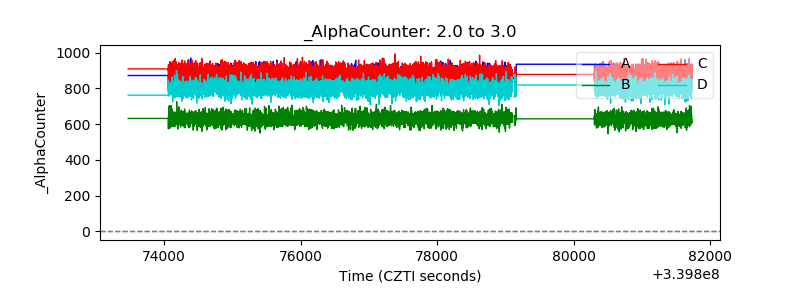 |
| _CPM_Rate | 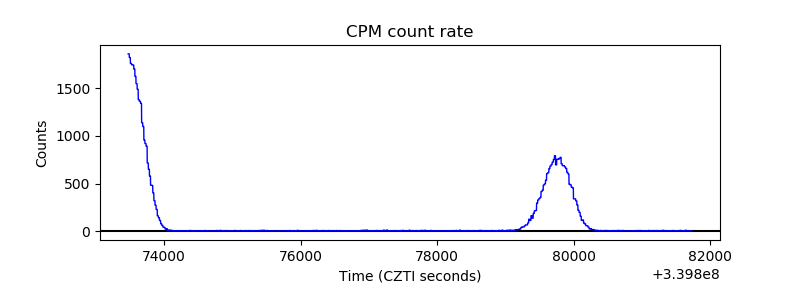 |
| CZT Counter | 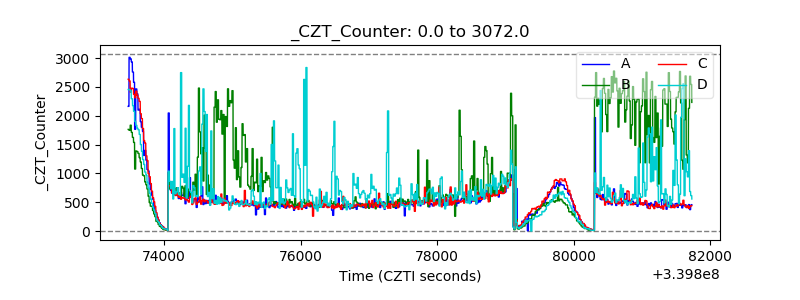 |
| +2.5 Volts monitor | 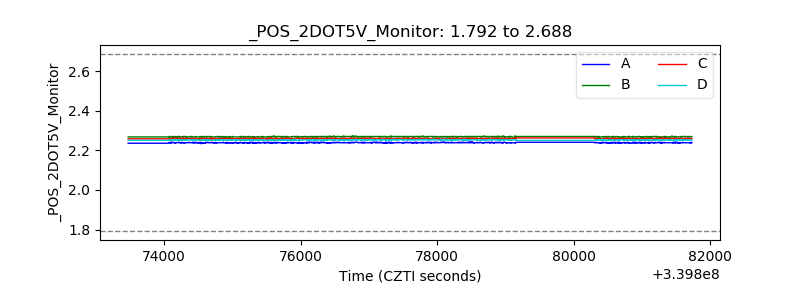 |
| +5 Volts monitor |  |
| _ROLL_ROT |  |
| _Roll_DEC |  |
| _Roll_RA | 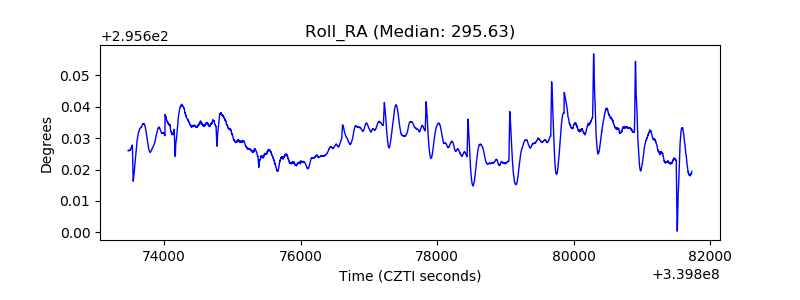 |
| Veto Counter |  |