| Param | Original file | Final file |
|---|---|---|
| Filename | modeM0/AS1T03_243T01_9000003918_27201cztM0_level2.evt | modeM0/AS1T03_243T01_9000003918_27201cztM0_level2_quad_clean.evt |
| Size (bytes) | 752,616,000 | 88,283,520 |
| Size | 717.8 MB | 84.2 MB |
| Events in quadrant A | 3,308,965 | 626,945 |
| Events in quadrant B | 9,954,345 | 380,107 |
| Events in quadrant C | 3,305,431 | 606,156 |
| Events in quadrant D | 5,761,699 | 582,507 |
| Mode M9 | |||
|---|---|---|---|
| Quadrant | BADHDUFLAG | Total packets | Discarded packets |
| A | 0 | 8 | 0 |
| B | 0 | 8 | 0 |
| C | 0 | 8 | 0 |
| D | 0 | 8 | 0 |
| Mode M0 | |||
|---|---|---|---|
| Quadrant | BADHDUFLAG | Total packets | Discarded packets |
| A | 0 | 14221 | 0 |
| B | 0 | 34346 | 0 |
| C | 0 | 14139 | 0 |
| D | 0 | 21765 | 0 |
| Quadrant | Total seconds | Saturated seconds | Saturation percentage |
|---|---|---|---|
| A | 6836 | 49 | 0.716793% |
| B | 6836 | 2866 | 41.925102% |
| C | 6836 | 70 | 1.023991% |
| D | 6837 | 372 | 5.440983% |
Noise dominated data is calculated using 1-second bins in cleaned event files. If a bin has >2000 counts, and if more than 50% of those come from <1% of pixels, then it is considered to be noise-dominated and hence unusable.
| Quadrant | # 1 sec bins | Bins with >0 counts | Bins with >2000 counts | High rate bins dominated by noise | Noise dominated (total time) | Noise dominated (detector-on time) | Marked lightcurve |
|---|---|---|---|---|---|---|---|
| A | 7605 | 6836 | 0 | 0 | 0.00% | 0.00% | 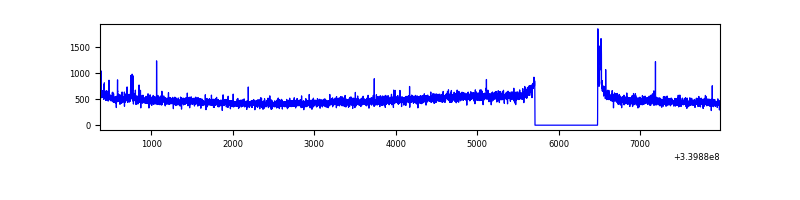 |
| B | 7605 | 6832 | 1984 | 1984 | 26.09% | 29.04% | 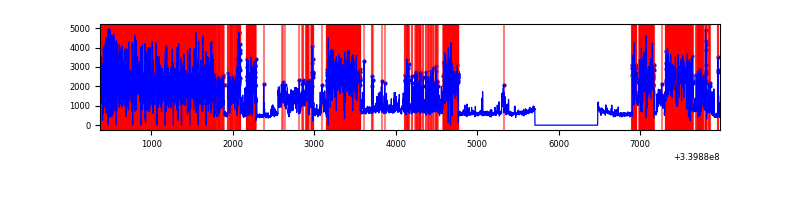 |
| C | 7605 | 6836 | 1 | 1 | 0.01% | 0.01% | 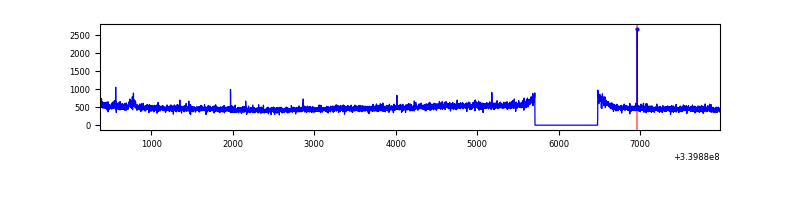 |
| D | 7607 | 6838 | 360 | 360 | 4.73% | 5.26% | 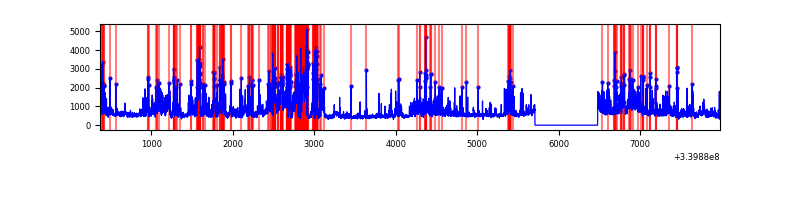 |
Top three noisy pixels from each quadrant. If the there are fewer than three noisy pixels in the level2.evt file, extra rows are filled as -1
| Pixel properties | Quadrant properties | ||||||
|---|---|---|---|---|---|---|---|
| Quadrant | DetID | PixID | Counts | Sigma | Mean | Median | Sigma |
| A | 13 | 248 | 30656 | 174.99 | 845 | 829 | 170.5 |
| A | 13 | 254 | 10679 | 57.79 | 845 | 829 | 170.5 |
| A | 0 | 13 | 9227 | 49.27 | 845 | 829 | 170.5 |
| B | 3 | 64 | 7314185 | 64000.94 | 595 | 582 | 114.3 |
| B | 0 | 189 | 194610 | 1697.93 | 595 | 582 | 114.3 |
| B | 0 | 190 | 52481 | 454.17 | 595 | 582 | 114.3 |
| C | 14 | 238 | 129966 | 676.72 | 809 | 814 | 190.8 |
| C | 14 | 225 | 14907 | 73.84 | 809 | 814 | 190.8 |
| C | 15 | 208 | 9851 | 47.35 | 809 | 814 | 190.8 |
| D | 1 | 52 | 1423241 | 7080.42 | 795 | 775 | 200.9 |
| D | 5 | 222 | 395418 | 1964.36 | 795 | 775 | 200.9 |
| D | 7 | 38 | 288426 | 1431.8 | 795 | 775 | 200.9 |
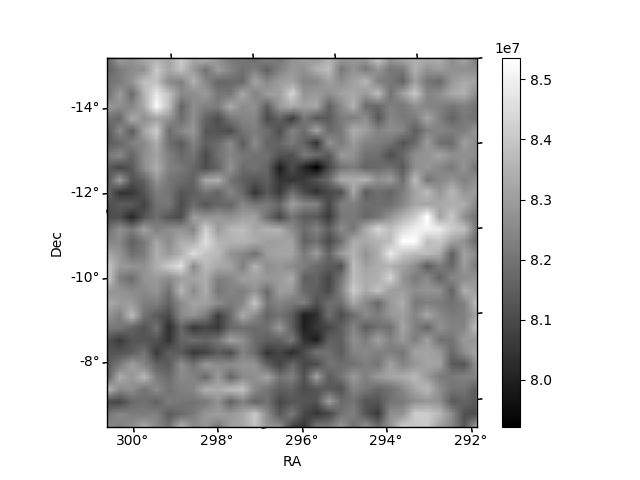
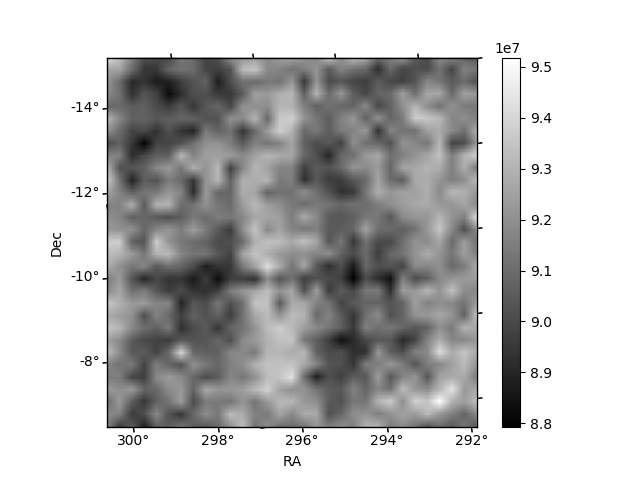
Histogram calculated using DETX and DETY for each event in the final _common_clean file
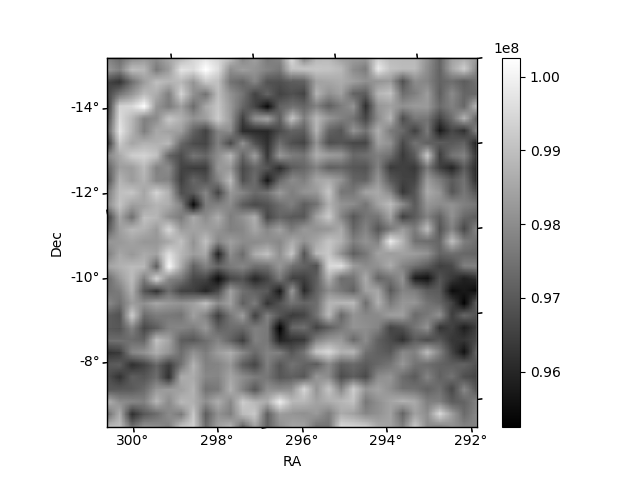
| Quadrant A | 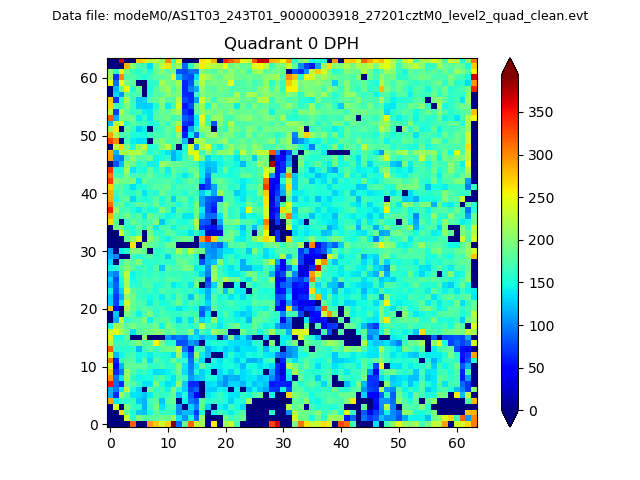 |
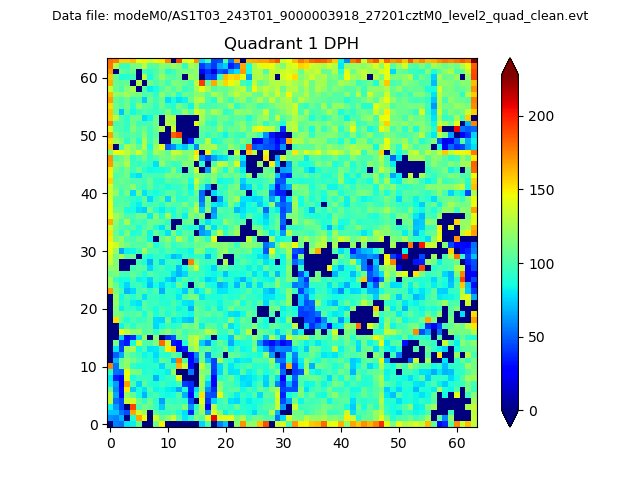 |
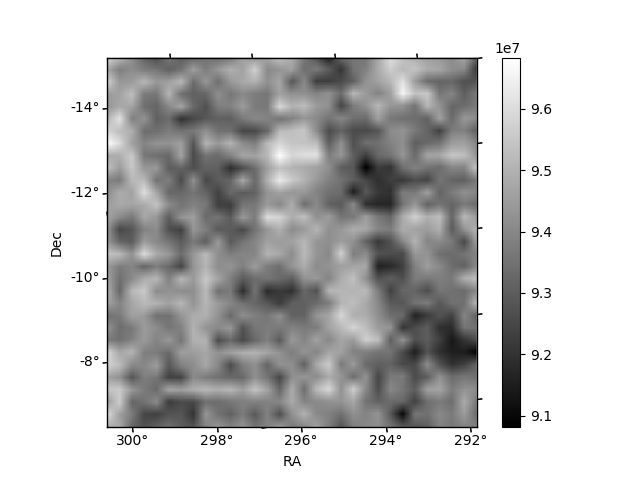
Quadrant B |
|---|---|---|---|
| Quadrant D | 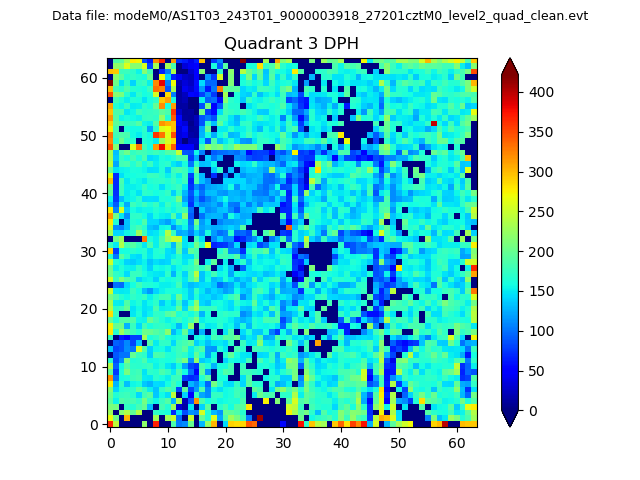 |
 |
Quadrant C |
| Plot type | Count rate plots | Images |
|---|---|---|
| Comparison with Poisson distribution Blue bars denote a histogram of data divided into 1 sec bins. Red curve is a Poisson curve with rate = median count rate of data. |
 |
 |
| Quadrant-wise count rates Data is divided into 100 sec bins |
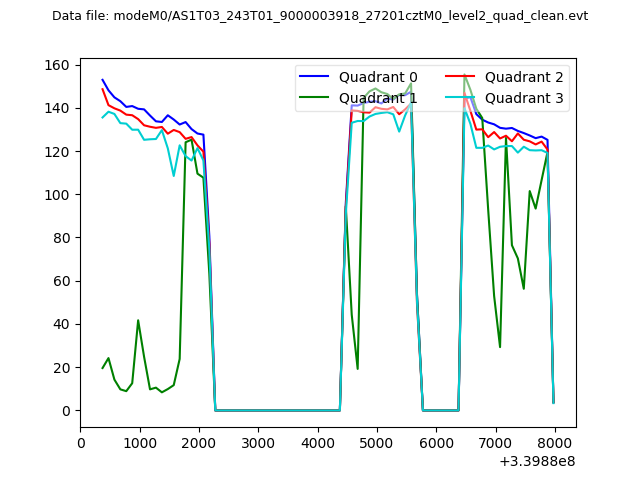 |
|
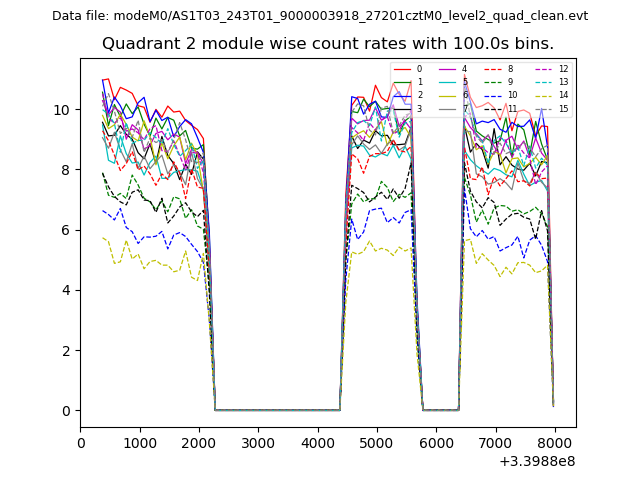
| Module-wise count rates for Quadrant A Data is divided into 100 sec bins |
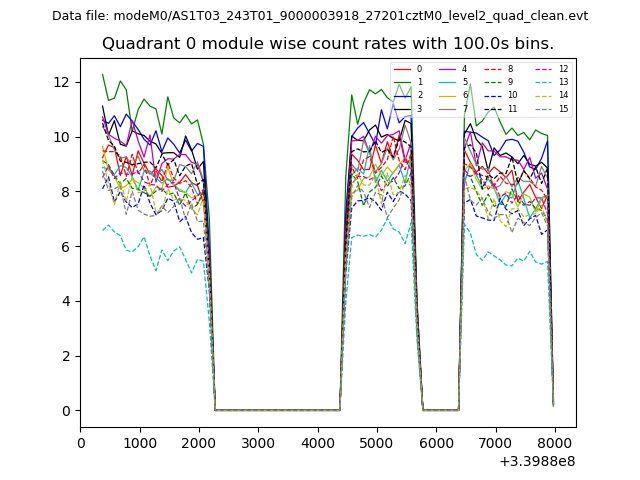 |
 |
| Module-wise count rates for Quadrant B Data is divided into 100 sec bins |
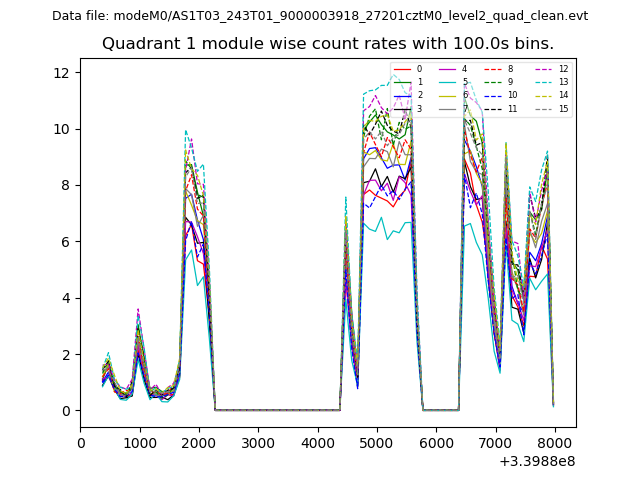 |
 |
| Module-wise count rates for Quadrant C Data is divided into 100 sec bins |
 |
 |
| Module-wise count rates for Quadrant D Data is divided into 100 sec bins |
 |
 |
| Parameter | Plot |
|---|---|
| CZT HV Monitor | 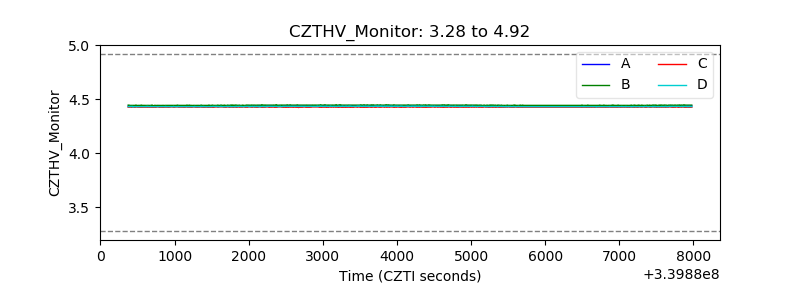 |
| D_VDD | 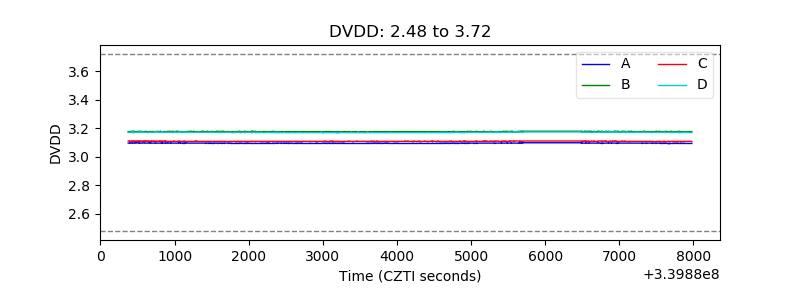 |
| Temperature 1 | 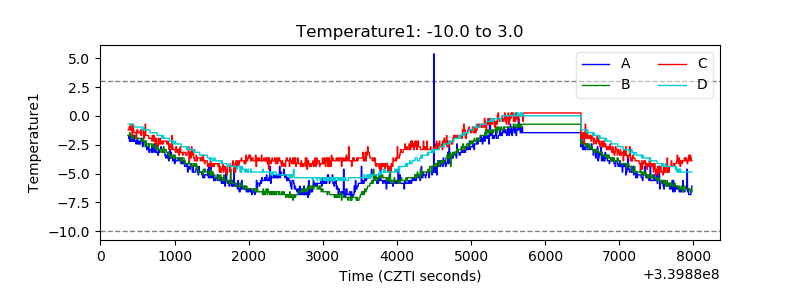 |
| Veto HV Monitor | 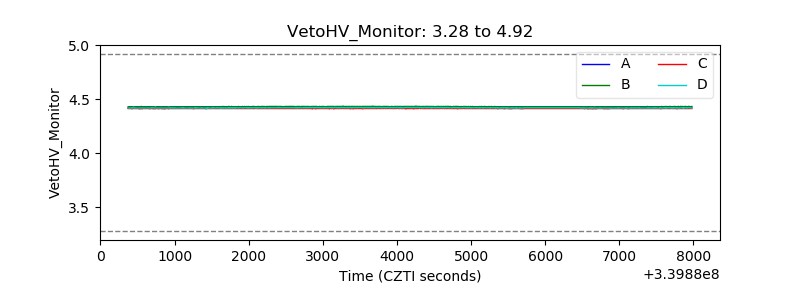 |
| Veto LLD | 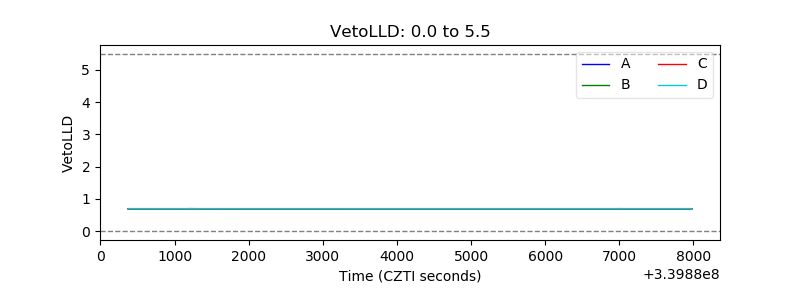 |
| Alpha Counter | 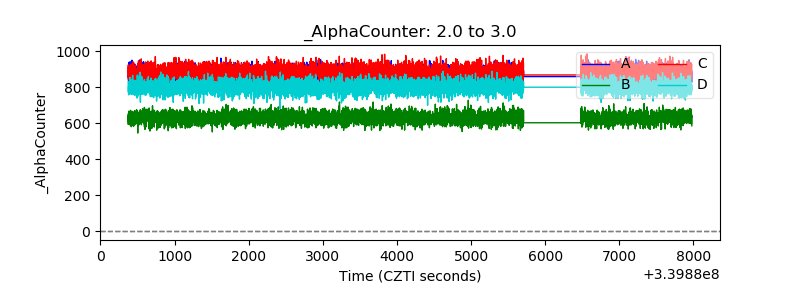 |
| _CPM_Rate | 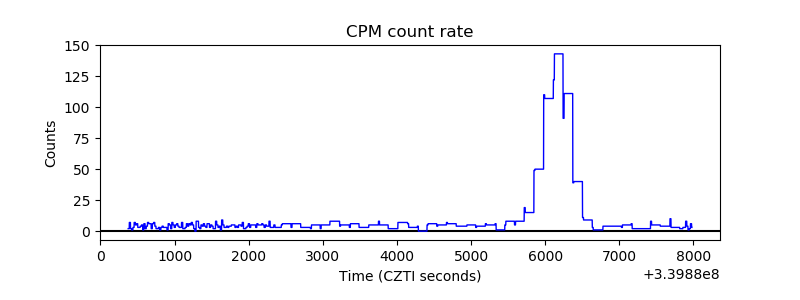 |
| CZT Counter |  |
| +2.5 Volts monitor |  |
| +5 Volts monitor |  |
| _ROLL_ROT |  |
| _Roll_DEC | 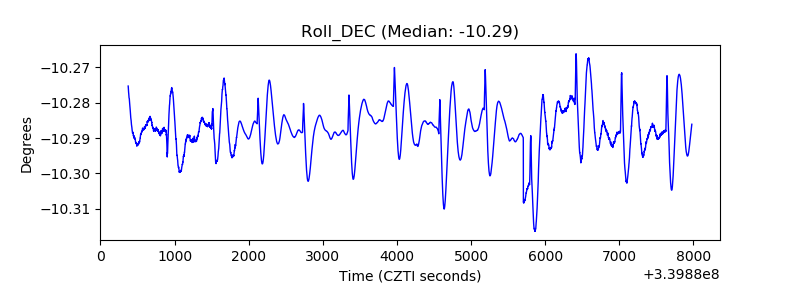 |
| _Roll_RA |  |
| Veto Counter | 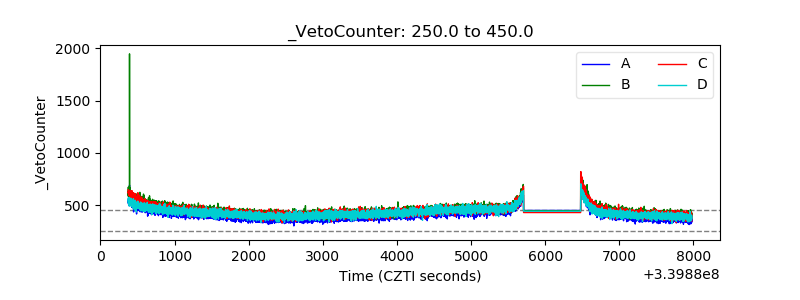 |