| Param | Original file | Final file |
|---|---|---|
| Filename | modeM0/AS1T03_243T01_9000003918_27203cztM0_level2.evt | modeM0/AS1T03_243T01_9000003918_27203cztM0_level2_quad_clean.evt |
| Size (bytes) | 845,326,080 | 102,306,240 |
| Size | 806.2 MB | 97.6 MB |
| Events in quadrant A | 3,996,523 | 678,351 |
| Events in quadrant B | 8,518,822 | 613,683 |
| Events in quadrant C | 3,964,857 | 655,988 |
| Events in quadrant D | 8,568,768 | 581,644 |
| Mode M9 | |||
|---|---|---|---|
| Quadrant | BADHDUFLAG | Total packets | Discarded packets |
| A | 0 | 5 | 0 |
| B | 0 | 5 | 0 |
| C | 0 | 5 | 0 |
| D | 0 | 5 | 0 |
| Mode M0 | |||
|---|---|---|---|
| Quadrant | BADHDUFLAG | Total packets | Discarded packets |
| A | 0 | 17199 | 0 |
| B | 0 | 30649 | 0 |
| C | 0 | 17040 | 0 |
| D | 0 | 31045 | 0 |
| Quadrant | Total seconds | Saturated seconds | Saturation percentage |
|---|---|---|---|
| A | 8172 | 126 | 1.541850% |
| B | 8173 | 1836 | 22.464211% |
| C | 8173 | 194 | 2.373669% |
| D | 8173 | 1165 | 14.254252% |
Noise dominated data is calculated using 1-second bins in cleaned event files. If a bin has >2000 counts, and if more than 50% of those come from <1% of pixels, then it is considered to be noise-dominated and hence unusable.
| Quadrant | # 1 sec bins | Bins with >0 counts | Bins with >2000 counts | High rate bins dominated by noise | Noise dominated (total time) | Noise dominated (detector-on time) | Marked lightcurve |
|---|---|---|---|---|---|---|---|
| A | 8627 | 8174 | 2 | 2 | 0.02% | 0.02% | 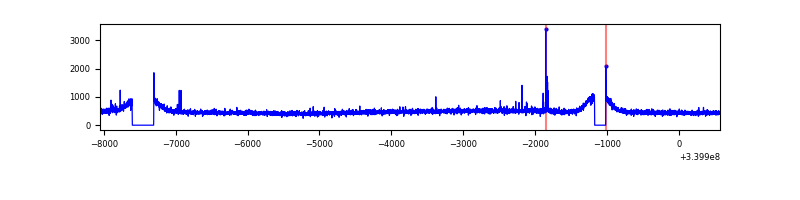 |
| B | 8628 | 8173 | 1078 | 1078 | 12.49% | 13.19% | 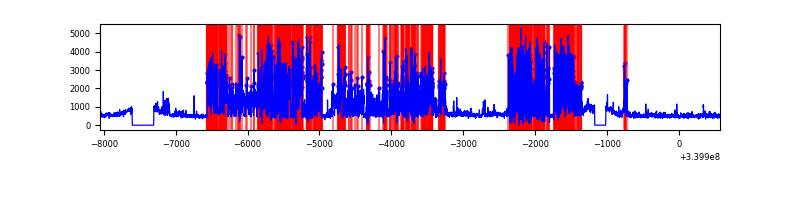 |
| C | 8628 | 8175 | 0 | 0 | 0.00% | 0.00% | 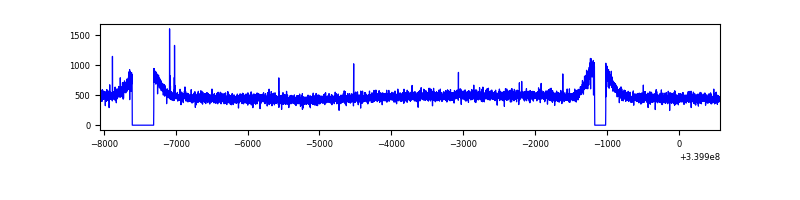 |
| D | 8628 | 8173 | 886 | 886 | 10.27% | 10.84% | 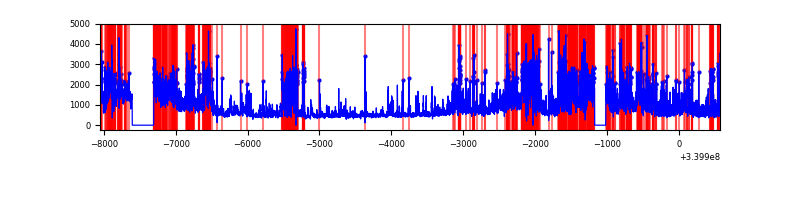 |
Top three noisy pixels from each quadrant. If the there are fewer than three noisy pixels in the level2.evt file, extra rows are filled as -1
| Pixel properties | Quadrant properties | ||||||
|---|---|---|---|---|---|---|---|
| Quadrant | DetID | PixID | Counts | Sigma | Mean | Median | Sigma |
| A | 13 | 248 | 35284 | 165.67 | 1022 | 998 | 206.9 |
| A | 8 | 192 | 13607 | 60.93 | 1022 | 998 | 206.9 |
| A | 13 | 254 | 13113 | 58.54 | 1022 | 998 | 206.9 |
| B | 3 | 64 | 4717967 | 26186.32 | 927 | 903 | 180.1 |
| B | 15 | 33 | 60518 | 330.95 | 927 | 903 | 180.1 |
| B | 12 | 111 | 22181 | 118.12 | 927 | 903 | 180.1 |
| C | 14 | 238 | 152714 | 657.69 | 974 | 978 | 230.7 |
| C | 15 | 208 | 9857 | 38.49 | 974 | 978 | 230.7 |
| C | 13 | 61 | 6565 | 24.22 | 974 | 978 | 230.7 |
| D | 1 | 52 | 3069479 | 12583.81 | 926 | 903 | 243.9 |
| D | 13 | 168 | 739913 | 3030.58 | 926 | 903 | 243.9 |
| D | 5 | 222 | 288130 | 1177.88 | 926 | 903 | 243.9 |
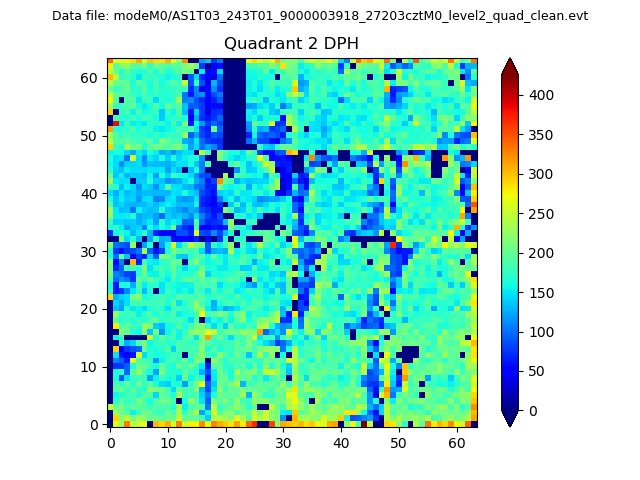
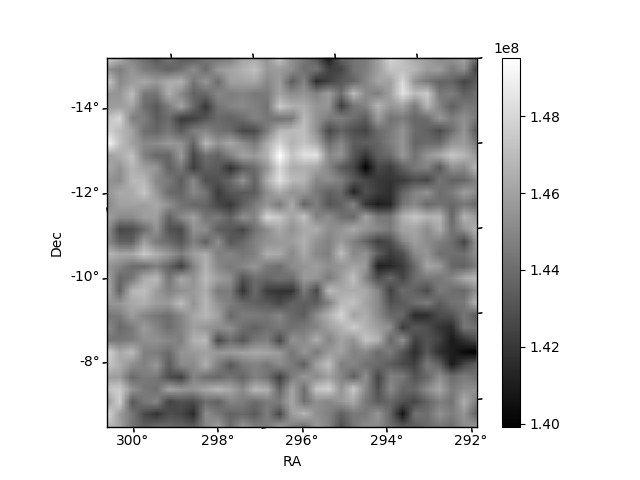
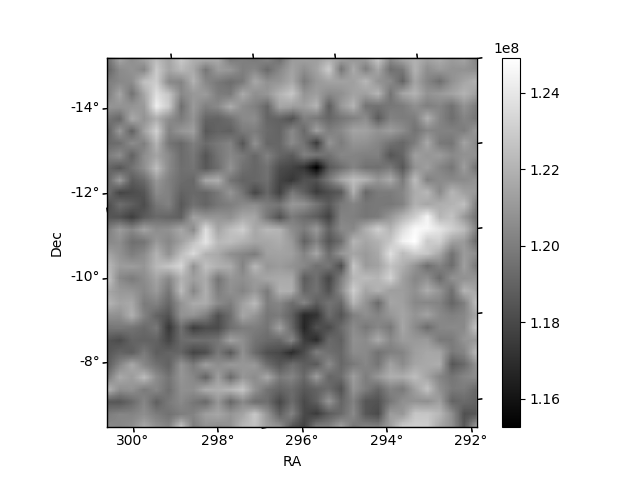
Histogram calculated using DETX and DETY for each event in the final _common_clean file
| Quadrant A | 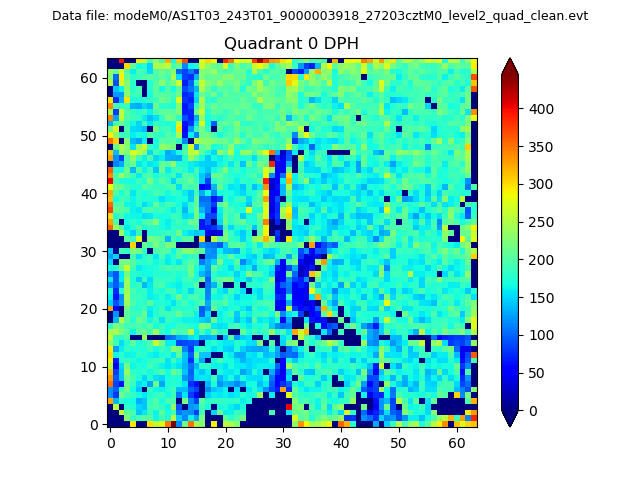 |
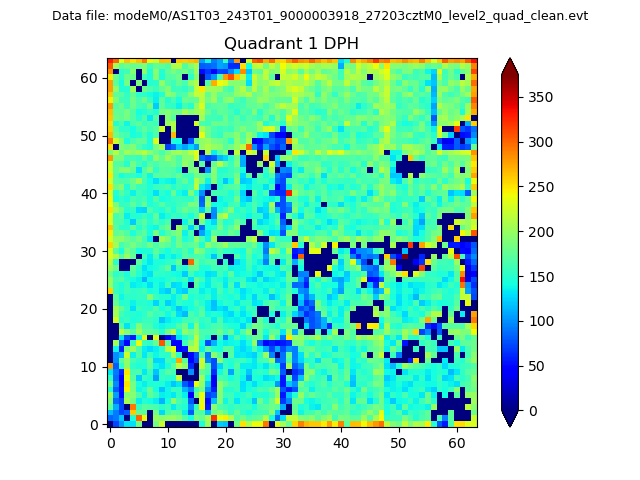 |
Quadrant B |
|---|---|---|---|
| Quadrant D | 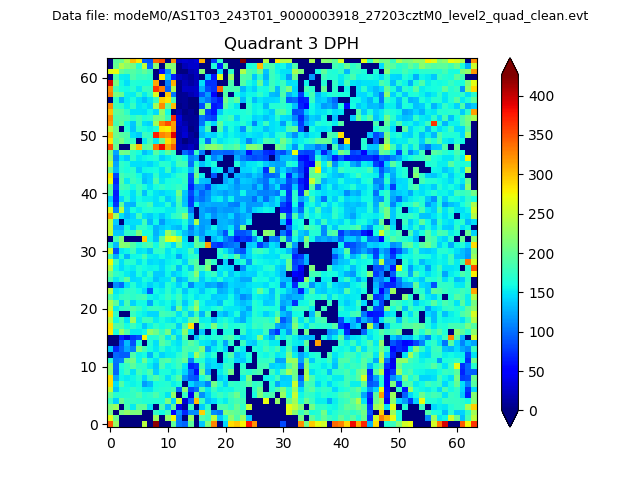 |
 |
Quadrant C |
| Plot type | Count rate plots | Images |
|---|---|---|
| Comparison with Poisson distribution Blue bars denote a histogram of data divided into 1 sec bins. Red curve is a Poisson curve with rate = median count rate of data. |
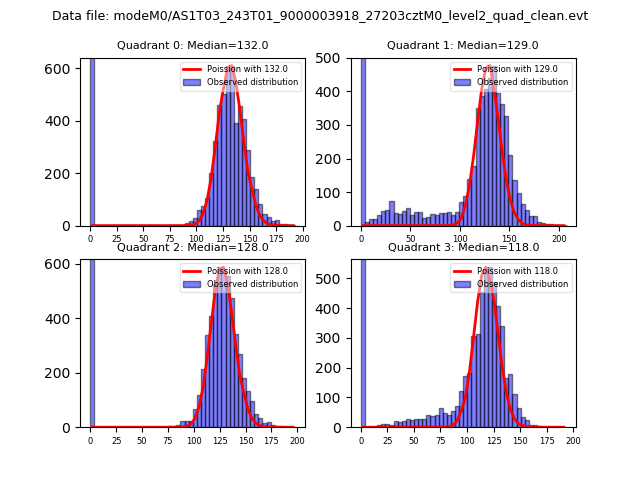 |
 |
| Quadrant-wise count rates Data is divided into 100 sec bins |
 |
|
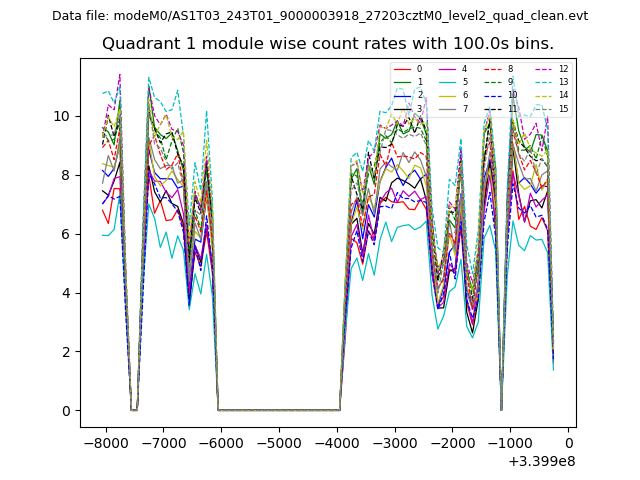
| Module-wise count rates for Quadrant A Data is divided into 100 sec bins |
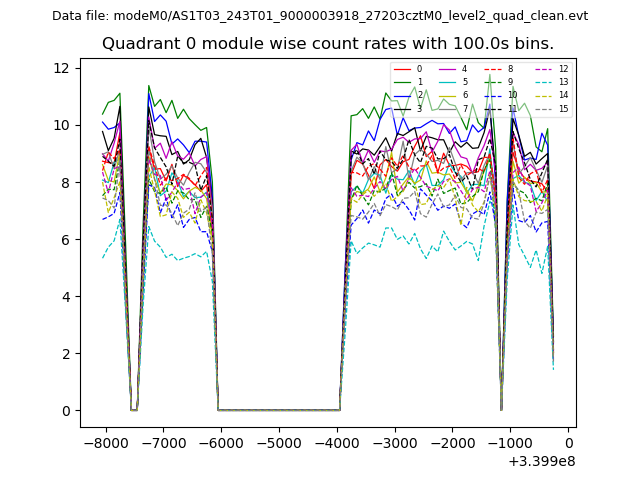 |
 |
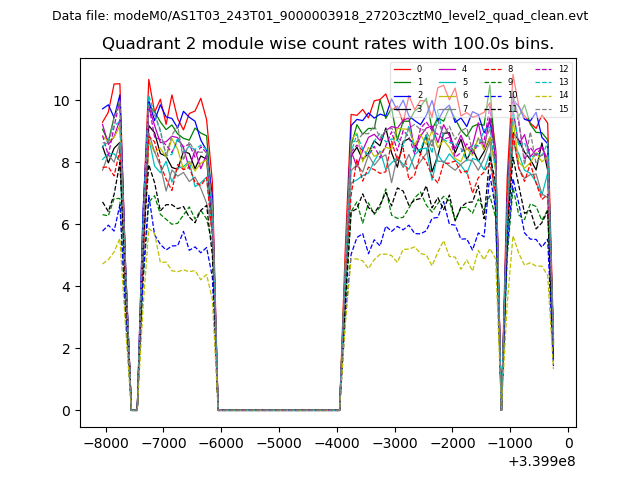
| Module-wise count rates for Quadrant B Data is divided into 100 sec bins |
 |
 |
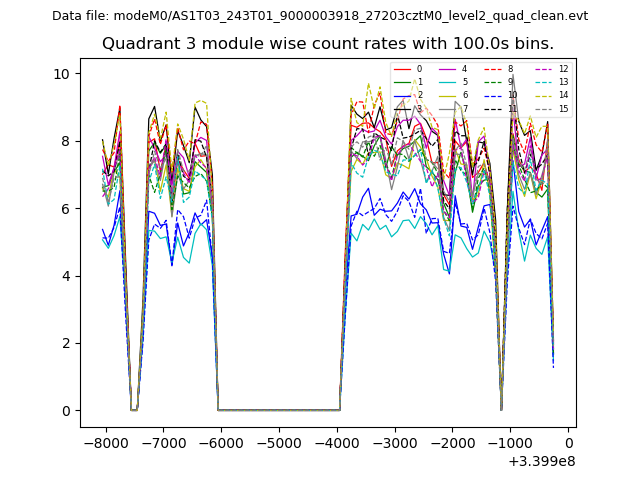
| Module-wise count rates for Quadrant C Data is divided into 100 sec bins |
 |
 |
| Module-wise count rates for Quadrant D Data is divided into 100 sec bins |
 |
 |
| Parameter | Plot |
|---|---|
| CZT HV Monitor | 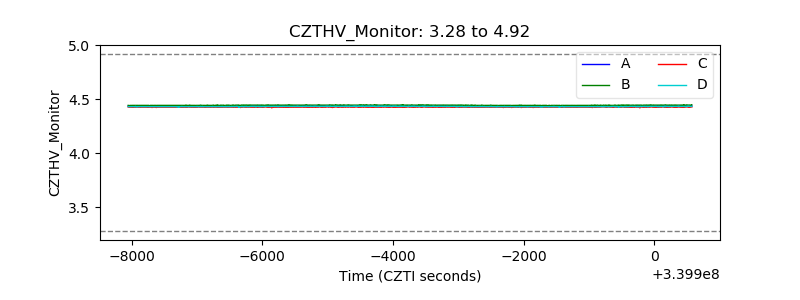 |
| D_VDD | 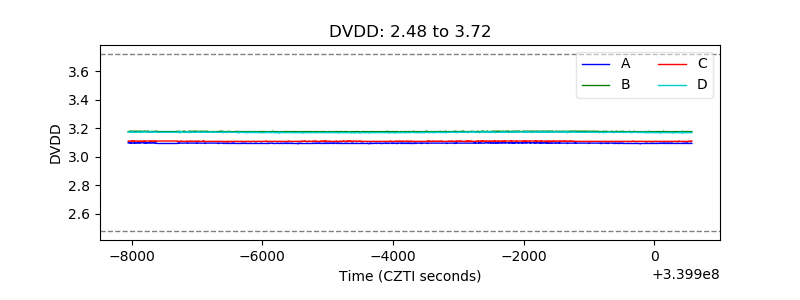 |
| Temperature 1 | 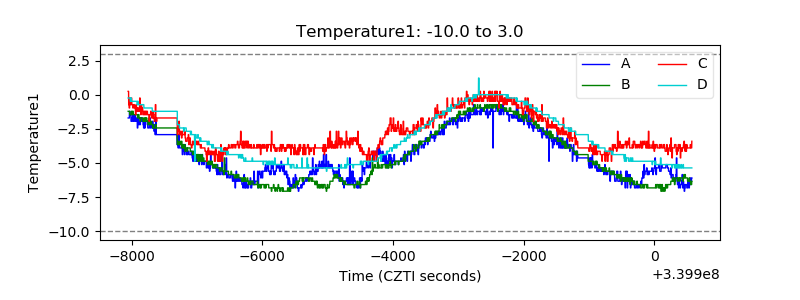 |
| Veto HV Monitor | 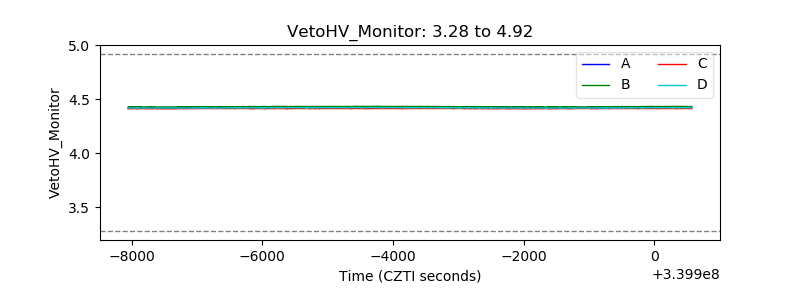 |
| Veto LLD | 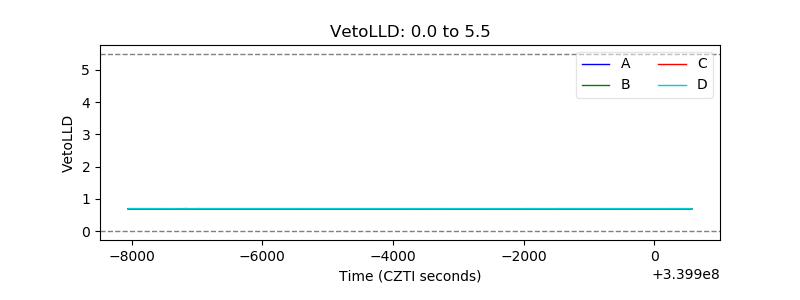 |
| Alpha Counter |  |
| _CPM_Rate |  |
| CZT Counter | 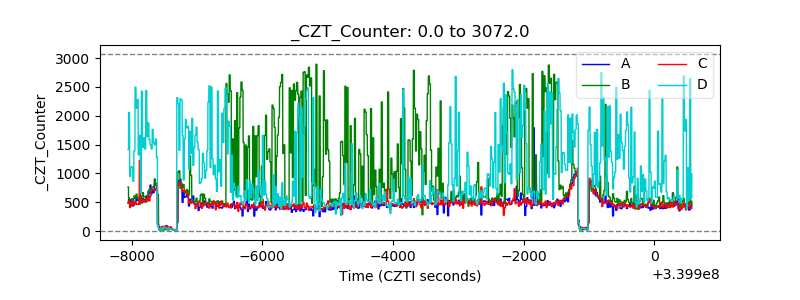 |
| +2.5 Volts monitor |  |
| +5 Volts monitor |  |
| _ROLL_ROT | 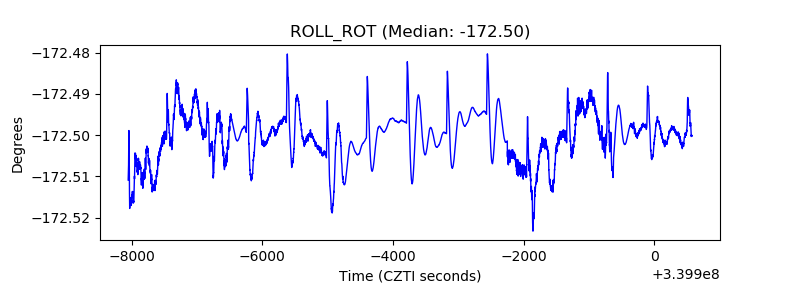 |
| _Roll_DEC | 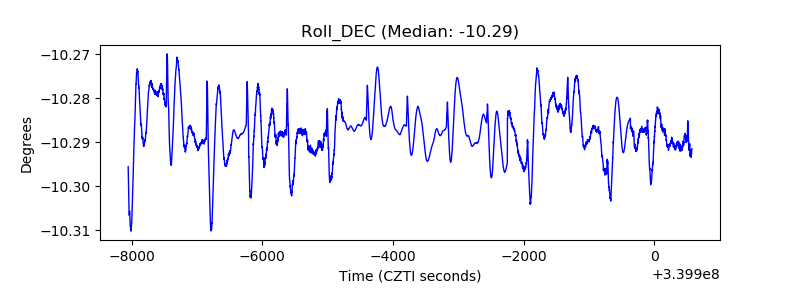 |
| _Roll_RA | 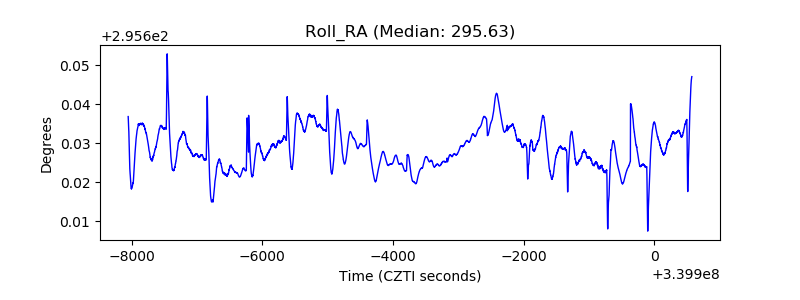 |
| Veto Counter | 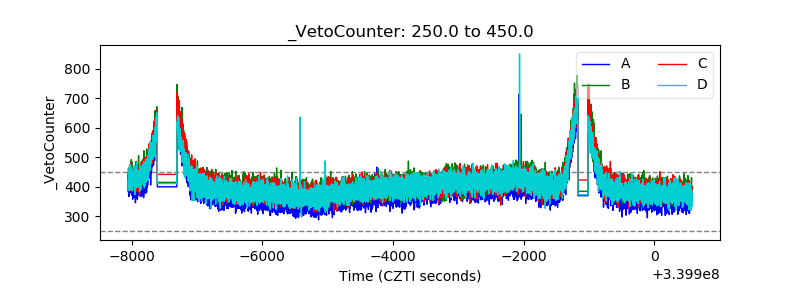 |