| Param | Original file | Final file |
|---|---|---|
| Filename | modeM0/AS1T03_243T01_9000003918_27204cztM0_level2.evt | modeM0/AS1T03_243T01_9000003918_27204cztM0_level2_quad_clean.evt |
| Size (bytes) | 704,191,680 | 91,065,600 |
| Size | 671.6 MB | 86.8 MB |
| Events in quadrant A | 3,811,508 | 577,650 |
| Events in quadrant B | 5,555,473 | 574,055 |
| Events in quadrant C | 3,841,077 | 560,398 |
| Events in quadrant D | 7,584,556 | 496,460 |
| Mode M9 | |||
|---|---|---|---|
| Quadrant | BADHDUFLAG | Total packets | Discarded packets |
| A | 0 | 5 | 0 |
| B | 0 | 5 | 0 |
| C | 0 | 5 | 0 |
| D | 0 | 5 | 0 |
| Mode M0 | |||
|---|---|---|---|
| Quadrant | BADHDUFLAG | Total packets | Discarded packets |
| A | 0 | 16473 | 0 |
| B | 0 | 22040 | 0 |
| C | 0 | 16479 | 0 |
| D | 0 | 27865 | 0 |
| Quadrant | Total seconds | Saturated seconds | Saturation percentage |
|---|---|---|---|
| A | 7890 | 121 | 1.533587% |
| B | 7890 | 349 | 4.423321% |
| C | 7890 | 180 | 2.281369% |
| D | 7890 | 1113 | 14.106464% |
Noise dominated data is calculated using 1-second bins in cleaned event files. If a bin has >2000 counts, and if more than 50% of those come from <1% of pixels, then it is considered to be noise-dominated and hence unusable.
| Quadrant | # 1 sec bins | Bins with >0 counts | Bins with >2000 counts | High rate bins dominated by noise | Noise dominated (total time) | Noise dominated (detector-on time) | Marked lightcurve |
|---|---|---|---|---|---|---|---|
| A | 8410 | 7892 | 2 | 2 | 0.02% | 0.03% | 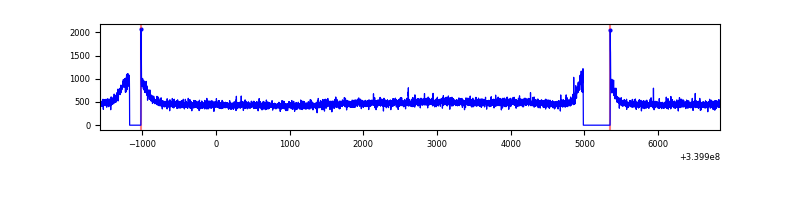 |
| B | 8410 | 7892 | 76 | 76 | 0.90% | 0.96% | 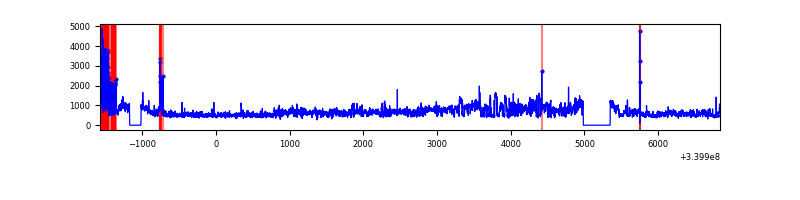 |
| C | 8410 | 7892 | 1 | 1 | 0.01% | 0.01% | 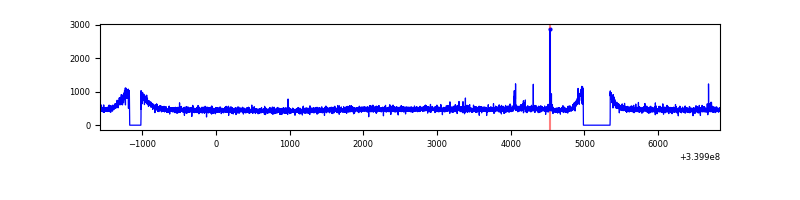 |
| D | 8410 | 7892 | 856 | 856 | 10.18% | 10.85% | 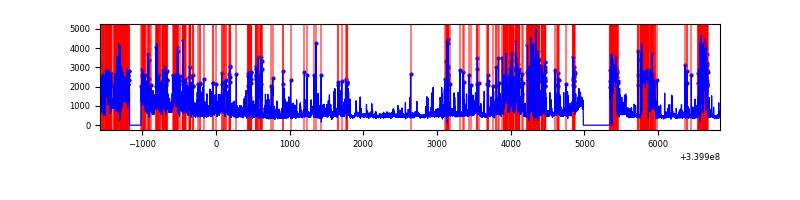 |
Top three noisy pixels from each quadrant. If the there are fewer than three noisy pixels in the level2.evt file, extra rows are filled as -1
| Pixel properties | Quadrant properties | ||||||
|---|---|---|---|---|---|---|---|
| Quadrant | DetID | PixID | Counts | Sigma | Mean | Median | Sigma |
| A | 13 | 254 | 12707 | 58.95 | 981 | 961 | 199.2 |
| A | 8 | 192 | 12388 | 57.35 | 981 | 961 | 199.2 |
| A | 3 | 137 | 9341 | 42.06 | 981 | 961 | 199.2 |
| B | 3 | 64 | 1689515 | 8934.69 | 970 | 943 | 189.0 |
| B | 12 | 111 | 23640 | 120.1 | 970 | 943 | 189.0 |
| B | 11 | 111 | 20672 | 104.39 | 970 | 943 | 189.0 |
| C | 14 | 238 | 146355 | 649.74 | 939 | 946 | 223.8 |
| C | 2 | 16 | 13952 | 58.12 | 939 | 946 | 223.8 |
| C | 15 | 208 | 13049 | 54.08 | 939 | 946 | 223.8 |
| D | 1 | 52 | 2874094 | 12855.15 | 870 | 849 | 223.5 |
| D | 2 | 250 | 407141 | 1817.79 | 870 | 849 | 223.5 |
| D | 7 | 38 | 362063 | 1616.1 | 870 | 849 | 223.5 |
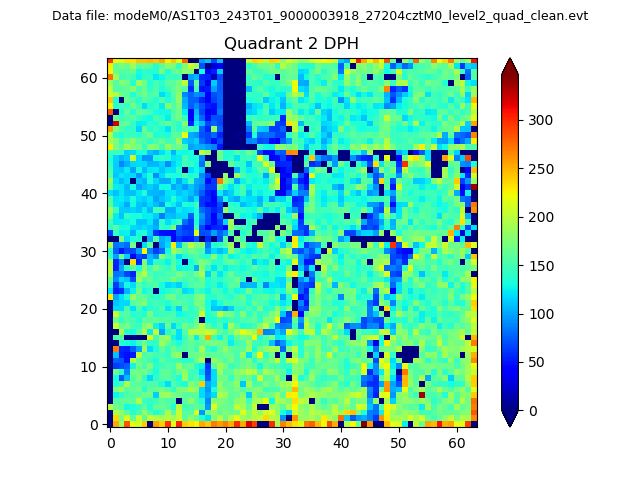
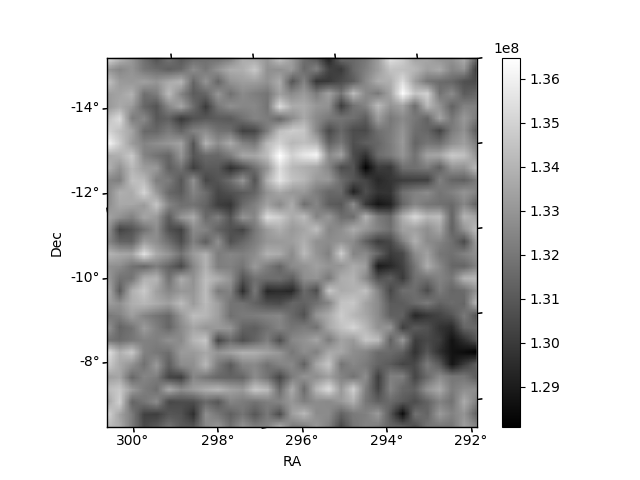
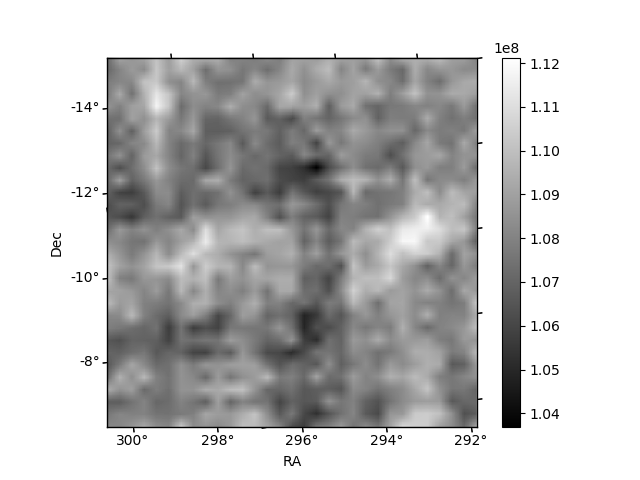
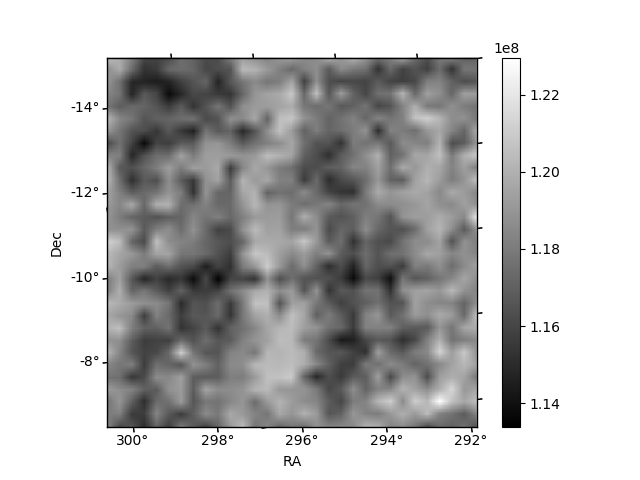
Histogram calculated using DETX and DETY for each event in the final _common_clean file
| Quadrant A | 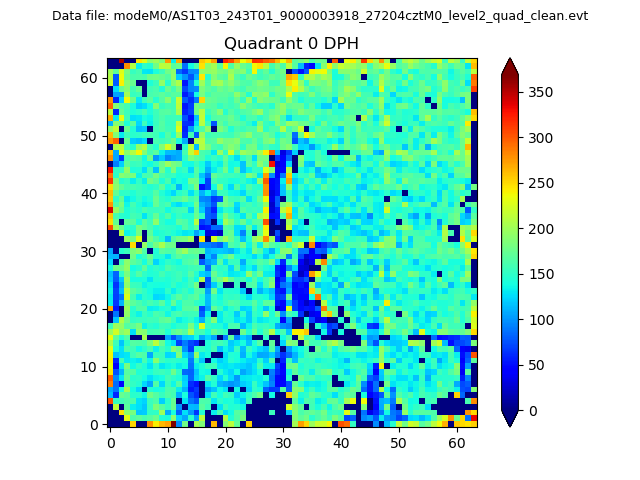 |
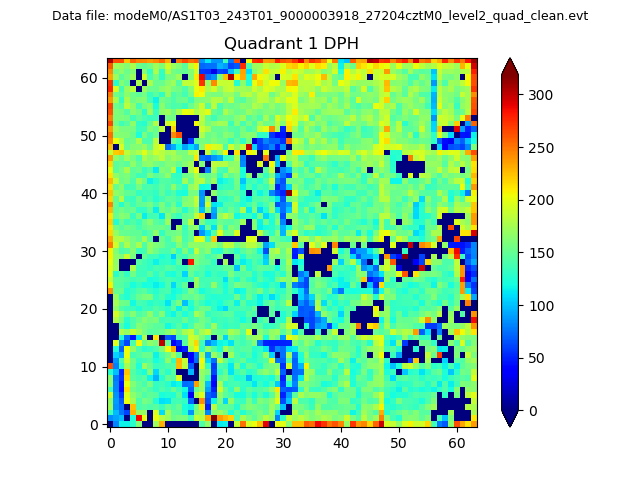 |
Quadrant B |
|---|---|---|---|
| Quadrant D | 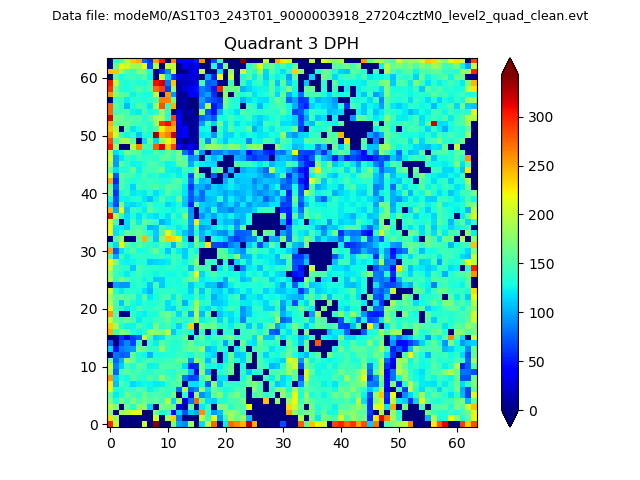 |
 |
Quadrant C |
| Plot type | Count rate plots | Images |
|---|---|---|
| Comparison with Poisson distribution Blue bars denote a histogram of data divided into 1 sec bins. Red curve is a Poisson curve with rate = median count rate of data. |
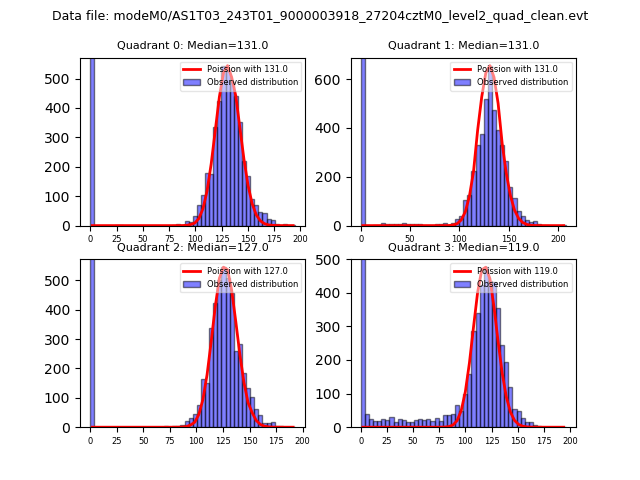 |
 |
| Quadrant-wise count rates Data is divided into 100 sec bins |
 |
|
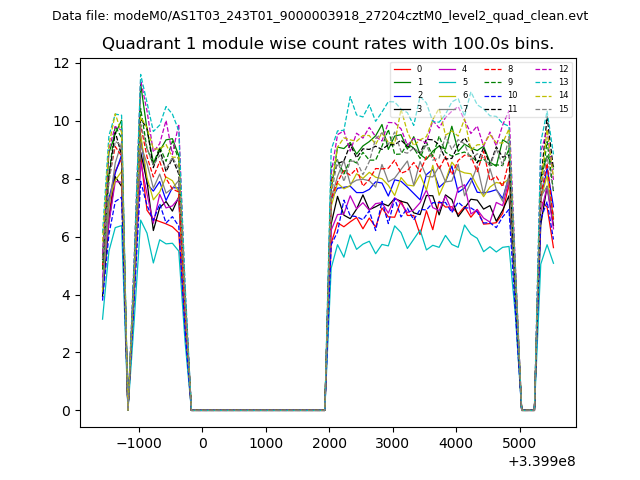
| Module-wise count rates for Quadrant A Data is divided into 100 sec bins |
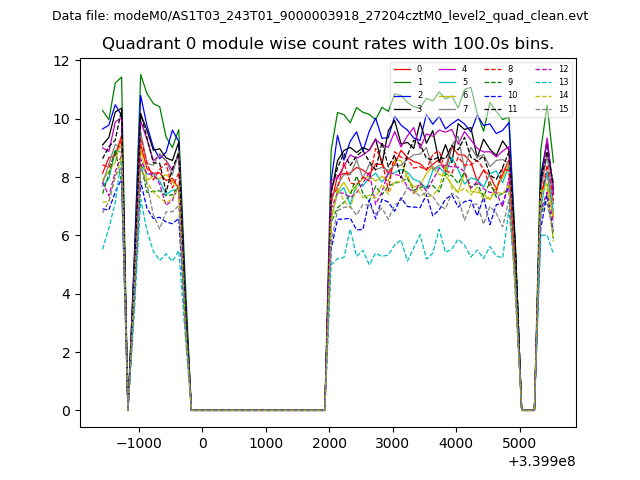 |
 |
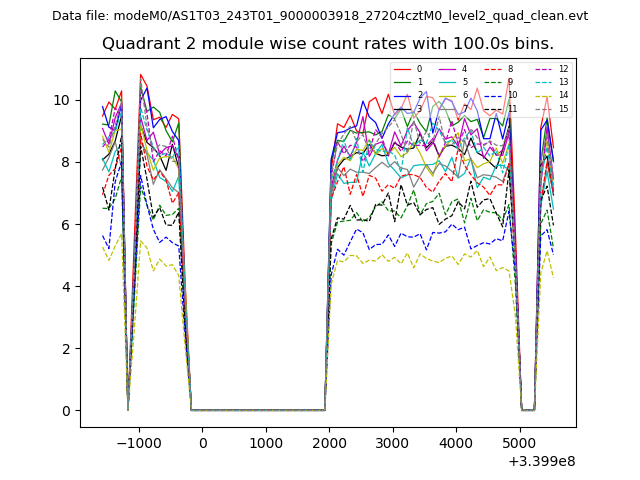
| Module-wise count rates for Quadrant B Data is divided into 100 sec bins |
 |
 |
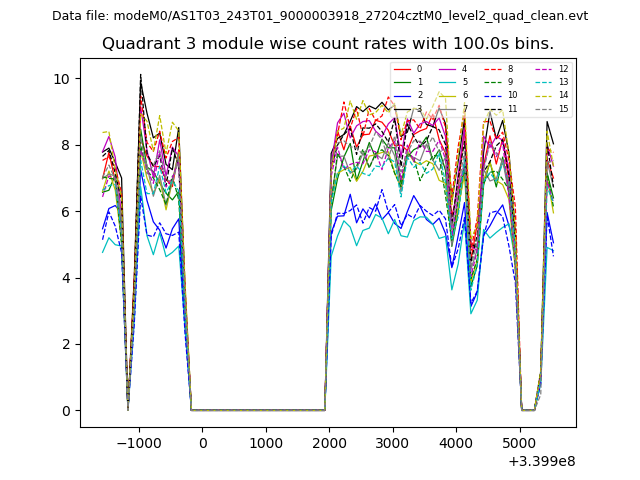
| Module-wise count rates for Quadrant C Data is divided into 100 sec bins |
 |
 |
| Module-wise count rates for Quadrant D Data is divided into 100 sec bins |
 |
 |
| Parameter | Plot |
|---|---|
| CZT HV Monitor | 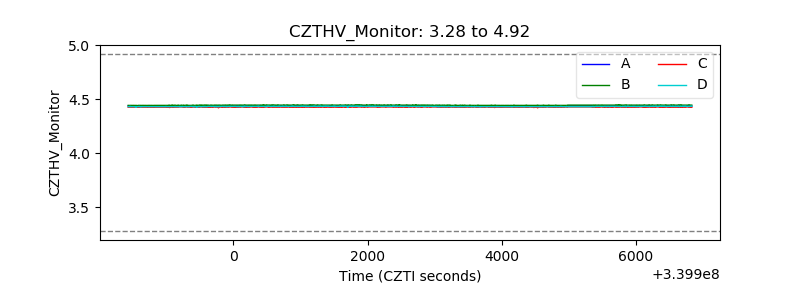 |
| D_VDD | 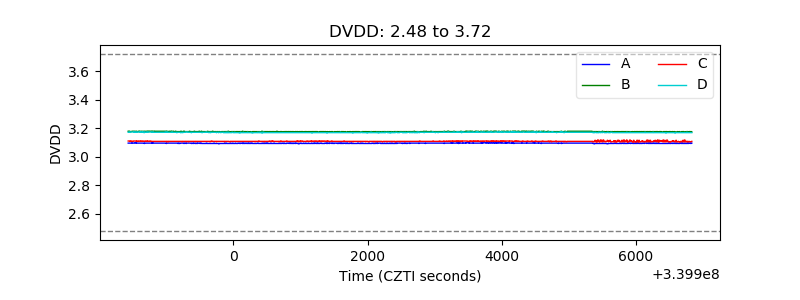 |
| Temperature 1 | 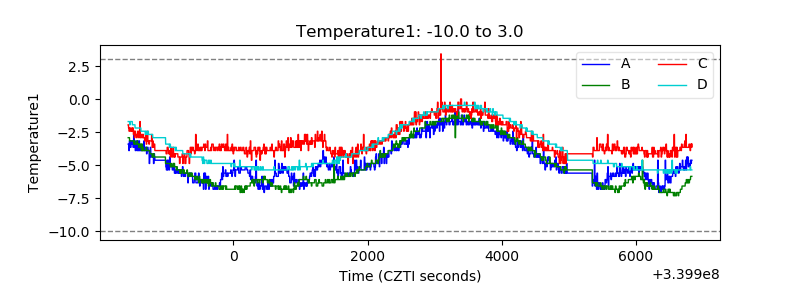 |
| Veto HV Monitor |  |
| Veto LLD |  |
| Alpha Counter | 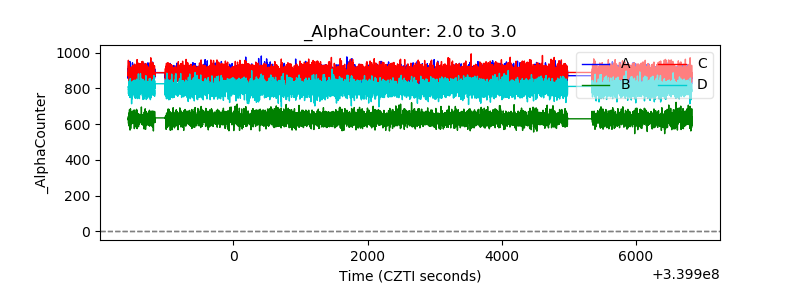 |
| _CPM_Rate | 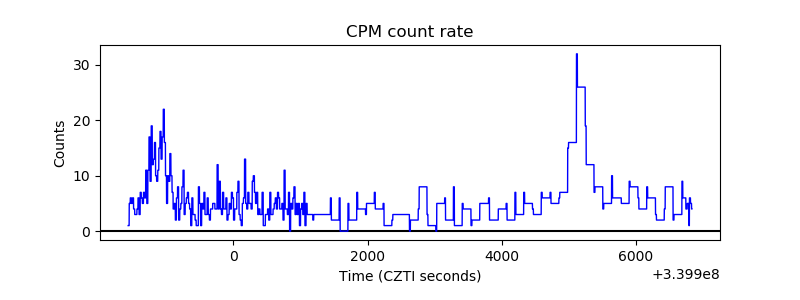 |
| CZT Counter | 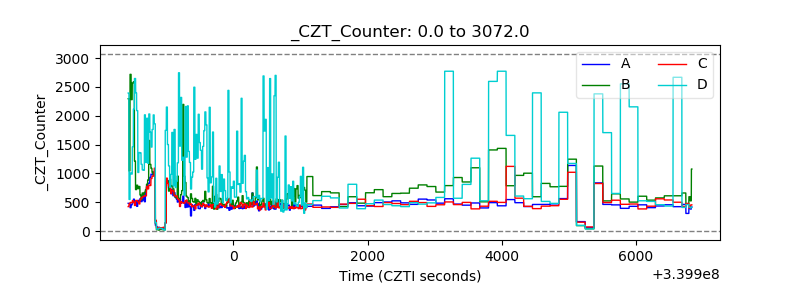 |
| +2.5 Volts monitor |  |
| +5 Volts monitor |  |
| _ROLL_ROT | 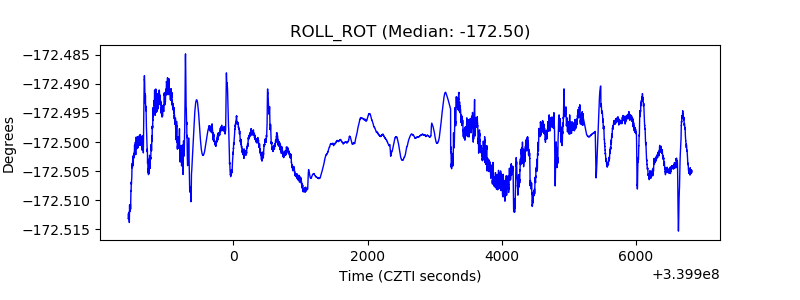 |
| _Roll_DEC | 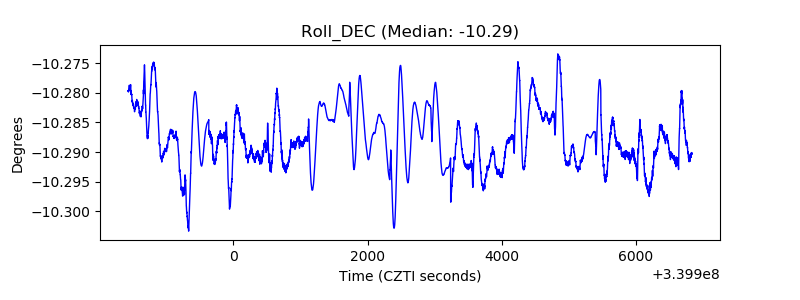 |
| _Roll_RA |  |
| Veto Counter | 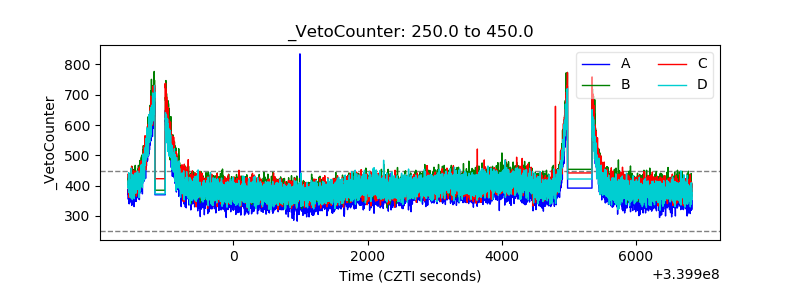 |