| Param | Original file | Final file |
|---|---|---|
| Filename | modeM0/AS1T03_243T01_9000003918_27206cztM0_level2.evt | modeM0/AS1T03_243T01_9000003918_27206cztM0_level2_quad_clean.evt |
| Size (bytes) | 1,055,096,640 | 144,498,240 |
| Size | 1006.2 MB | 137.8 MB |
| Events in quadrant A | 6,144,397 | 900,574 |
| Events in quadrant B | 7,795,955 | 904,586 |
| Events in quadrant C | 6,163,410 | 875,860 |
| Events in quadrant D | 10,975,950 | 800,810 |
| Mode M9 | |||
|---|---|---|---|
| Quadrant | BADHDUFLAG | Total packets | Discarded packets |
| A | 0 | 13 | 0 |
| B | 0 | 14 | 0 |
| C | 0 | 14 | 0 |
| D | 0 | 14 | 0 |
| Mode M0 | |||
|---|---|---|---|
| Quadrant | BADHDUFLAG | Total packets | Discarded packets |
| A | 0 | 26529 | 0 |
| B | 0 | 31559 | 0 |
| C | 0 | 26423 | 0 |
| D | 0 | 41322 | 0 |
| Quadrant | Total seconds | Saturated seconds | Saturation percentage |
|---|---|---|---|
| A | 12937 | 97 | 0.749787% |
| B | 12937 | 329 | 2.543093% |
| C | 12937 | 155 | 1.198114% |
| D | 12936 | 1443 | 11.154917% |
Noise dominated data is calculated using 1-second bins in cleaned event files. If a bin has >2000 counts, and if more than 50% of those come from <1% of pixels, then it is considered to be noise-dominated and hence unusable.
| Quadrant | # 1 sec bins | Bins with >0 counts | Bins with >2000 counts | High rate bins dominated by noise | Noise dominated (total time) | Noise dominated (detector-on time) | Marked lightcurve |
|---|---|---|---|---|---|---|---|
| A | 14197 | 12939 | 3 | 3 | 0.02% | 0.02% |  |
| B | 14197 | 12939 | 113 | 113 | 0.80% | 0.87% |  |
| C | 14197 | 12939 | 1 | 1 | 0.01% | 0.01% |  |
| D | 14196 | 12937 | 1208 | 1208 | 8.51% | 9.34% |  |
Top three noisy pixels from each quadrant. If the there are fewer than three noisy pixels in the level2.evt file, extra rows are filled as -1
| Pixel properties | Quadrant properties | ||||||
|---|---|---|---|---|---|---|---|
| Quadrant | DetID | PixID | Counts | Sigma | Mean | Median | Sigma |
| A | 8 | 192 | 18670 | 53.82 | 1582 | 1550 | 318.1 |
| A | 13 | 254 | 18388 | 52.93 | 1582 | 1550 | 318.1 |
| A | 14 | 235 | 15364 | 43.42 | 1582 | 1550 | 318.1 |
| B | 3 | 64 | 1445416 | 4818.81 | 1567 | 1527 | 299.6 |
| B | 10 | 245 | 147767 | 488.06 | 1567 | 1527 | 299.6 |
| B | 12 | 111 | 37693 | 120.7 | 1567 | 1527 | 299.6 |
| C | 14 | 238 | 238965 | 666.8 | 1512 | 1521 | 356.1 |
| C | 4 | 224 | 19596 | 50.76 | 1512 | 1521 | 356.1 |
| C | 13 | 61 | 10343 | 24.77 | 1512 | 1521 | 356.1 |
| D | 1 | 52 | 4209556 | 12083.09 | 1433 | 1399 | 348.3 |
| D | 5 | 222 | 438660 | 1255.53 | 1433 | 1399 | 348.3 |
| D | 15 | 0 | 424000 | 1213.43 | 1433 | 1399 | 348.3 |
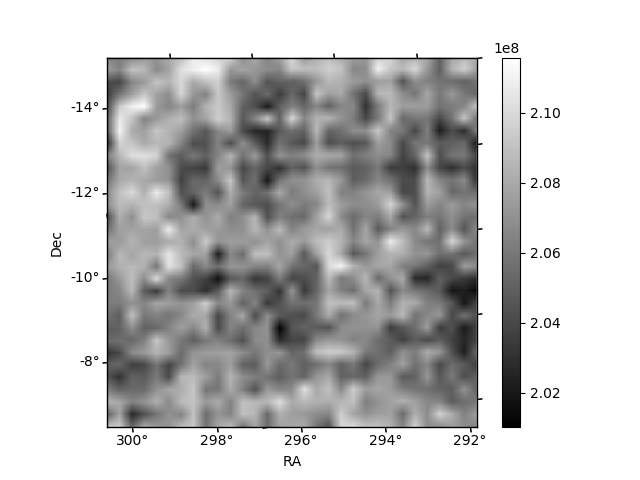
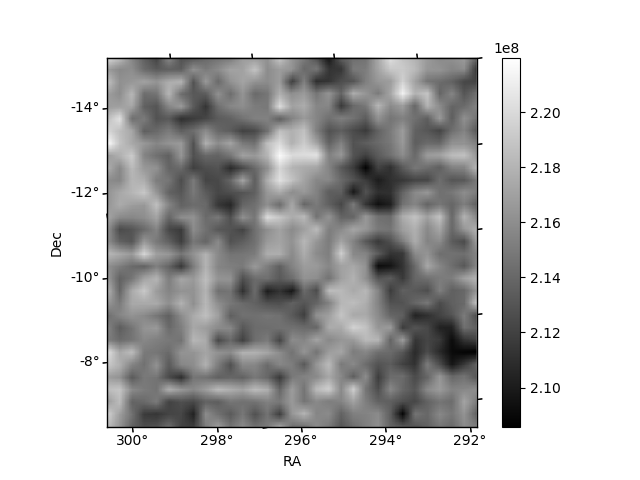
Histogram calculated using DETX and DETY for each event in the final _common_clean file
| Quadrant A | 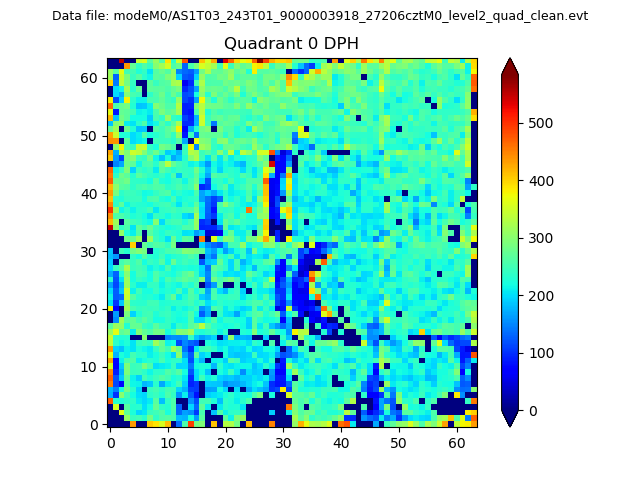 |
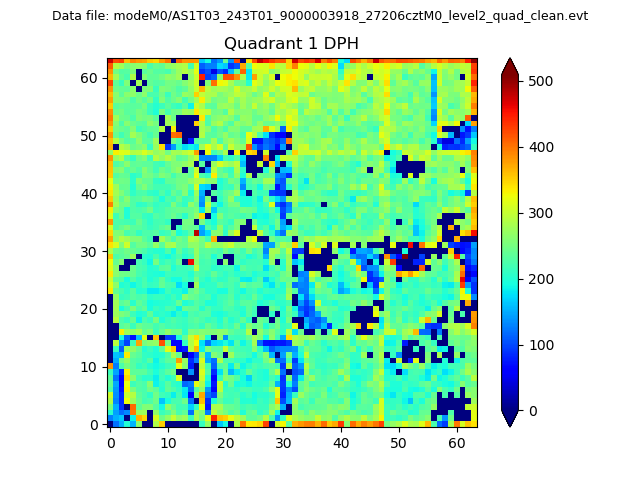 |
Quadrant B |
|---|---|---|---|
| Quadrant D | 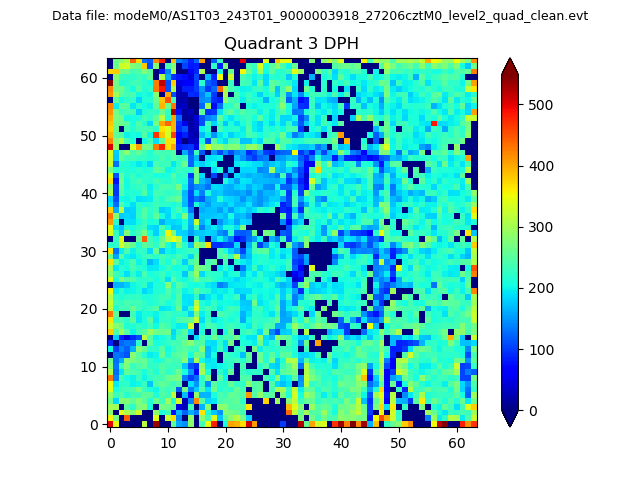 |
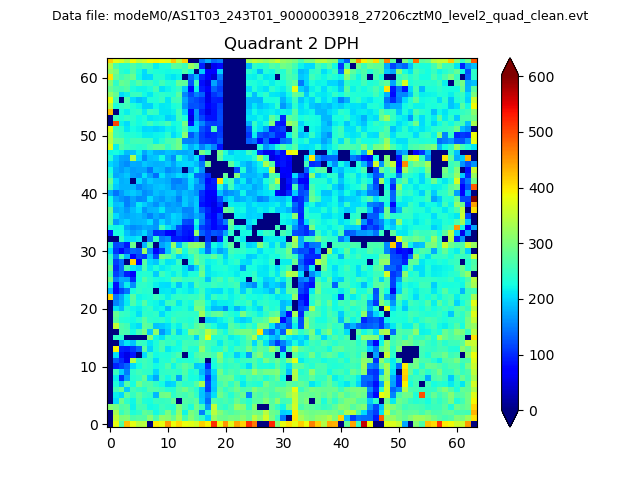 |
Quadrant C |
| Plot type | Count rate plots | Images |
|---|---|---|
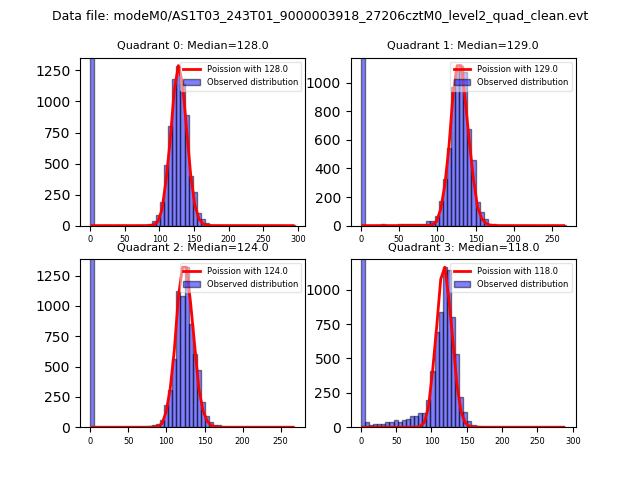
| Comparison with Poisson distribution Blue bars denote a histogram of data divided into 1 sec bins. Red curve is a Poisson curve with rate = median count rate of data. |
 |
 |
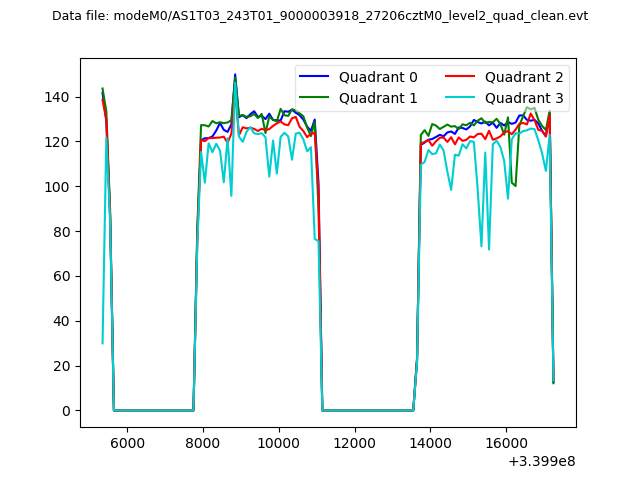
| Quadrant-wise count rates Data is divided into 100 sec bins |
 |
|
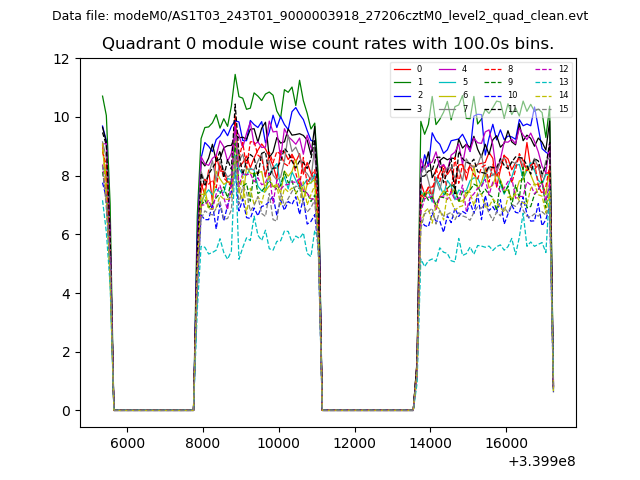
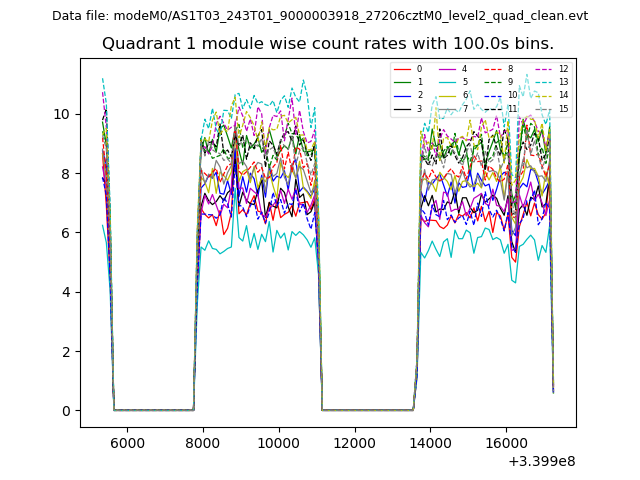
| Module-wise count rates for Quadrant A Data is divided into 100 sec bins |
 |
 |
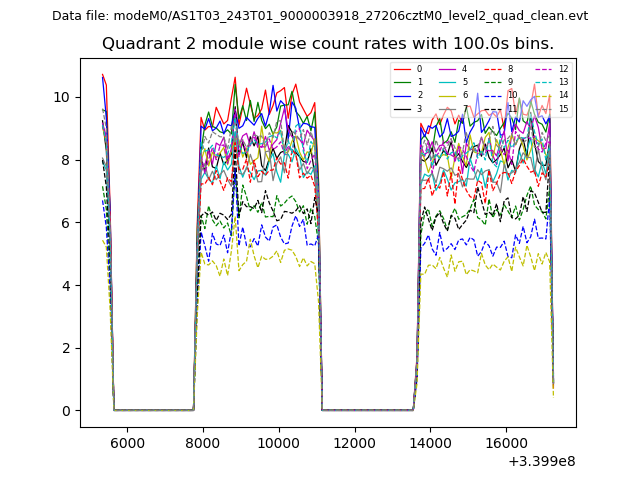
| Module-wise count rates for Quadrant B Data is divided into 100 sec bins |
 |
 |
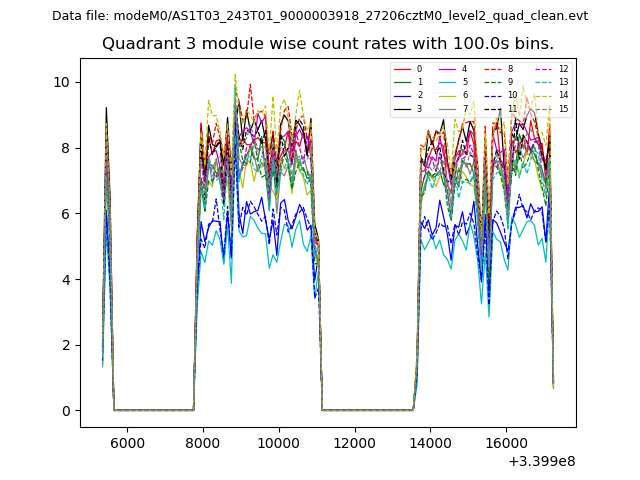
| Module-wise count rates for Quadrant C Data is divided into 100 sec bins |
 |
 |
| Module-wise count rates for Quadrant D Data is divided into 100 sec bins |
 |
 |
| Parameter | Plot |
|---|---|
| CZT HV Monitor | 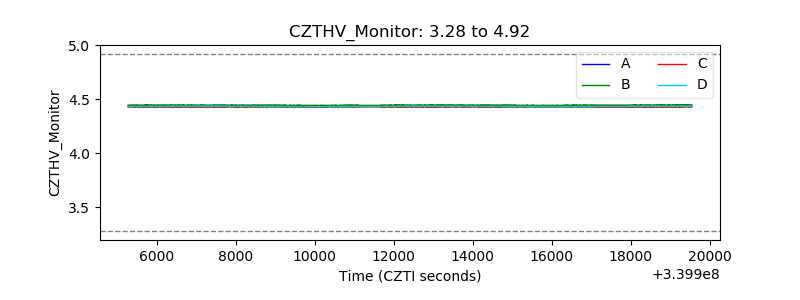 |
| D_VDD | 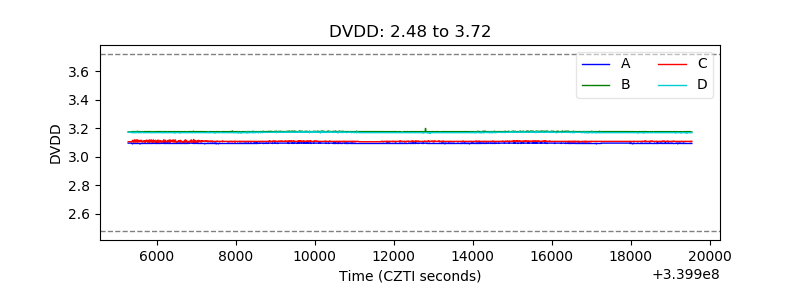 |
| Temperature 1 | 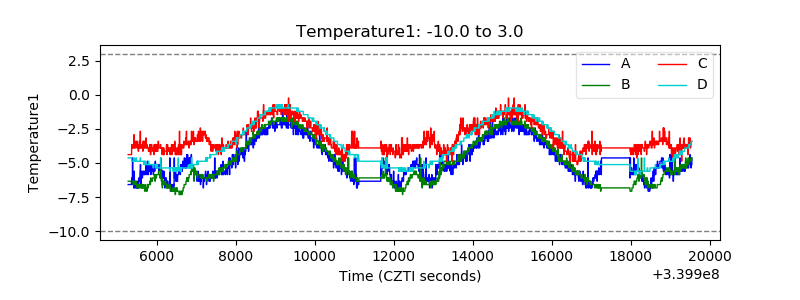 |
| Veto HV Monitor |  |
| Veto LLD | 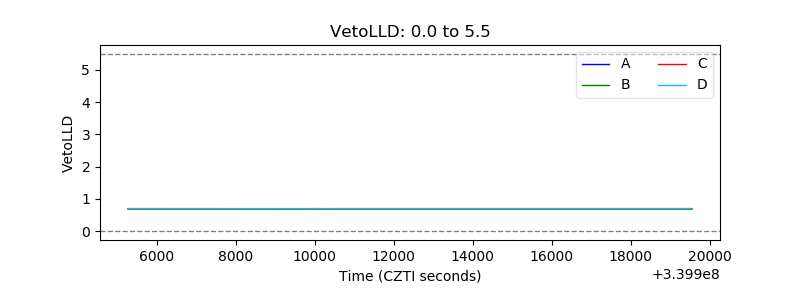 |
| Alpha Counter | 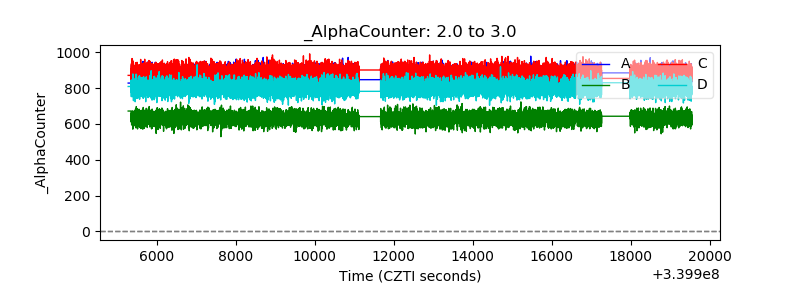 |
| _CPM_Rate | 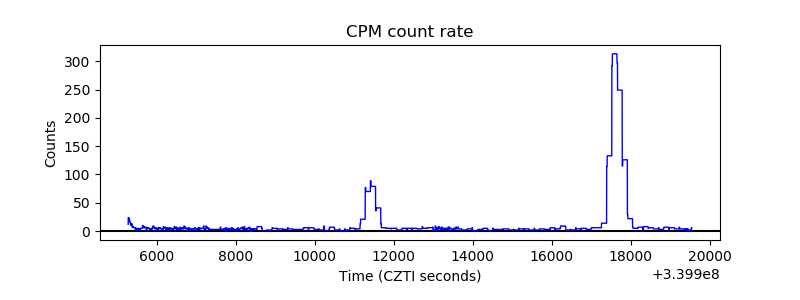 |
| CZT Counter | 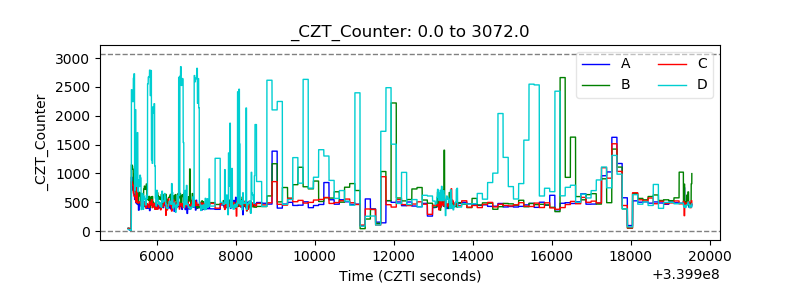 |
| +2.5 Volts monitor | 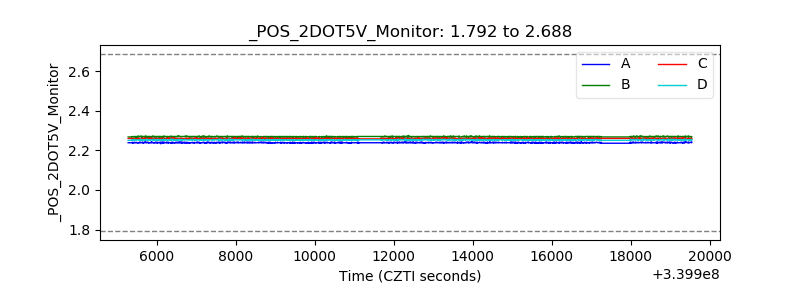 |
| +5 Volts monitor |  |
| _ROLL_ROT | 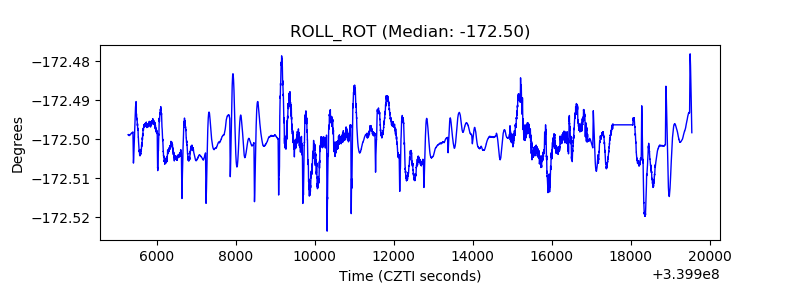 |
| _Roll_DEC | 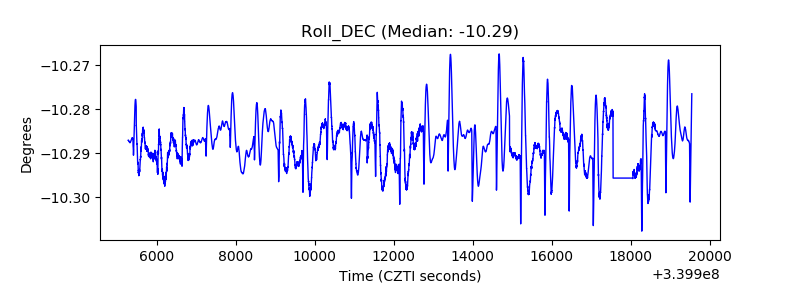 |
| _Roll_RA | 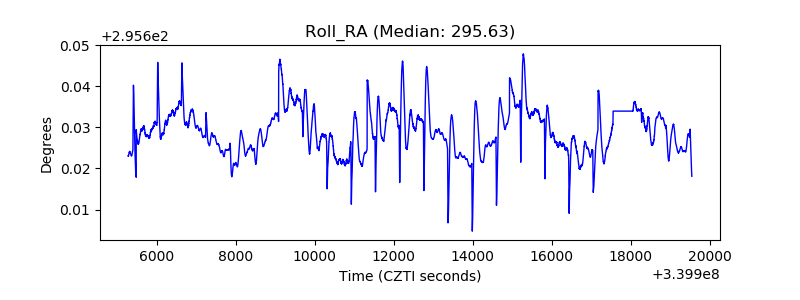 |
| Veto Counter | 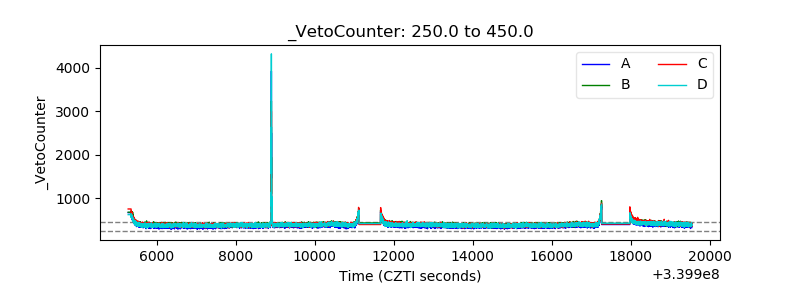 |