| Param | Original file | Final file |
|---|---|---|
| Filename | modeM0/AS1T03_243T01_9000003918_27208cztM0_level2.evt | modeM0/AS1T03_243T01_9000003918_27208cztM0_level2_quad_clean.evt |
| Size (bytes) | 477,590,400 | 88,545,600 |
| Size | 455.5 MB | 84.4 MB |
| Events in quadrant A | 3,205,203 | 573,625 |
| Events in quadrant B | 3,512,954 | 579,396 |
| Events in quadrant C | 3,121,911 | 552,506 |
| Events in quadrant D | 4,198,595 | 538,958 |
| Mode M9 | |||
|---|---|---|---|
| Quadrant | BADHDUFLAG | Total packets | Discarded packets |
| A | 0 | 11 | 0 |
| B | 0 | 11 | 0 |
| C | 0 | 11 | 0 |
| D | 0 | 11 | 0 |
| Mode M0 | |||
|---|---|---|---|
| Quadrant | BADHDUFLAG | Total packets | Discarded packets |
| A | 0 | 13461 | 0 |
| B | 0 | 14451 | 0 |
| C | 0 | 13232 | 0 |
| D | 0 | 16611 | 0 |
| Quadrant | Total seconds | Saturated seconds | Saturation percentage |
|---|---|---|---|
| A | 6267 | 80 | 1.276528% |
| B | 6267 | 164 | 2.616882% |
| C | 6267 | 120 | 1.914792% |
| D | 6267 | 161 | 2.569012% |
Noise dominated data is calculated using 1-second bins in cleaned event files. If a bin has >2000 counts, and if more than 50% of those come from <1% of pixels, then it is considered to be noise-dominated and hence unusable.
| Quadrant | # 1 sec bins | Bins with >0 counts | Bins with >2000 counts | High rate bins dominated by noise | Noise dominated (total time) | Noise dominated (detector-on time) | Marked lightcurve |
|---|---|---|---|---|---|---|---|
| A | 7292 | 6268 | 5 | 5 | 0.07% | 0.08% | 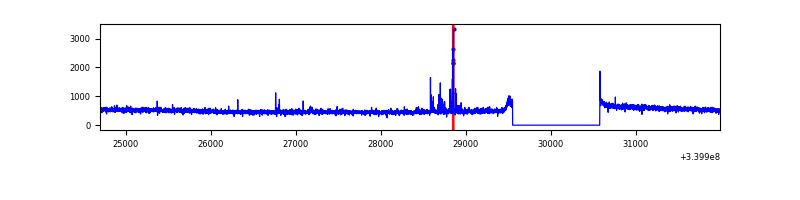 |
| B | 7291 | 6267 | 35 | 35 | 0.48% | 0.56% | 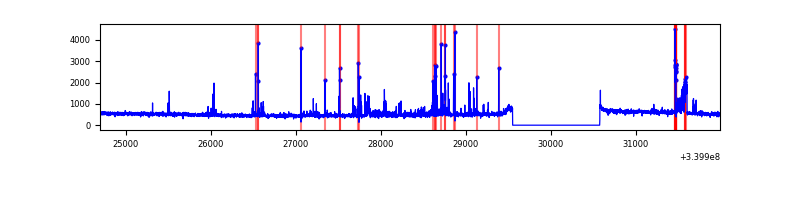 |
| C | 7292 | 6268 | 1 | 1 | 0.01% | 0.02% | 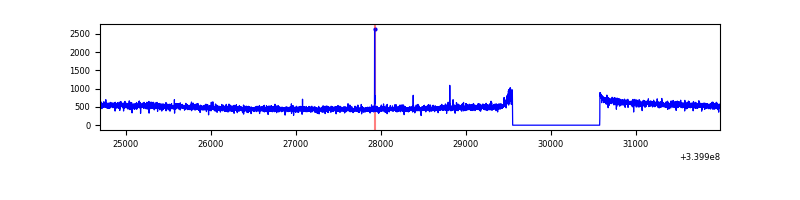 |
| D | 7292 | 6268 | 82 | 82 | 1.12% | 1.31% | 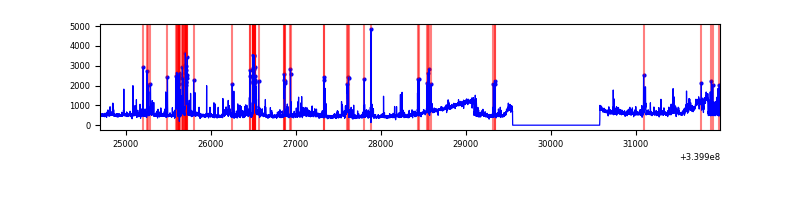 |
Top three noisy pixels from each quadrant. If the there are fewer than three noisy pixels in the level2.evt file, extra rows are filled as -1
| Pixel properties | Quadrant properties | ||||||
|---|---|---|---|---|---|---|---|
| Quadrant | DetID | PixID | Counts | Sigma | Mean | Median | Sigma |
| A | 14 | 235 | 55907 | 339.62 | 811 | 796 | 162.3 |
| A | 15 | 174 | 15820 | 92.58 | 811 | 796 | 162.3 |
| A | 13 | 254 | 9580 | 54.13 | 811 | 796 | 162.3 |
| B | 3 | 64 | 357768 | 2328.43 | 797 | 777 | 153.3 |
| B | 12 | 111 | 18596 | 116.22 | 797 | 777 | 153.3 |
| B | 11 | 111 | 16641 | 103.47 | 797 | 777 | 153.3 |
| C | 14 | 238 | 124144 | 685.65 | 767 | 772 | 179.9 |
| C | 15 | 208 | 5451 | 26.0 | 767 | 772 | 179.9 |
| C | 4 | 224 | 5395 | 25.69 | 767 | 772 | 179.9 |
| D | 15 | 0 | 487442 | 2631.13 | 774 | 756 | 185.0 |
| D | 12 | 17 | 342613 | 1848.15 | 774 | 756 | 185.0 |
| D | 1 | 52 | 289366 | 1560.29 | 774 | 756 | 185.0 |
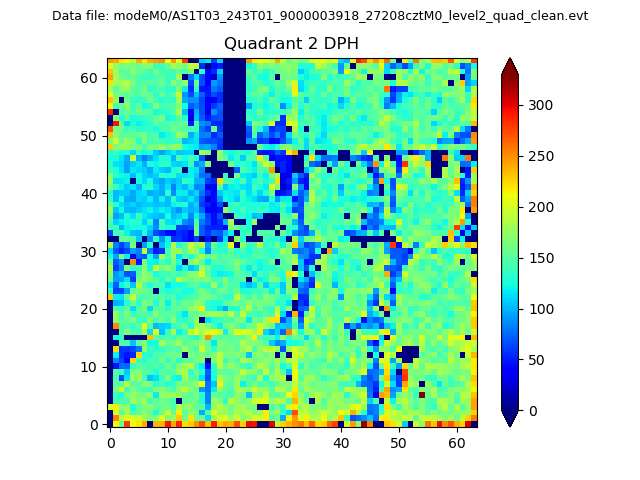
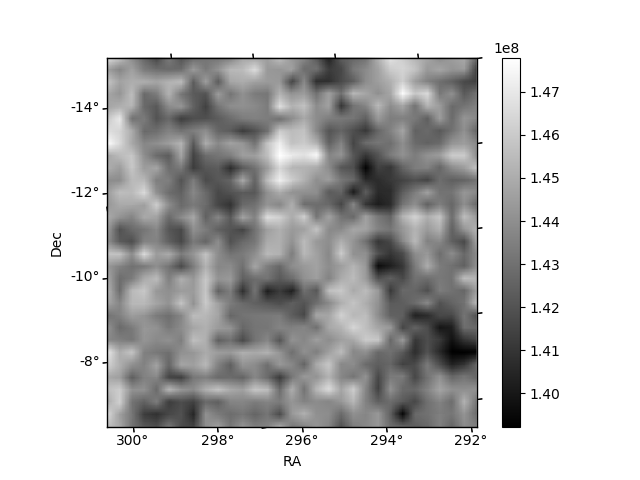
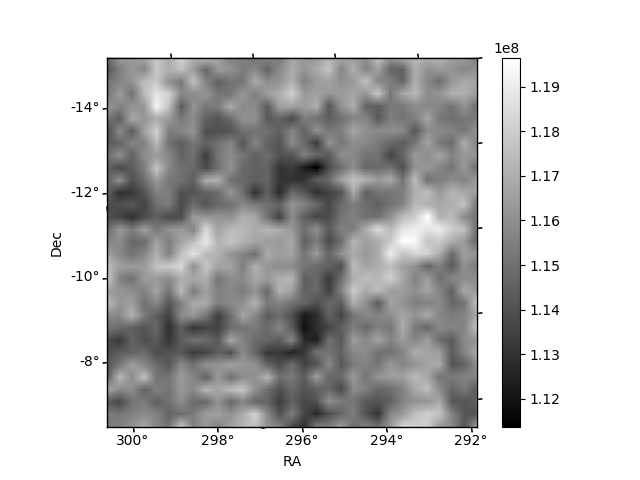
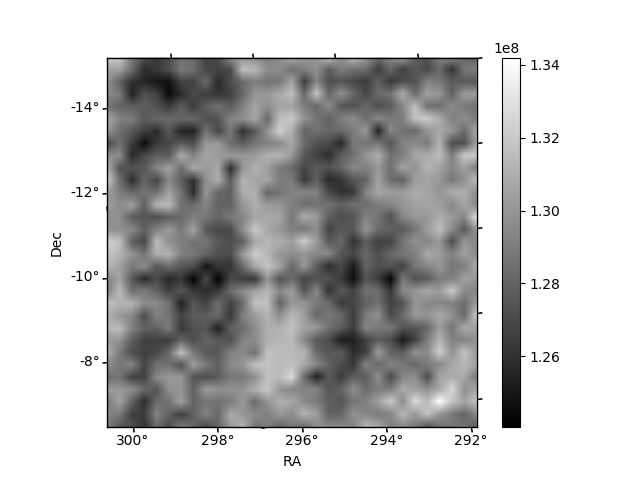
Histogram calculated using DETX and DETY for each event in the final _common_clean file
| Quadrant A |  |
 |
Quadrant B |
|---|---|---|---|
| Quadrant D | 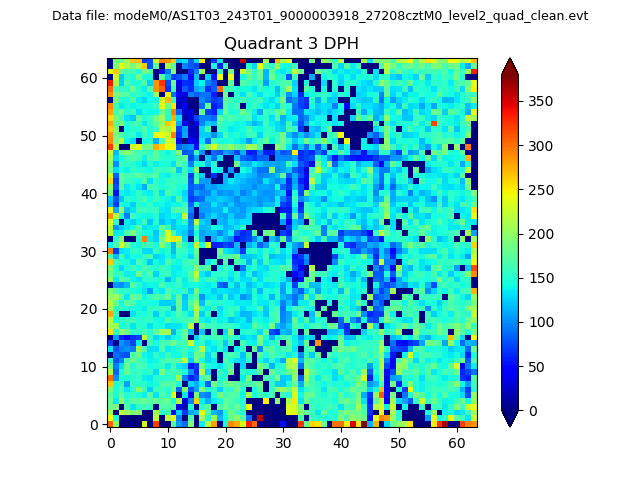 |
 |
Quadrant C |
| Plot type | Count rate plots | Images |
|---|---|---|
| Comparison with Poisson distribution Blue bars denote a histogram of data divided into 1 sec bins. Red curve is a Poisson curve with rate = median count rate of data. |
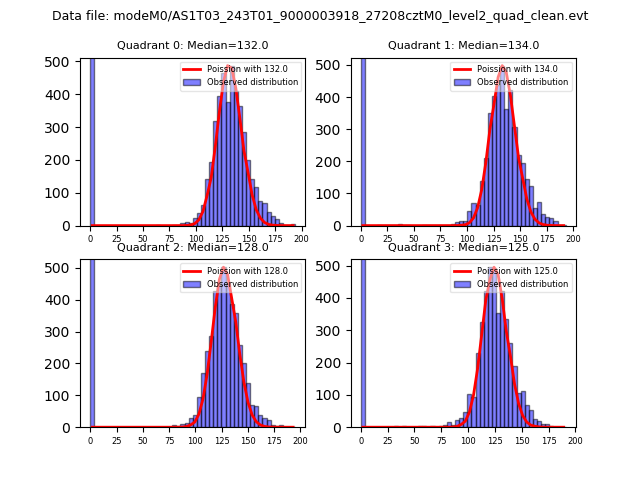 |
 |
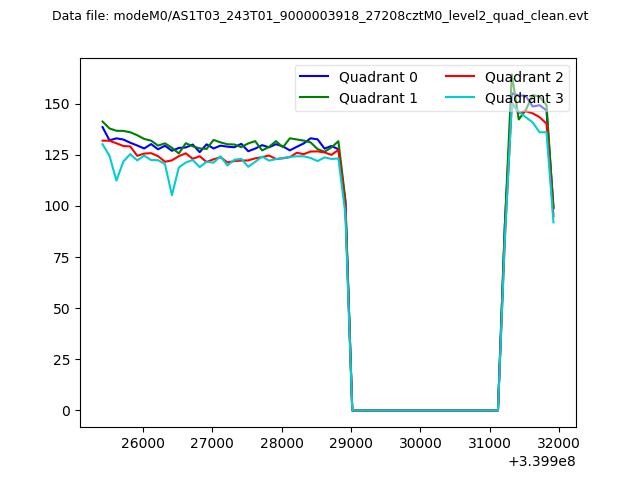
| Quadrant-wise count rates Data is divided into 100 sec bins |
 |
|
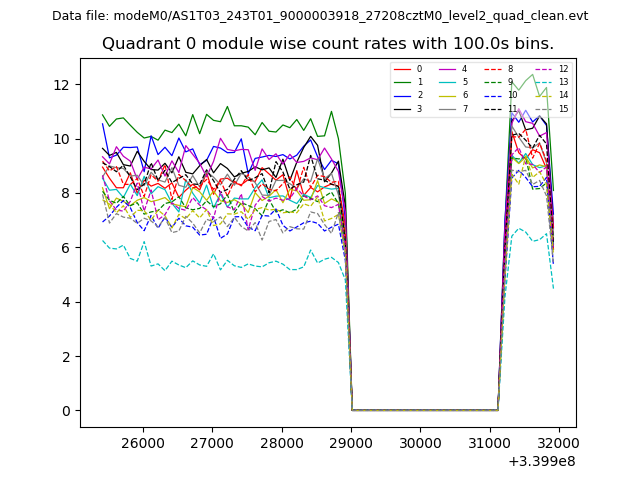
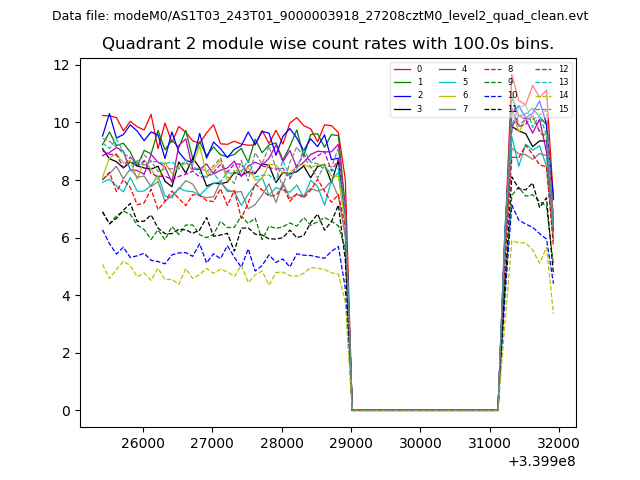
| Module-wise count rates for Quadrant A Data is divided into 100 sec bins |
 |
 |
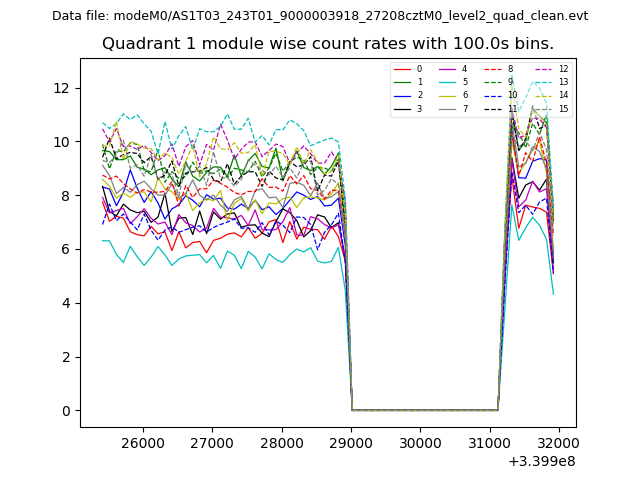
| Module-wise count rates for Quadrant B Data is divided into 100 sec bins |
 |
 |
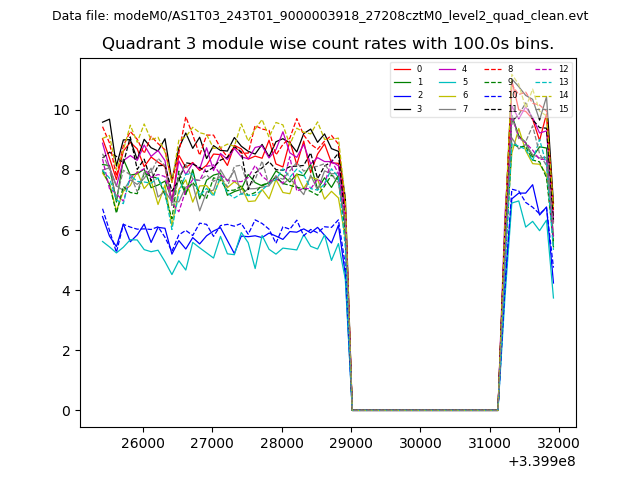
| Module-wise count rates for Quadrant C Data is divided into 100 sec bins |
 |
 |
| Module-wise count rates for Quadrant D Data is divided into 100 sec bins |
 |
 |
| Parameter | Plot |
|---|---|
| CZT HV Monitor | 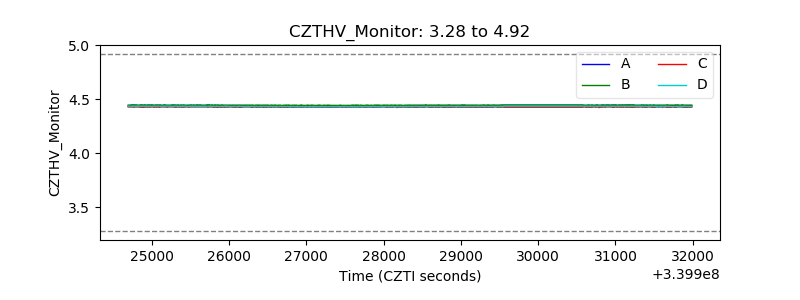 |
| D_VDD | 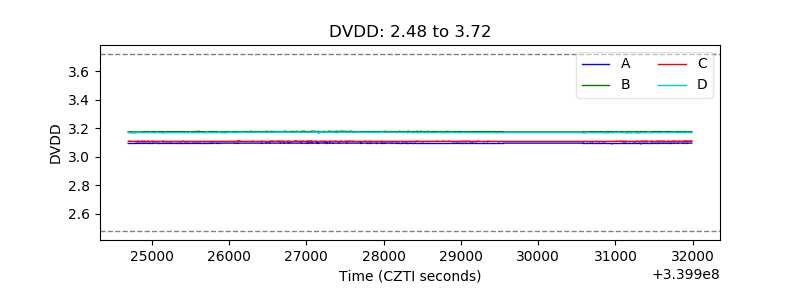 |
| Temperature 1 | 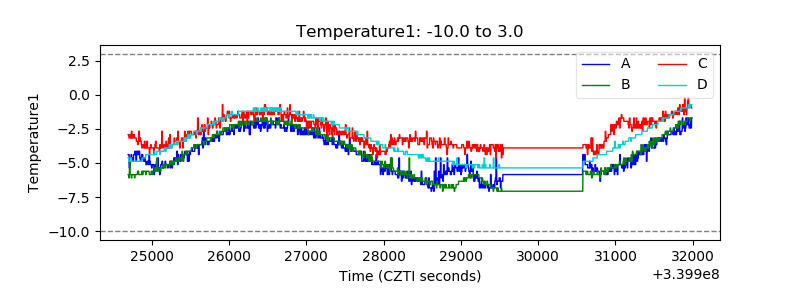 |
| Veto HV Monitor | 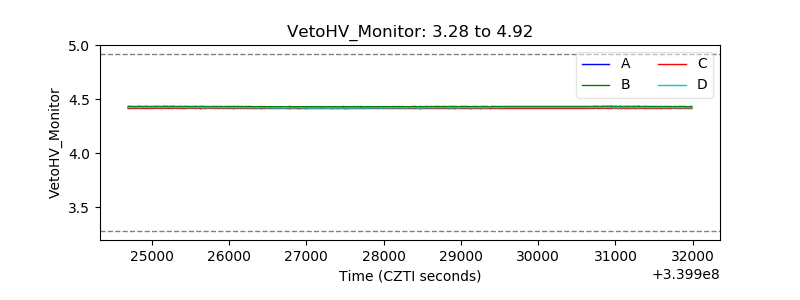 |
| Veto LLD | 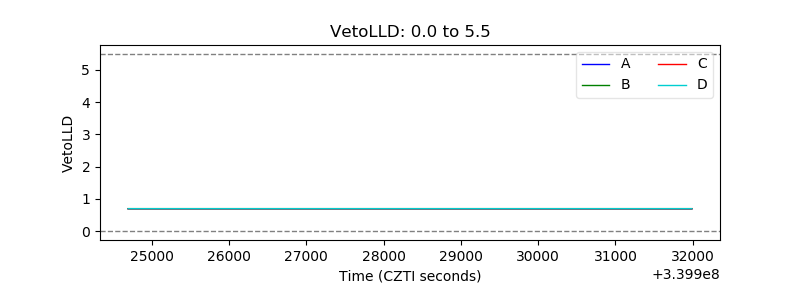 |
| Alpha Counter | 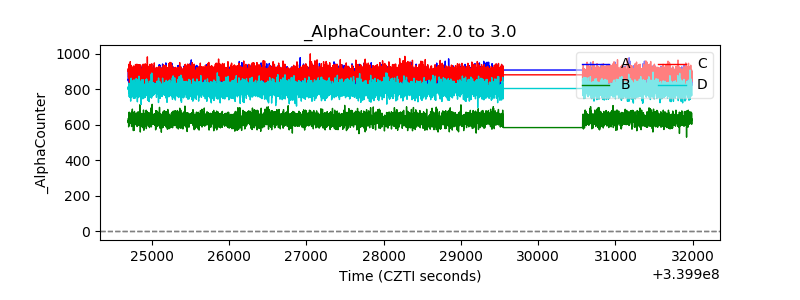 |
| _CPM_Rate |  |
| CZT Counter | 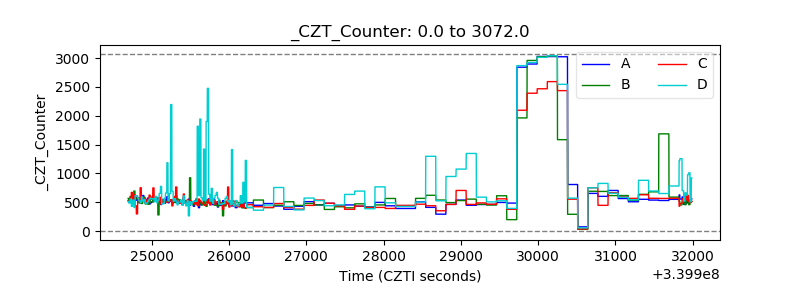 |
| +2.5 Volts monitor | 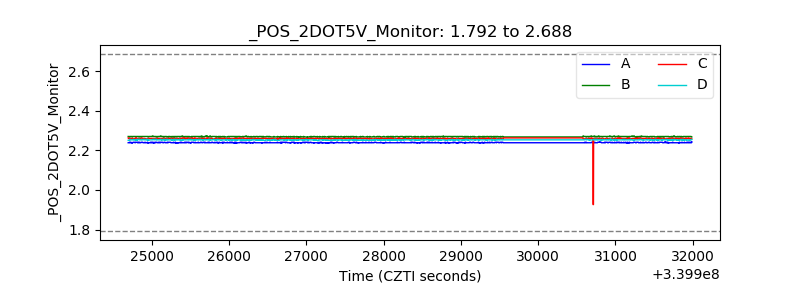 |
| +5 Volts monitor | 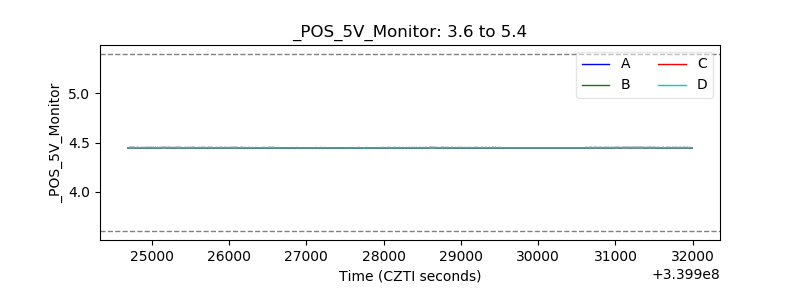 |
| _ROLL_ROT | 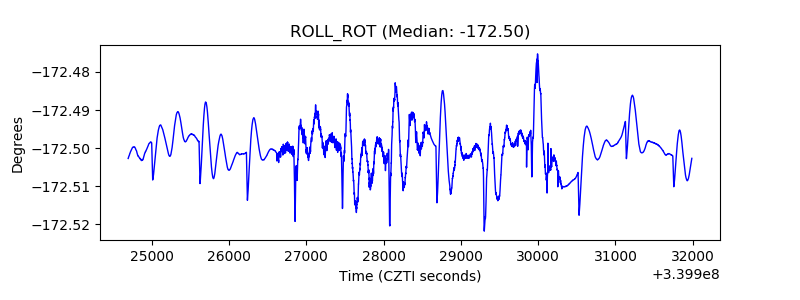 |
| _Roll_DEC | 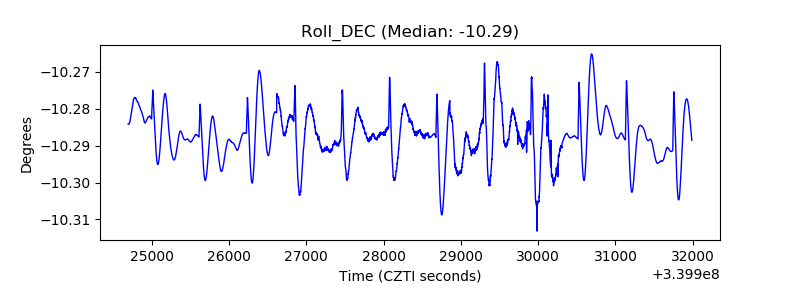 |
| _Roll_RA | 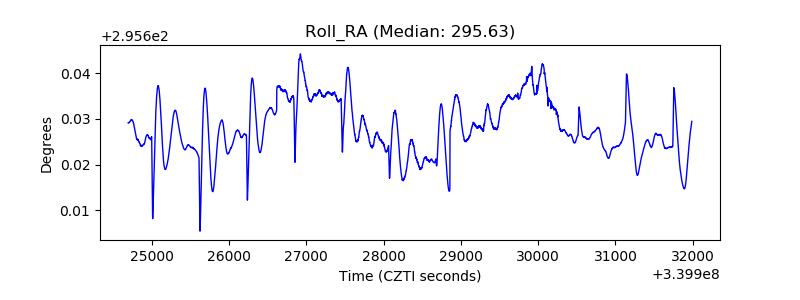 |
| Veto Counter | 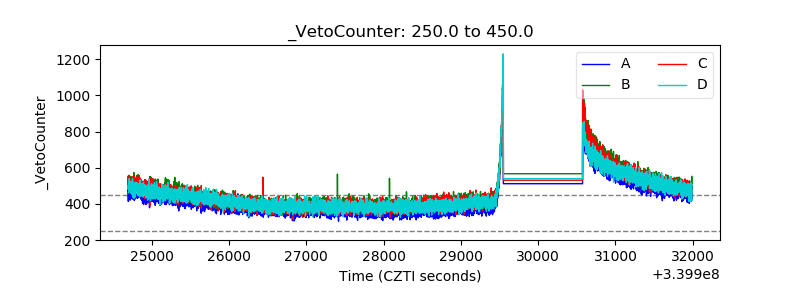 |