| Param | Original file | Final file |
|---|---|---|
| Filename | modeM0/AS1T03_243T01_9000003918_27211cztM0_level2.evt | modeM0/AS1T03_243T01_9000003918_27211cztM0_level2_quad_clean.evt |
| Size (bytes) | 860,184,000 | 183,329,280 |
| Size | 820.3 MB | 174.8 MB |
| Events in quadrant A | 5,431,242 | 1,254,440 |
| Events in quadrant B | 6,310,241 | 1,250,012 |
| Events in quadrant C | 5,348,052 | 1,177,853 |
| Events in quadrant D | 8,260,679 | 1,152,250 |
| Mode M9 | |||
|---|---|---|---|
| Quadrant | BADHDUFLAG | Total packets | Discarded packets |
| A | 0 | 25 | 0 |
| B | 0 | 25 | 0 |
| C | 0 | 25 | 0 |
| D | 0 | 25 | 0 |
| Mode M0 | |||
|---|---|---|---|
| Quadrant | BADHDUFLAG | Total packets | Discarded packets |
| A | 0 | 22804 | 0 |
| B | 0 | 25588 | 0 |
| C | 0 | 22556 | 0 |
| D | 0 | 31609 | 0 |
| Quadrant | Total seconds | Saturated seconds | Saturation percentage |
|---|---|---|---|
| A | 10375 | 130 | 1.253012% |
| B | 10376 | 244 | 2.351581% |
| C | 10376 | 178 | 1.715497% |
| D | 10376 | 520 | 5.011565% |
Noise dominated data is calculated using 1-second bins in cleaned event files. If a bin has >2000 counts, and if more than 50% of those come from <1% of pixels, then it is considered to be noise-dominated and hence unusable.
| Quadrant | # 1 sec bins | Bins with >0 counts | Bins with >2000 counts | High rate bins dominated by noise | Noise dominated (total time) | Noise dominated (detector-on time) | Marked lightcurve |
|---|---|---|---|---|---|---|---|
| A | 12815 | 10377 | 0 | 0 | 0.00% | 0.00% | 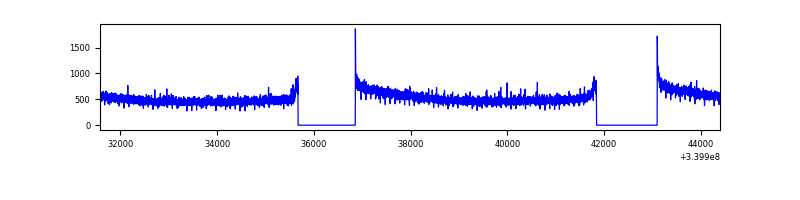 |
| B | 12816 | 10378 | 67 | 67 | 0.52% | 0.65% | 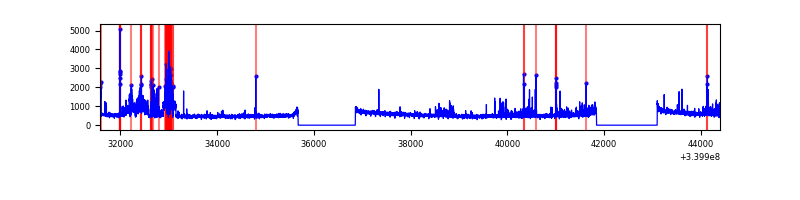 |
| C | 12816 | 10378 | 0 | 0 | 0.00% | 0.00% | 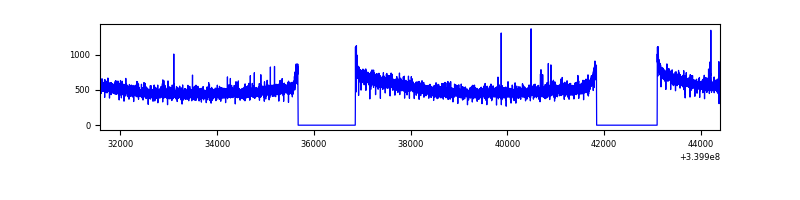 |
| D | 12816 | 10378 | 336 | 336 | 2.62% | 3.24% | 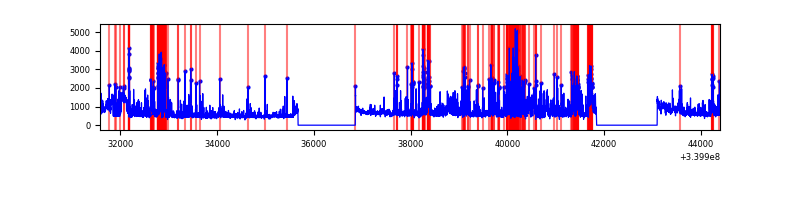 |
Top three noisy pixels from each quadrant. If the there are fewer than three noisy pixels in the level2.evt file, extra rows are filled as -1
| Pixel properties | Quadrant properties | ||||||
|---|---|---|---|---|---|---|---|
| Quadrant | DetID | PixID | Counts | Sigma | Mean | Median | Sigma |
| A | 13 | 254 | 16000 | 52.61 | 1403 | 1379 | 277.9 |
| A | 0 | 226 | 12266 | 39.17 | 1403 | 1379 | 277.9 |
| A | 3 | 137 | 12067 | 38.46 | 1403 | 1379 | 277.9 |
| B | 3 | 64 | 807648 | 3114.06 | 1374 | 1342 | 258.9 |
| B | 15 | 33 | 106058 | 404.43 | 1374 | 1342 | 258.9 |
| B | 12 | 111 | 30339 | 111.99 | 1374 | 1342 | 258.9 |
| C | 14 | 238 | 213388 | 699.28 | 1311 | 1323 | 303.3 |
| C | 15 | 208 | 16270 | 49.29 | 1311 | 1323 | 303.3 |
| C | 4 | 224 | 10125 | 29.02 | 1311 | 1323 | 303.3 |
| D | 1 | 52 | 1440367 | 4359.93 | 1321 | 1292 | 330.1 |
| D | 12 | 17 | 491424 | 1484.94 | 1321 | 1292 | 330.1 |
| D | 12 | 233 | 469762 | 1419.31 | 1321 | 1292 | 330.1 |
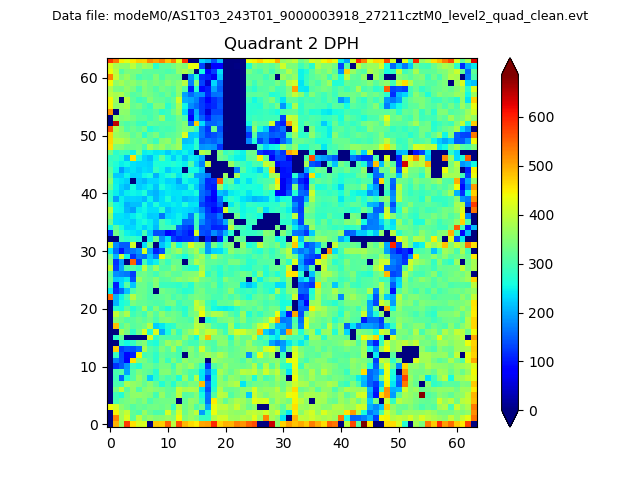
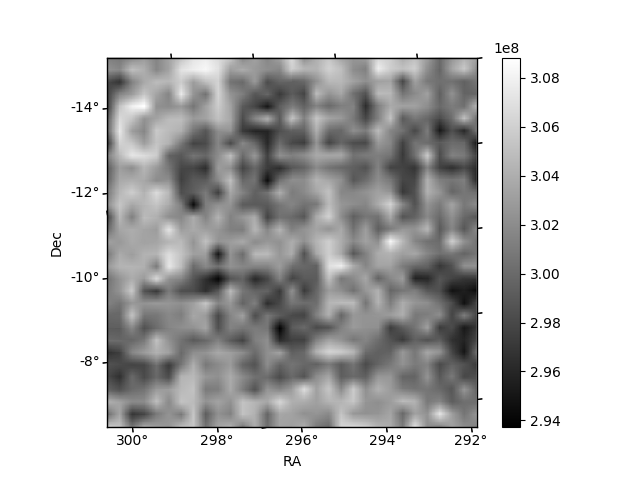
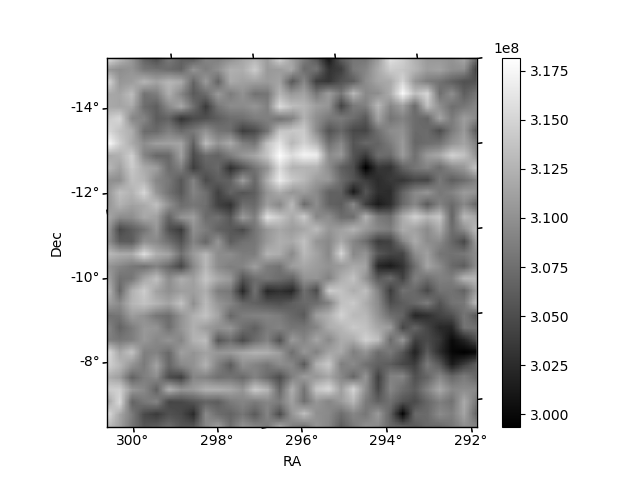
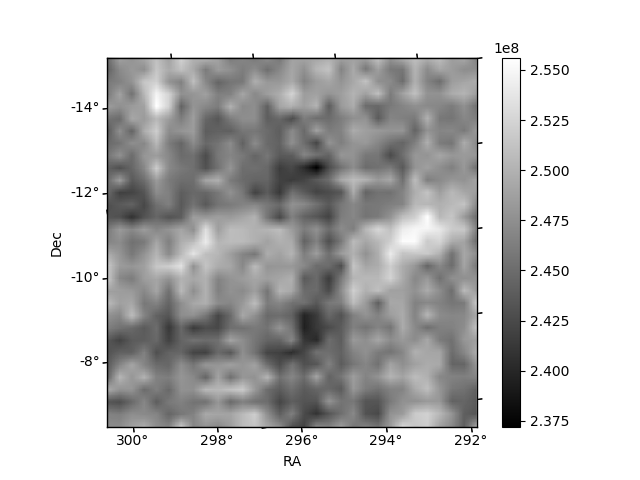
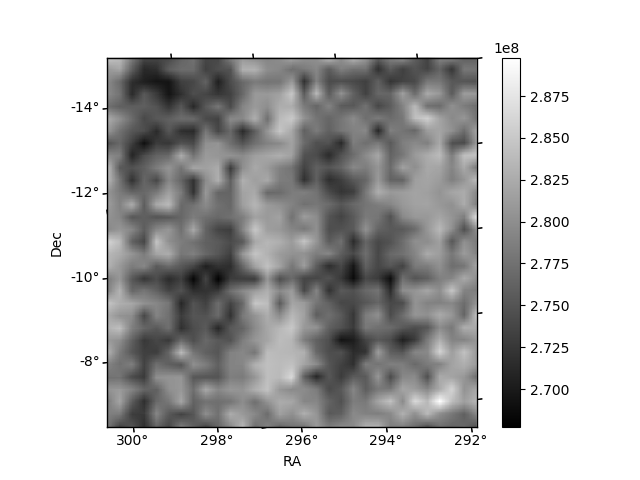
Histogram calculated using DETX and DETY for each event in the final _common_clean file
| Quadrant A | 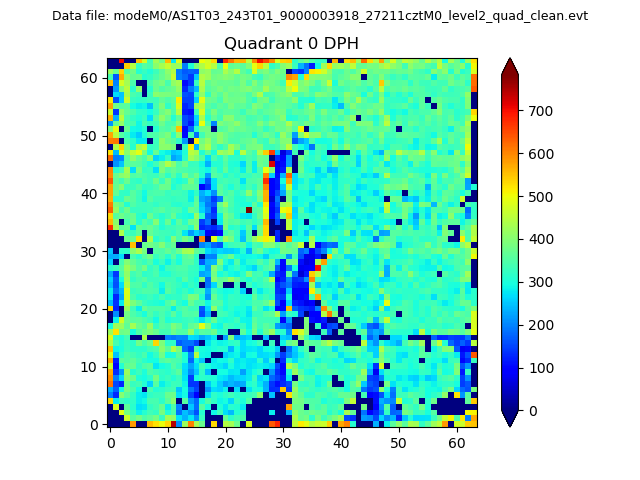 |
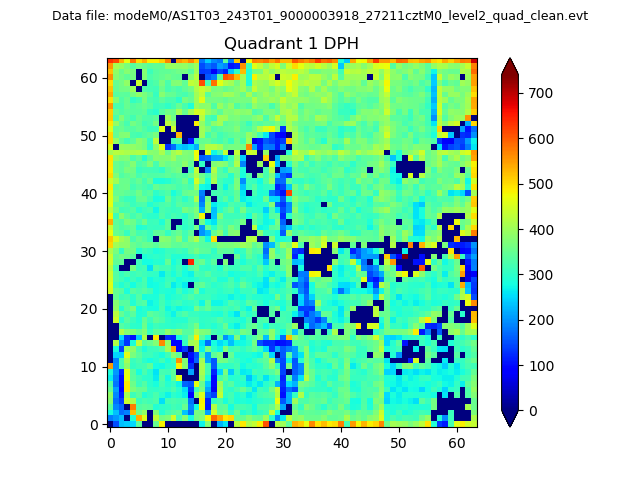 |
Quadrant B |
|---|---|---|---|
| Quadrant D | 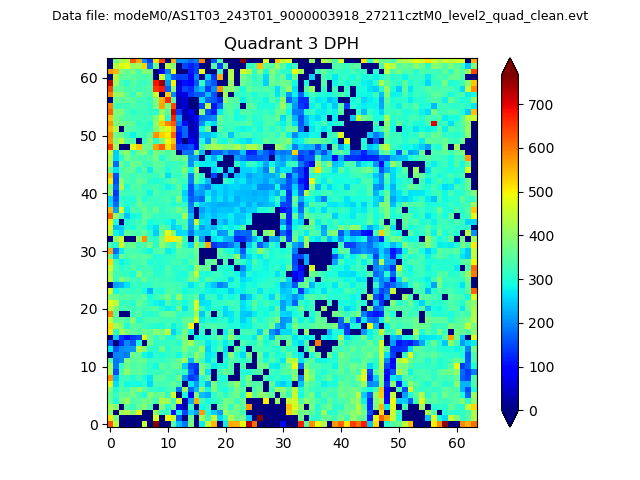 |
 |
Quadrant C |
| Plot type | Count rate plots | Images |
|---|---|---|
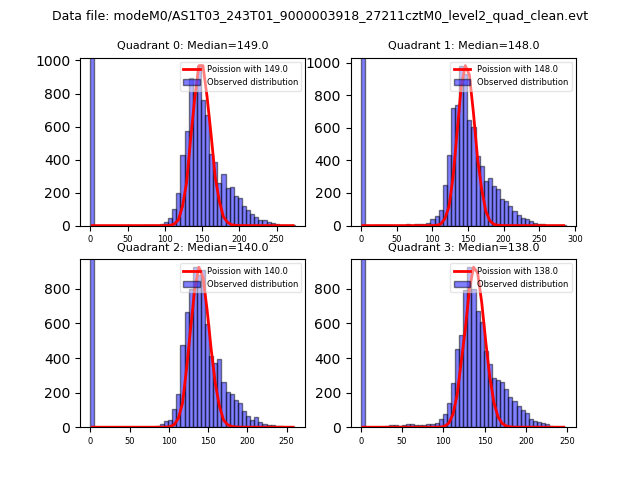
| Comparison with Poisson distribution Blue bars denote a histogram of data divided into 1 sec bins. Red curve is a Poisson curve with rate = median count rate of data. |
 |
 |
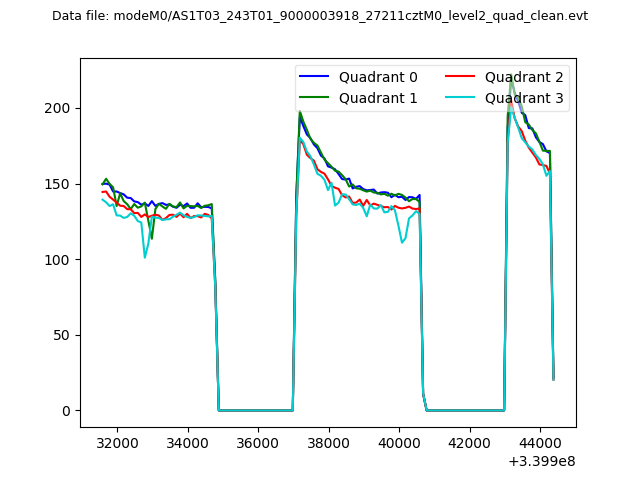
| Quadrant-wise count rates Data is divided into 100 sec bins |
 |
|
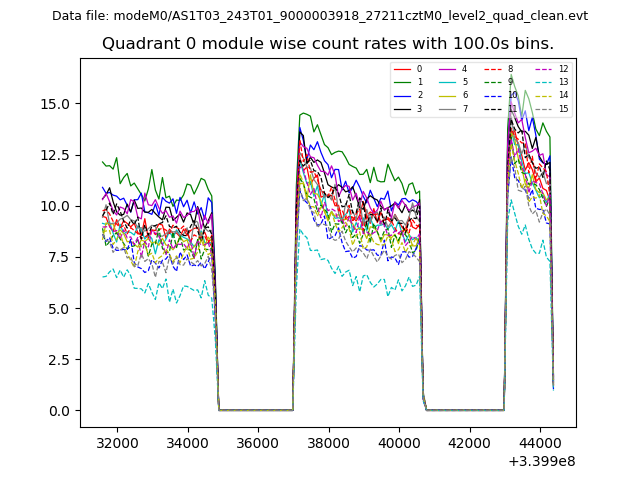
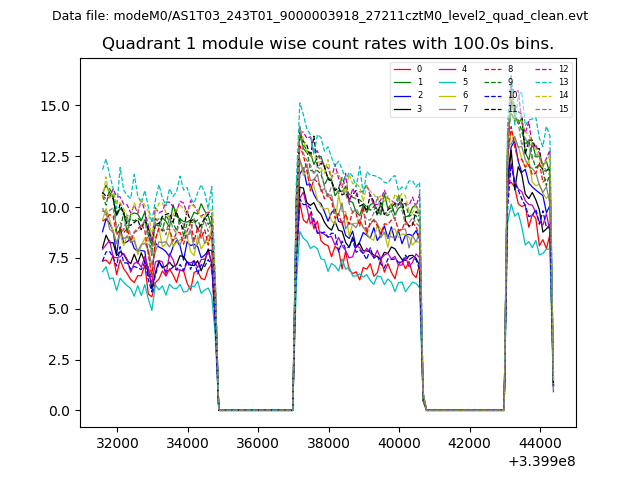
| Module-wise count rates for Quadrant A Data is divided into 100 sec bins |
 |
 |
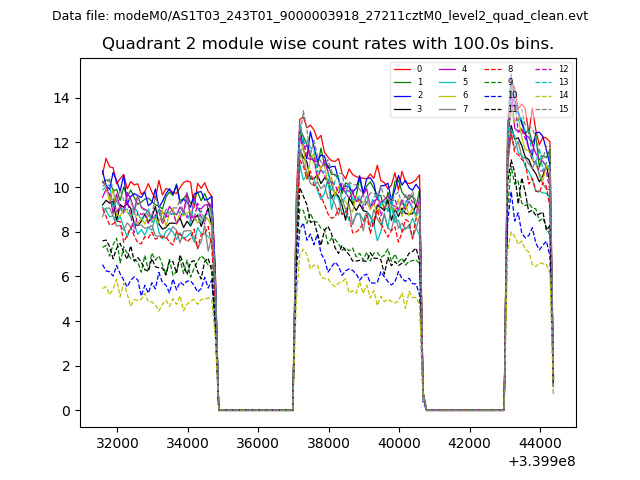
| Module-wise count rates for Quadrant B Data is divided into 100 sec bins |
 |
 |
| Module-wise count rates for Quadrant C Data is divided into 100 sec bins |
 |
 |
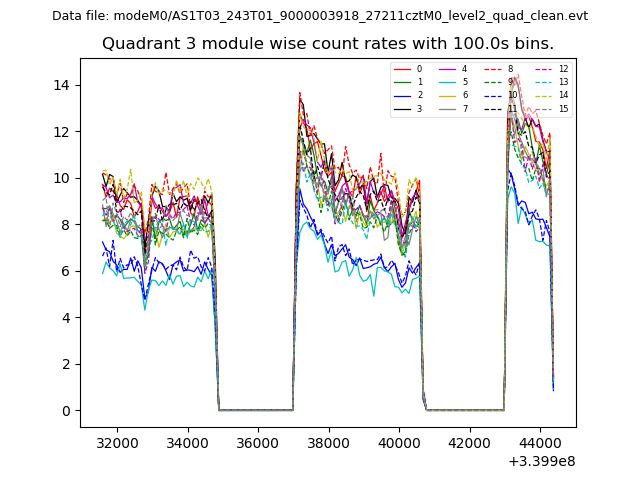
| Module-wise count rates for Quadrant D Data is divided into 100 sec bins |
 |
 |
| Parameter | Plot |
|---|---|
| CZT HV Monitor | 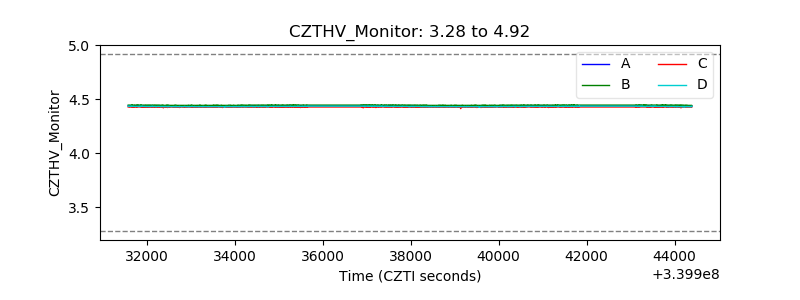 |
| D_VDD | 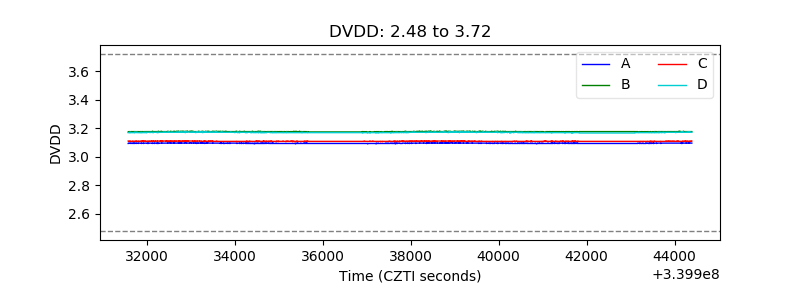 |
| Temperature 1 | 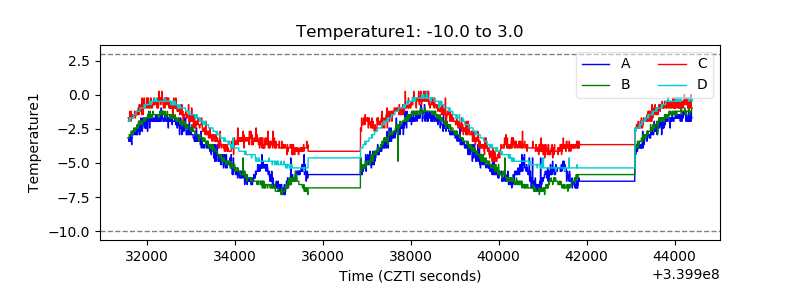 |
| Veto HV Monitor |  |
| Veto LLD | 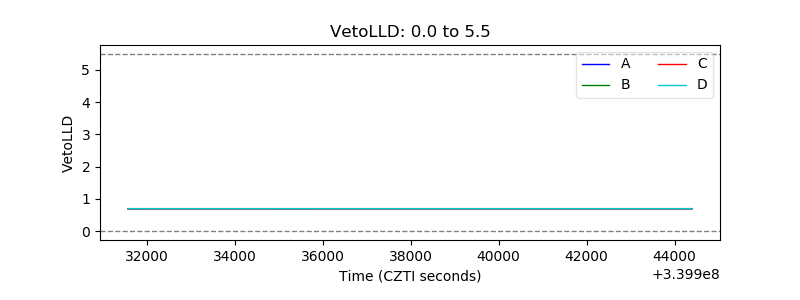 |
| Alpha Counter | 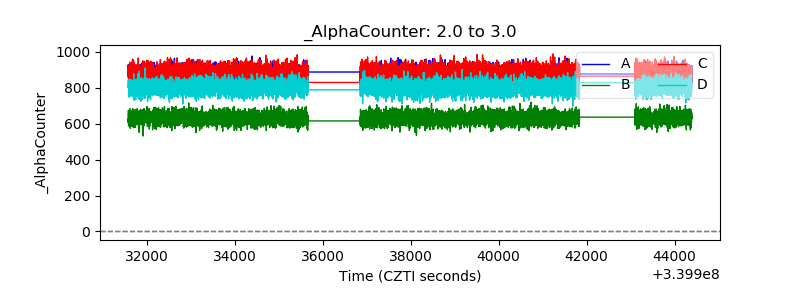 |
| _CPM_Rate | 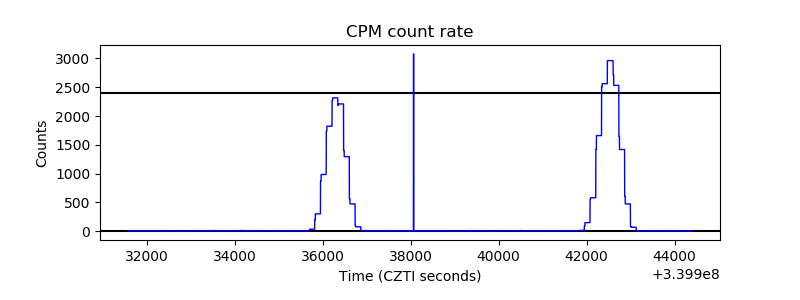 |
| CZT Counter |  |
| +2.5 Volts monitor |  |
| +5 Volts monitor |  |
| _ROLL_ROT | 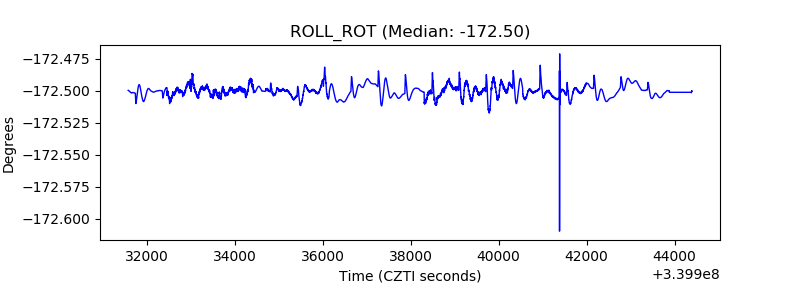 |
| _Roll_DEC |  |
| _Roll_RA | 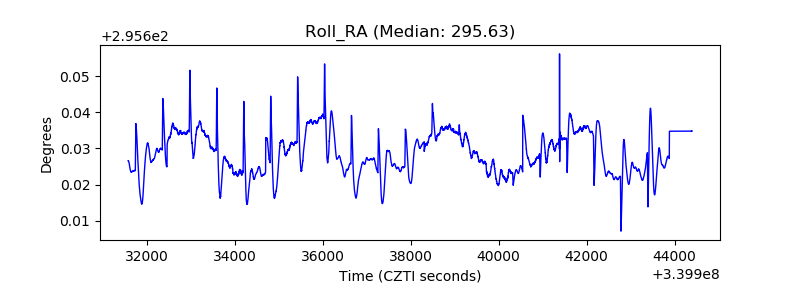 |
| Veto Counter | 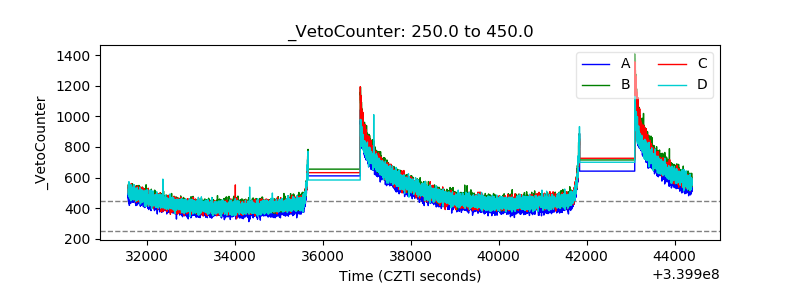 |