| Param | Original file | Final file |
|---|---|---|
| Filename | modeM0/AS1T03_243T01_9000003918_27212cztM0_level2.evt | modeM0/AS1T03_243T01_9000003918_27212cztM0_level2_quad_clean.evt |
| Size (bytes) | 529,934,400 | 110,102,400 |
| Size | 505.4 MB | 105.0 MB |
| Events in quadrant A | 3,304,534 | 764,996 |
| Events in quadrant B | 3,759,051 | 757,840 |
| Events in quadrant C | 3,212,314 | 712,435 |
| Events in quadrant D | 5,363,162 | 676,693 |
| Mode M9 | |||
|---|---|---|---|
| Quadrant | BADHDUFLAG | Total packets | Discarded packets |
| A | 0 | 13 | 0 |
| B | 0 | 13 | 0 |
| C | 0 | 13 | 0 |
| D | 0 | 13 | 0 |
| Mode M0 | |||
|---|---|---|---|
| Quadrant | BADHDUFLAG | Total packets | Discarded packets |
| A | 0 | 13626 | 0 |
| B | 0 | 15054 | 0 |
| C | 0 | 13302 | 0 |
| D | 0 | 20077 | 0 |
| Quadrant | Total seconds | Saturated seconds | Saturation percentage |
|---|---|---|---|
| A | 6049 | 85 | 1.405191% |
| B | 6049 | 189 | 3.124483% |
| C | 6048 | 92 | 1.521164% |
| D | 6048 | 544 | 8.994709% |
Noise dominated data is calculated using 1-second bins in cleaned event files. If a bin has >2000 counts, and if more than 50% of those come from <1% of pixels, then it is considered to be noise-dominated and hence unusable.
| Quadrant | # 1 sec bins | Bins with >0 counts | Bins with >2000 counts | High rate bins dominated by noise | Noise dominated (total time) | Noise dominated (detector-on time) | Marked lightcurve |
|---|---|---|---|---|---|---|---|
| A | 7394 | 6050 | 3 | 3 | 0.04% | 0.05% | 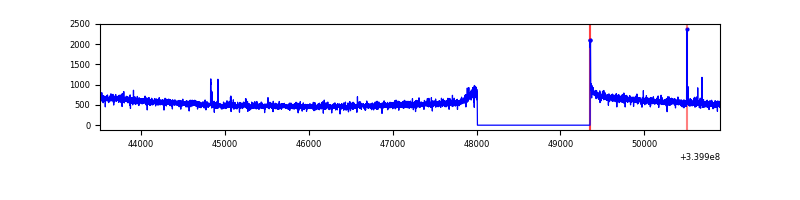 |
| B | 7394 | 6050 | 55 | 55 | 0.74% | 0.91% | 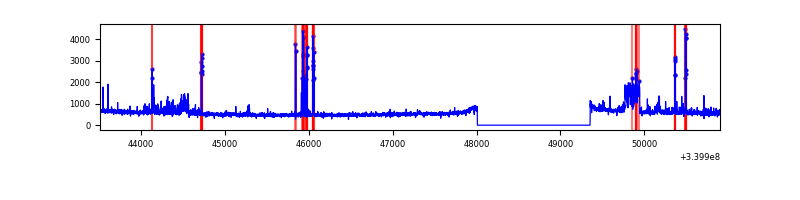 |
| C | 7393 | 6049 | 0 | 0 | 0.00% | 0.00% | 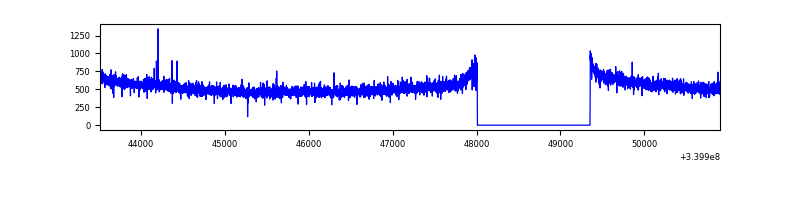 |
| D | 7393 | 6049 | 402 | 402 | 5.44% | 6.65% | 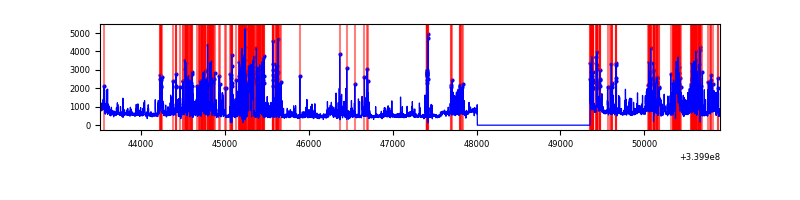 |
Top three noisy pixels from each quadrant. If the there are fewer than three noisy pixels in the level2.evt file, extra rows are filled as -1
| Pixel properties | Quadrant properties | ||||||
|---|---|---|---|---|---|---|---|
| Quadrant | DetID | PixID | Counts | Sigma | Mean | Median | Sigma |
| A | 13 | 248 | 10805 | 59.6 | 849 | 838 | 167.2 |
| A | 13 | 254 | 10211 | 56.05 | 849 | 838 | 167.2 |
| A | 0 | 13 | 8946 | 48.48 | 849 | 838 | 167.2 |
| B | 3 | 64 | 421809 | 2732.49 | 829 | 813 | 154.1 |
| B | 15 | 33 | 66733 | 427.86 | 829 | 813 | 154.1 |
| B | 12 | 111 | 17577 | 108.81 | 829 | 813 | 154.1 |
| C | 14 | 238 | 131507 | 717.0 | 788 | 792 | 182.3 |
| C | 13 | 61 | 5395 | 25.25 | 788 | 792 | 182.3 |
| C | 15 | 208 | 5212 | 24.24 | 788 | 792 | 182.3 |
| D | 1 | 52 | 1806357 | 9435.33 | 783 | 767 | 191.4 |
| D | 2 | 250 | 338797 | 1766.42 | 783 | 767 | 191.4 |
| D | 12 | 17 | 129886 | 674.73 | 783 | 767 | 191.4 |
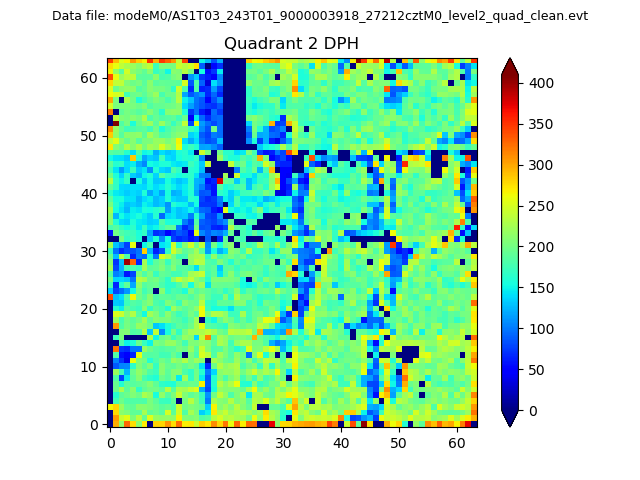
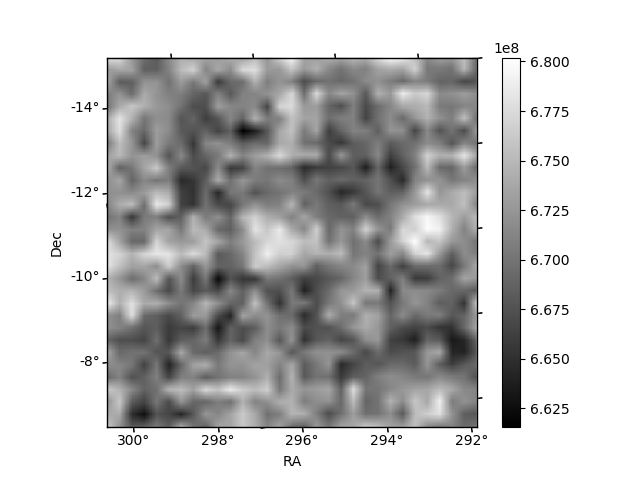
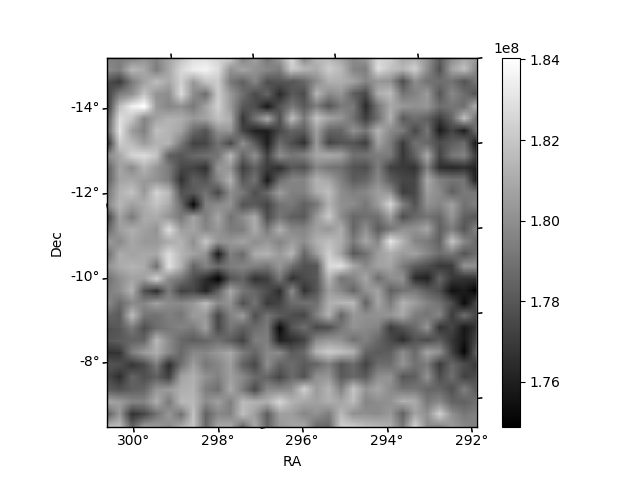
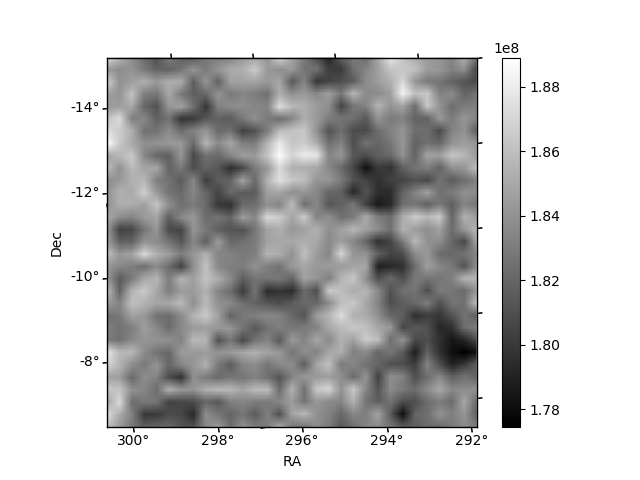
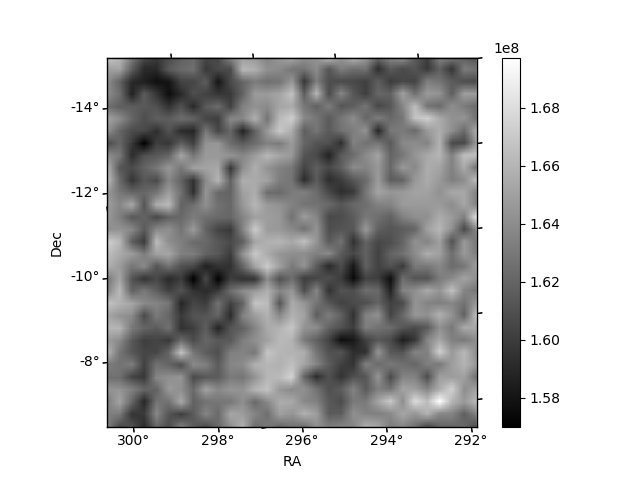
Histogram calculated using DETX and DETY for each event in the final _common_clean file
| Quadrant A | 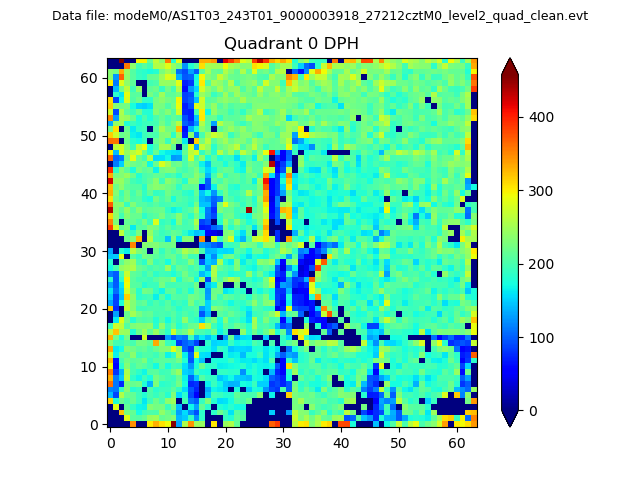 |
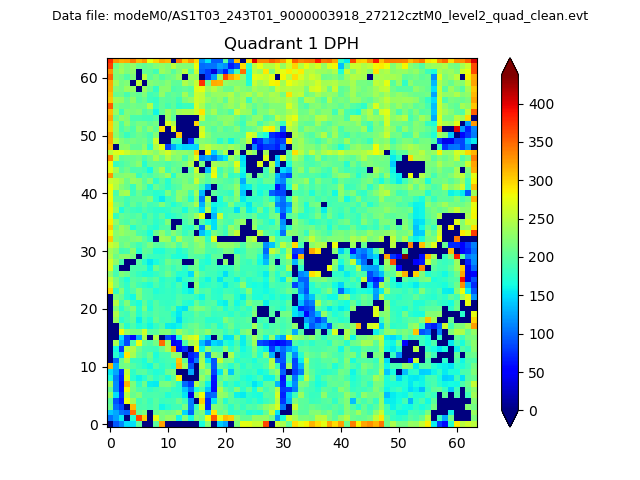 |
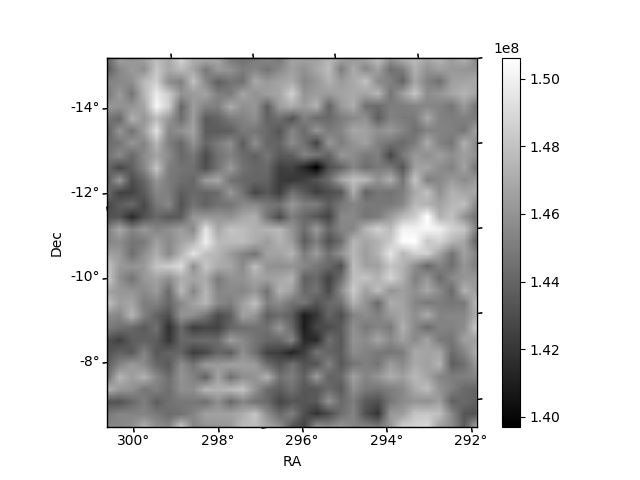
Quadrant B |
|---|---|---|---|
| Quadrant D | 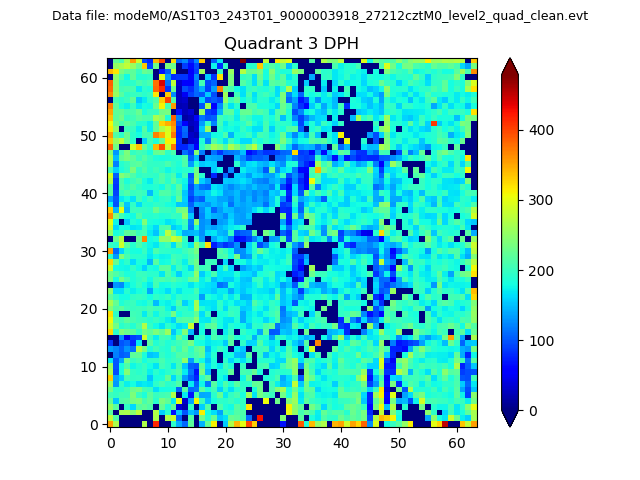 |
 |
Quadrant C |
| Plot type | Count rate plots | Images |
|---|---|---|
| Comparison with Poisson distribution Blue bars denote a histogram of data divided into 1 sec bins. Red curve is a Poisson curve with rate = median count rate of data. |
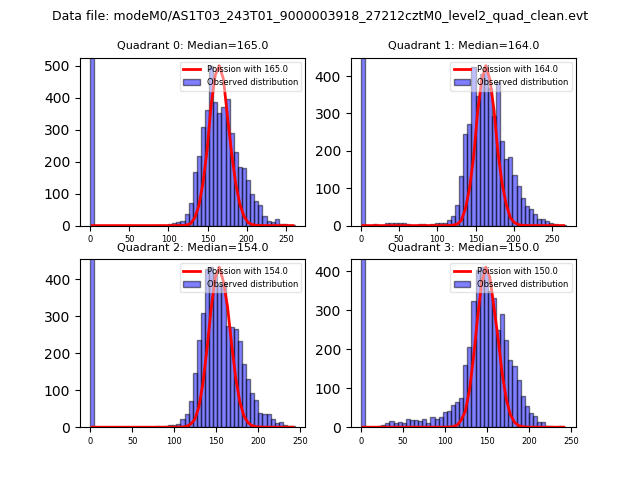 |
 |
| Quadrant-wise count rates Data is divided into 100 sec bins |
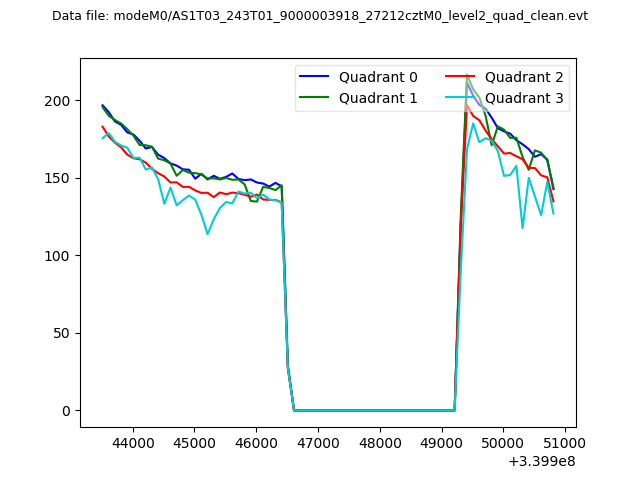 |
|
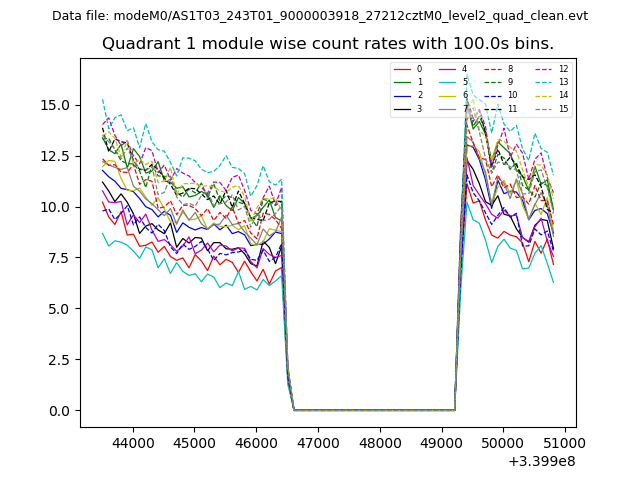
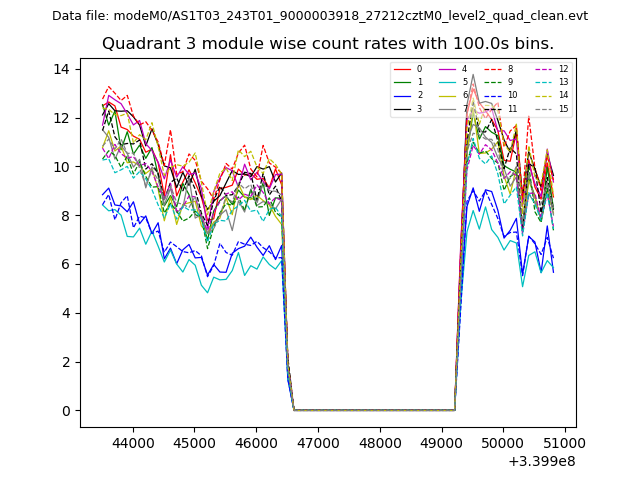
| Module-wise count rates for Quadrant A Data is divided into 100 sec bins |
 |
 |
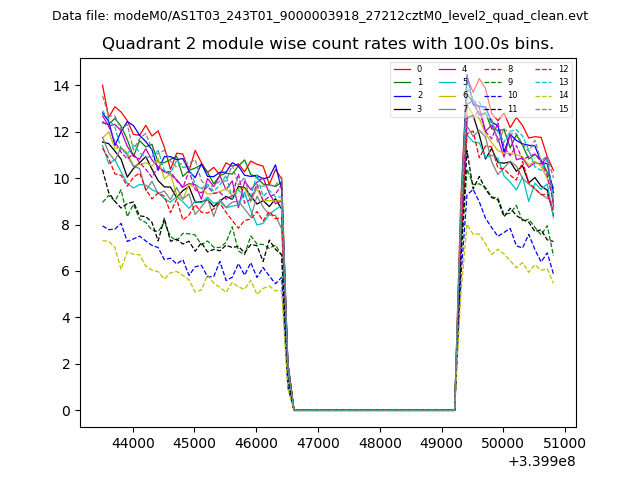
| Module-wise count rates for Quadrant B Data is divided into 100 sec bins |
 |
 |
| Module-wise count rates for Quadrant C Data is divided into 100 sec bins |
 |
 |
| Module-wise count rates for Quadrant D Data is divided into 100 sec bins |
 |
 |
| Parameter | Plot |
|---|---|
| CZT HV Monitor | 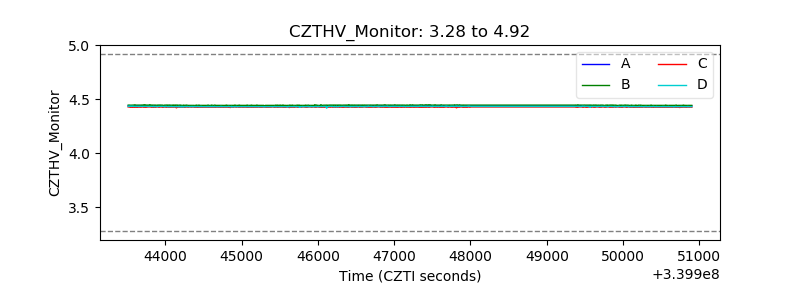 |
| D_VDD | 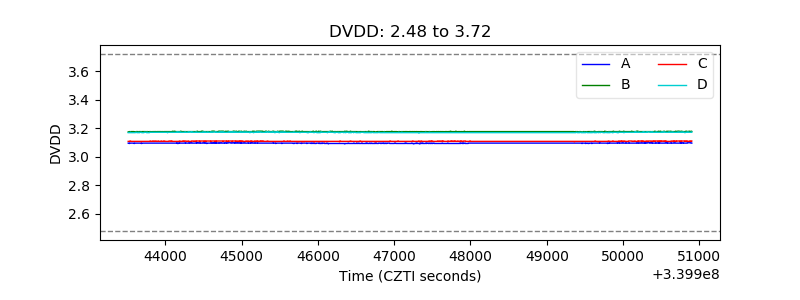 |
| Temperature 1 | 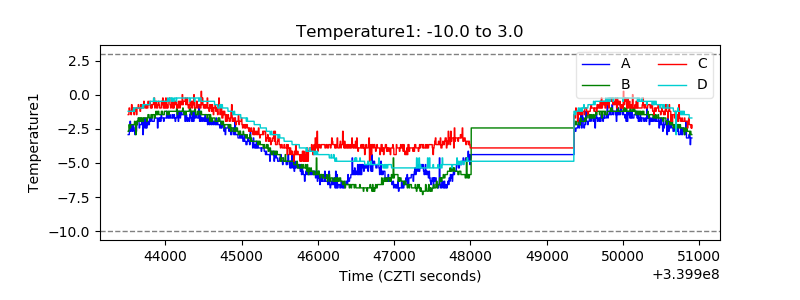 |
| Veto HV Monitor | 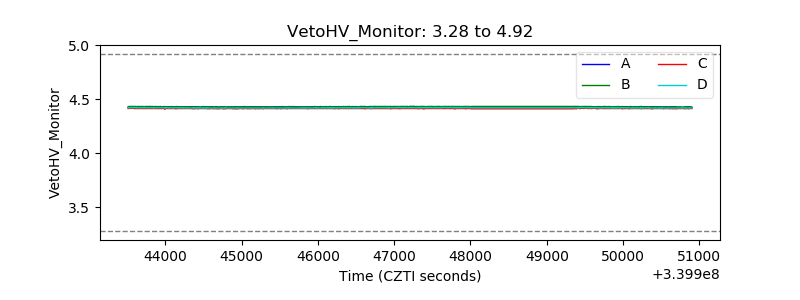 |
| Veto LLD | 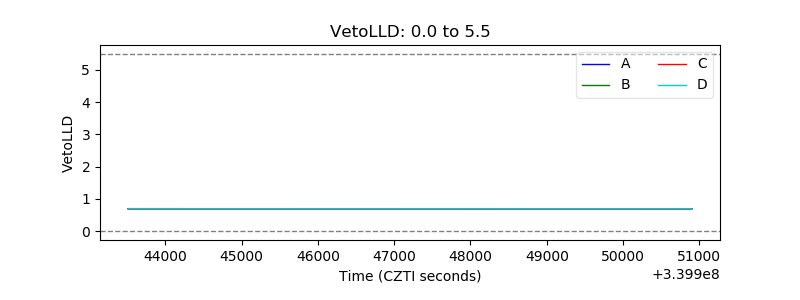 |
| Alpha Counter | 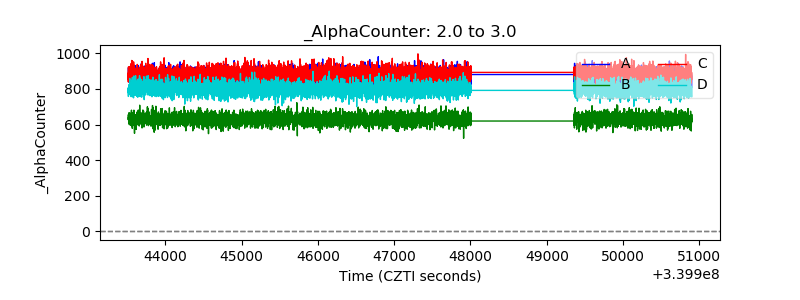 |
| _CPM_Rate | 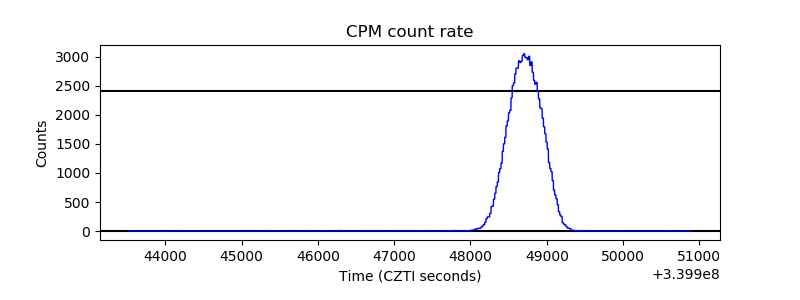 |
| CZT Counter | 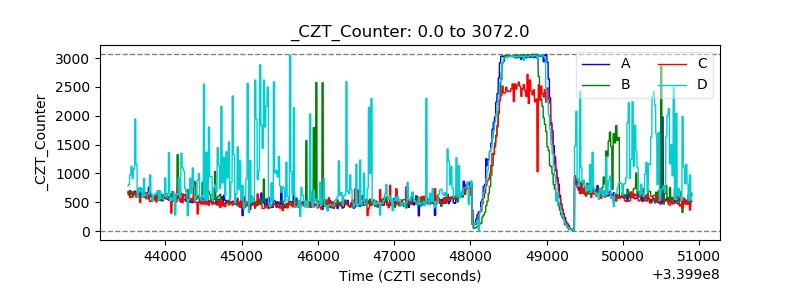 |
| +2.5 Volts monitor |  |
| +5 Volts monitor | 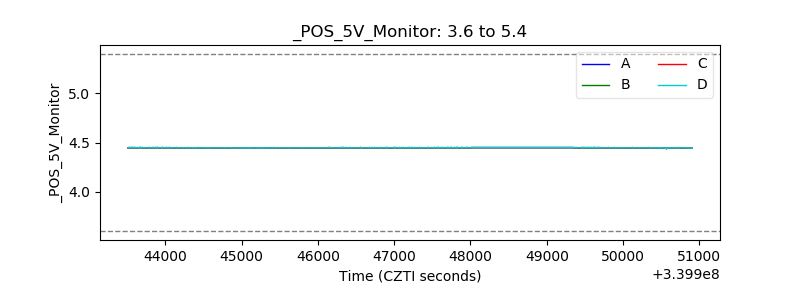 |
| _ROLL_ROT | 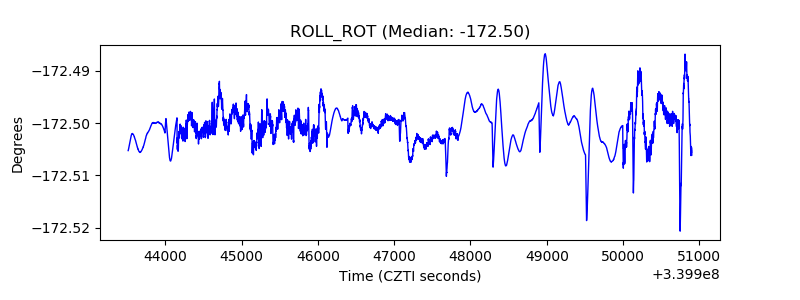 |
| _Roll_DEC | 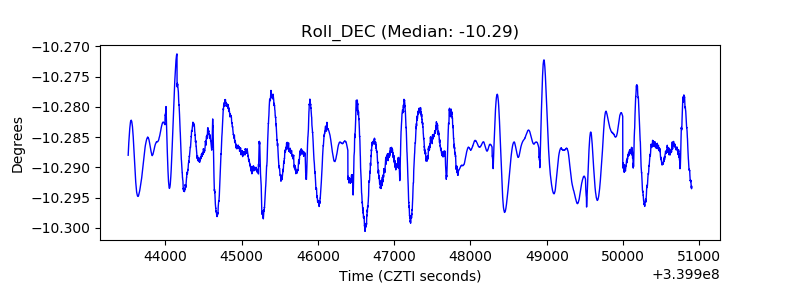 |
| _Roll_RA | 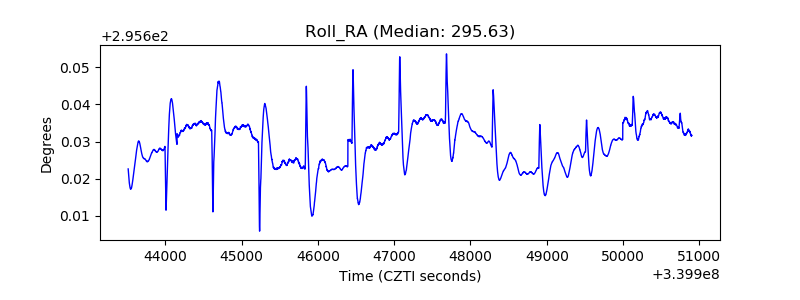 |
| Veto Counter | 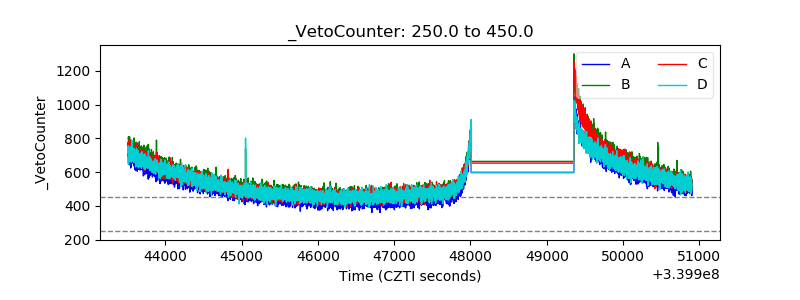 |