| Param | Original file | Final file |
|---|---|---|
| Filename | modeM0/AS1T03_243T01_9000003918_27213cztM0_level2.evt | modeM0/AS1T03_243T01_9000003918_27213cztM0_level2_quad_clean.evt |
| Size (bytes) | 554,702,400 | 103,910,400 |
| Size | 529.0 MB | 99.1 MB |
| Events in quadrant A | 3,344,287 | 714,017 |
| Events in quadrant B | 3,954,010 | 717,131 |
| Events in quadrant C | 3,269,856 | 672,852 |
| Events in quadrant D | 5,811,997 | 610,860 |
| Mode M9 | |||
|---|---|---|---|
| Quadrant | BADHDUFLAG | Total packets | Discarded packets |
| A | 0 | 14 | 0 |
| B | 0 | 14 | 0 |
| C | 0 | 14 | 0 |
| D | 0 | 14 | 0 |
| Mode M0 | |||
|---|---|---|---|
| Quadrant | BADHDUFLAG | Total packets | Discarded packets |
| A | 0 | 13801 | 0 |
| B | 0 | 15673 | 0 |
| C | 0 | 13517 | 0 |
| D | 0 | 21541 | 0 |
| Quadrant | Total seconds | Saturated seconds | Saturation percentage |
|---|---|---|---|
| A | 6193 | 84 | 1.356370% |
| B | 6193 | 258 | 4.165994% |
| C | 6193 | 89 | 1.437106% |
| D | 6194 | 631 | 10.187278% |
Noise dominated data is calculated using 1-second bins in cleaned event files. If a bin has >2000 counts, and if more than 50% of those come from <1% of pixels, then it is considered to be noise-dominated and hence unusable.
| Quadrant | # 1 sec bins | Bins with >0 counts | Bins with >2000 counts | High rate bins dominated by noise | Noise dominated (total time) | Noise dominated (detector-on time) | Marked lightcurve |
|---|---|---|---|---|---|---|---|
| A | 7553 | 6194 | 2 | 2 | 0.03% | 0.03% | 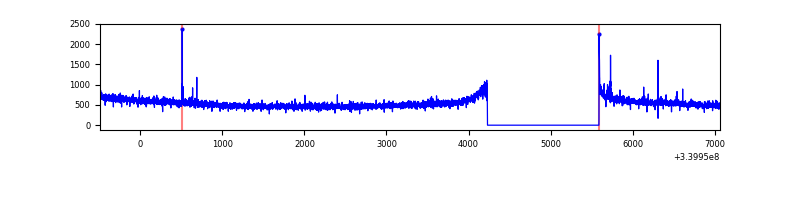 |
| B | 7553 | 6194 | 104 | 104 | 1.38% | 1.68% | 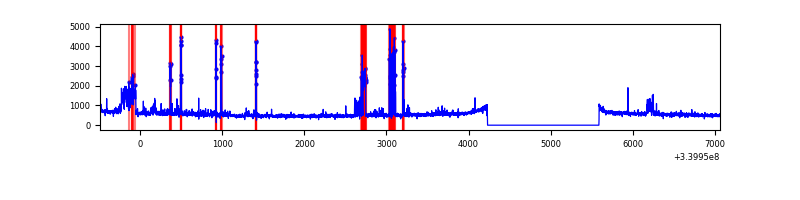 |
| C | 7553 | 6194 | 0 | 0 | 0.00% | 0.00% | 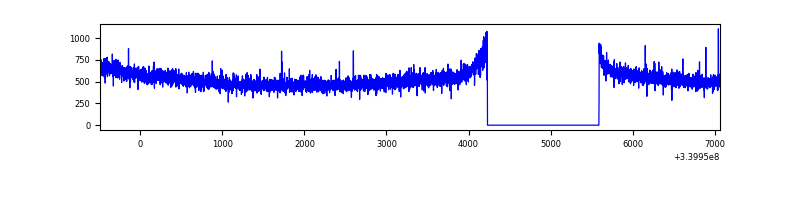 |
| D | 7554 | 6195 | 443 | 443 | 5.86% | 7.15% | 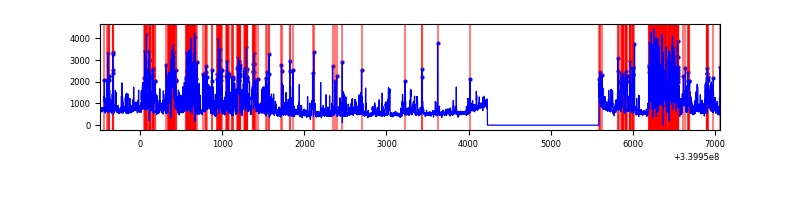 |
Top three noisy pixels from each quadrant. If the there are fewer than three noisy pixels in the level2.evt file, extra rows are filled as -1
| Pixel properties | Quadrant properties | ||||||
|---|---|---|---|---|---|---|---|
| Quadrant | DetID | PixID | Counts | Sigma | Mean | Median | Sigma |
| A | 2 | 79 | 17536 | 97.94 | 859 | 846 | 170.4 |
| A | 13 | 254 | 10717 | 57.92 | 859 | 846 | 170.4 |
| A | 13 | 248 | 8853 | 46.98 | 859 | 846 | 170.4 |
| B | 3 | 64 | 591705 | 3780.54 | 838 | 820 | 156.3 |
| B | 15 | 33 | 56383 | 355.5 | 838 | 820 | 156.3 |
| B | 12 | 111 | 17849 | 108.95 | 838 | 820 | 156.3 |
| C | 14 | 238 | 132501 | 709.46 | 802 | 808 | 185.6 |
| C | 15 | 208 | 6229 | 29.2 | 802 | 808 | 185.6 |
| C | 13 | 61 | 5543 | 25.51 | 802 | 808 | 185.6 |
| D | 1 | 52 | 1772168 | 9156.13 | 779 | 761 | 193.5 |
| D | 12 | 17 | 683344 | 3528.17 | 779 | 761 | 193.5 |
| D | 2 | 250 | 329381 | 1698.59 | 779 | 761 | 193.5 |
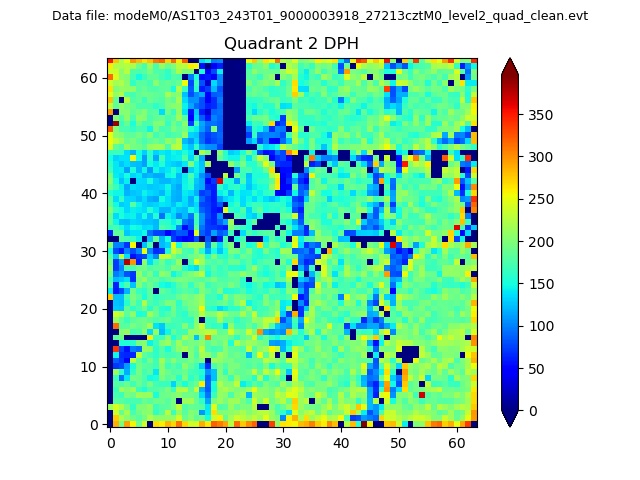
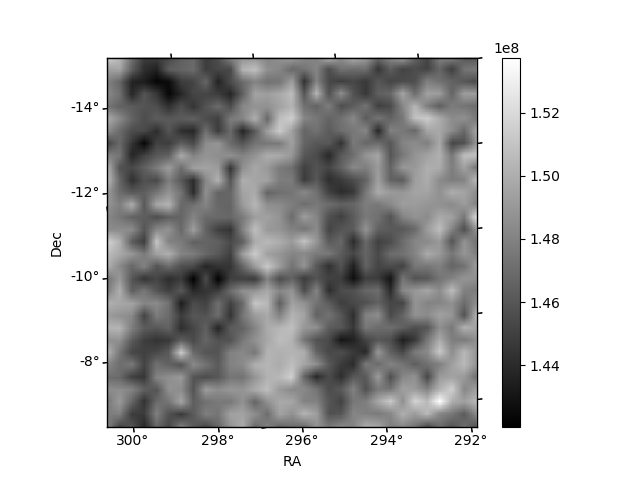
Histogram calculated using DETX and DETY for each event in the final _common_clean file
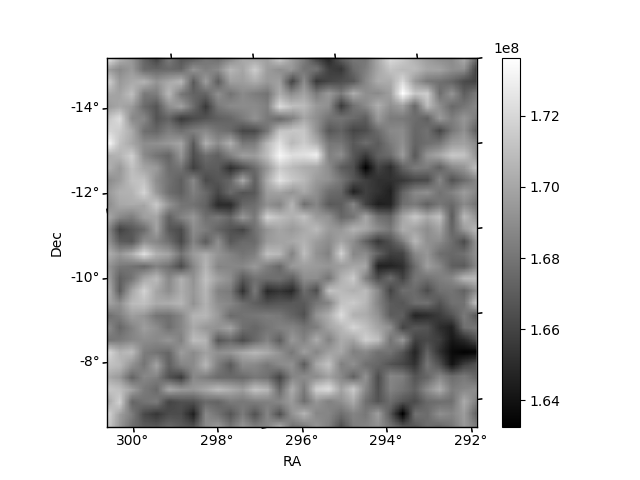
| Quadrant A | 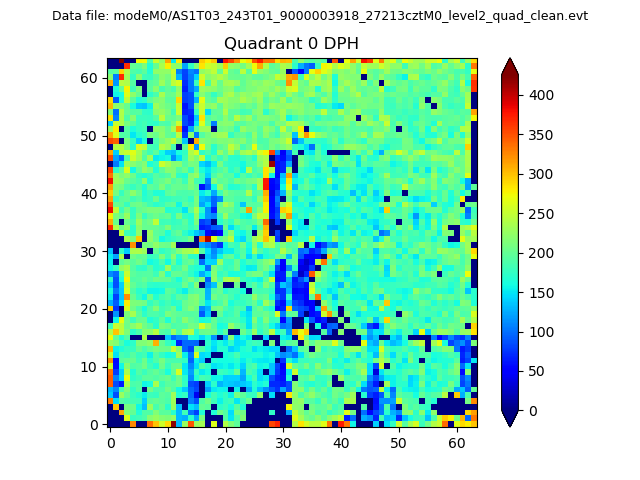 |
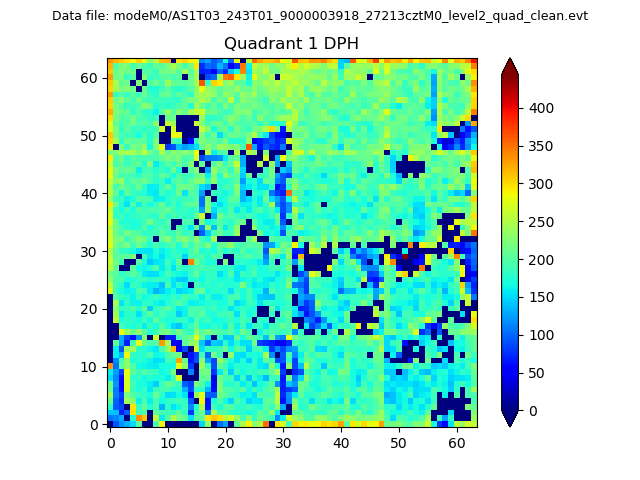 |
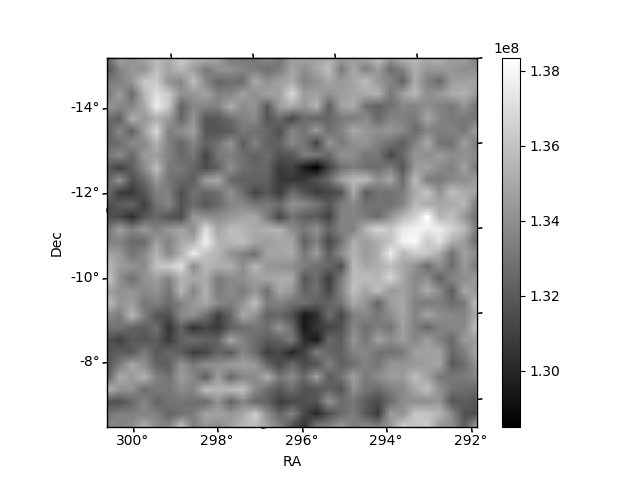
Quadrant B |
|---|---|---|---|
| Quadrant D | 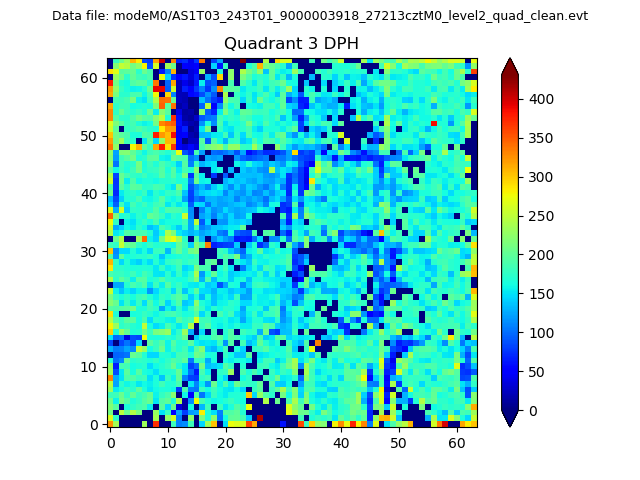 |
 |
Quadrant C |
| Plot type | Count rate plots | Images |
|---|---|---|
| Comparison with Poisson distribution Blue bars denote a histogram of data divided into 1 sec bins. Red curve is a Poisson curve with rate = median count rate of data. |
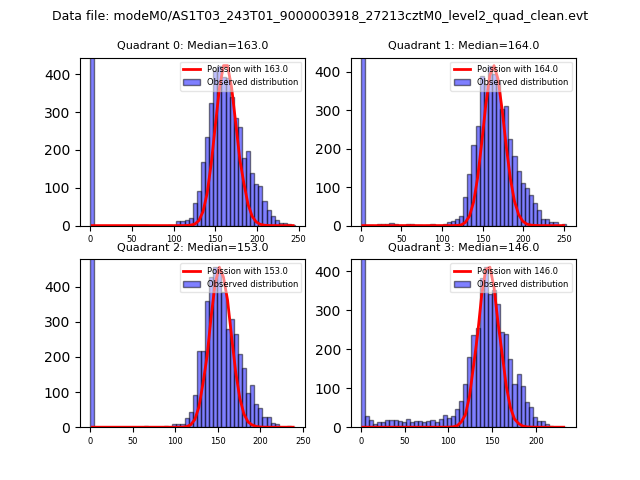 |
 |
| Quadrant-wise count rates Data is divided into 100 sec bins |
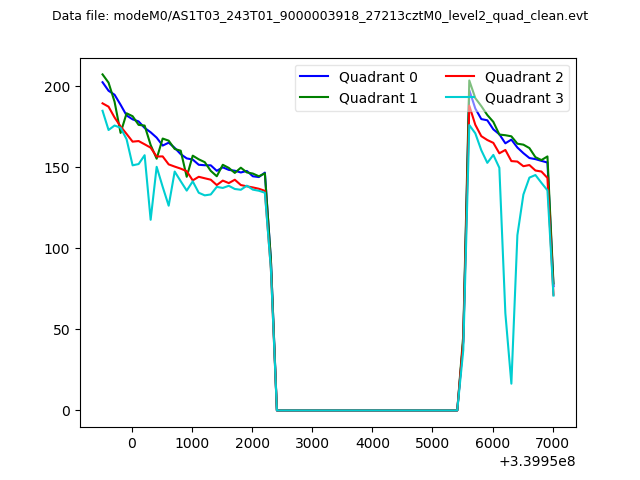 |
|
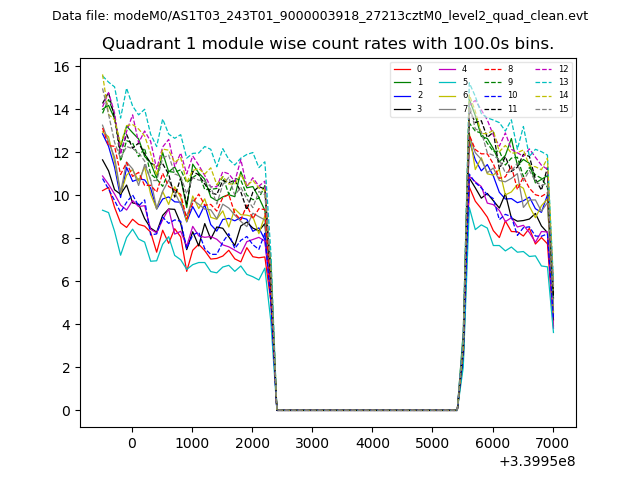
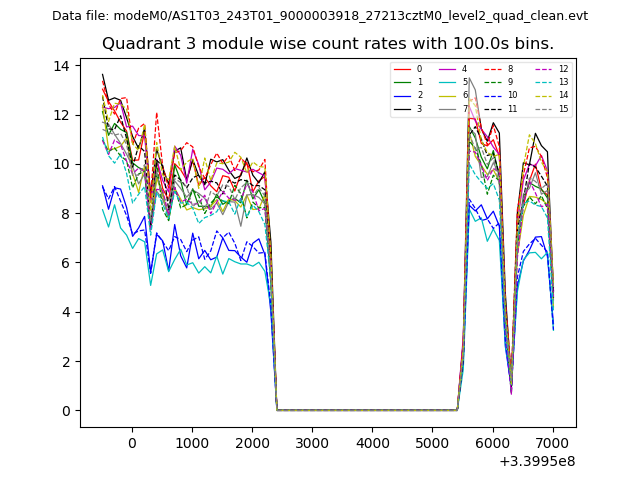
| Module-wise count rates for Quadrant A Data is divided into 100 sec bins |
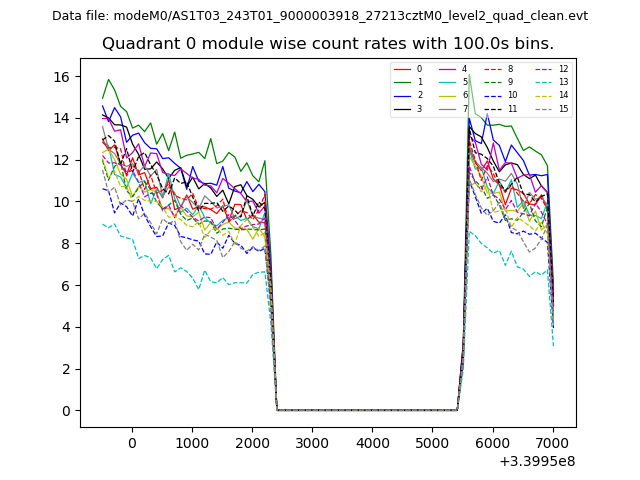 |
 |
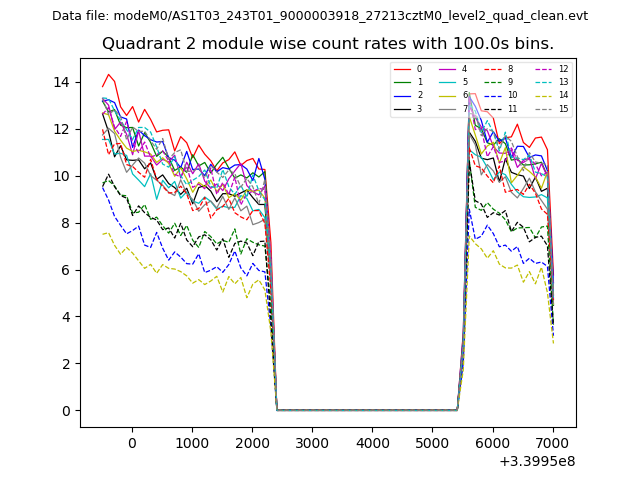
| Module-wise count rates for Quadrant B Data is divided into 100 sec bins |
 |
 |
| Module-wise count rates for Quadrant C Data is divided into 100 sec bins |
 |
 |
| Module-wise count rates for Quadrant D Data is divided into 100 sec bins |
 |
 |
| Parameter | Plot |
|---|---|
| CZT HV Monitor | 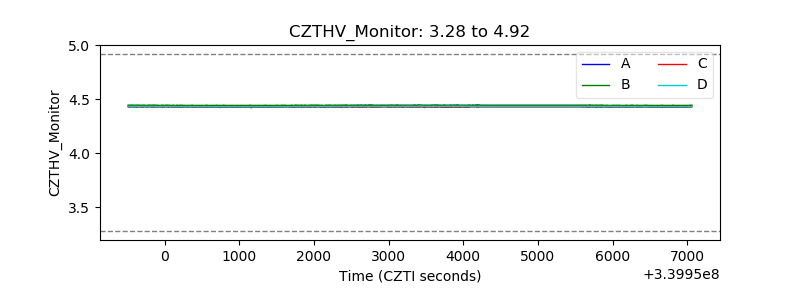 |
| D_VDD | 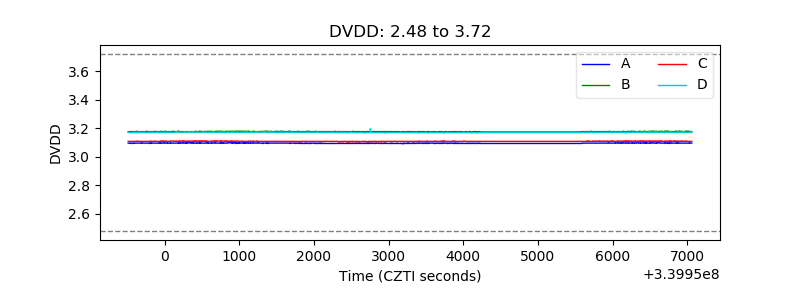 |
| Temperature 1 | 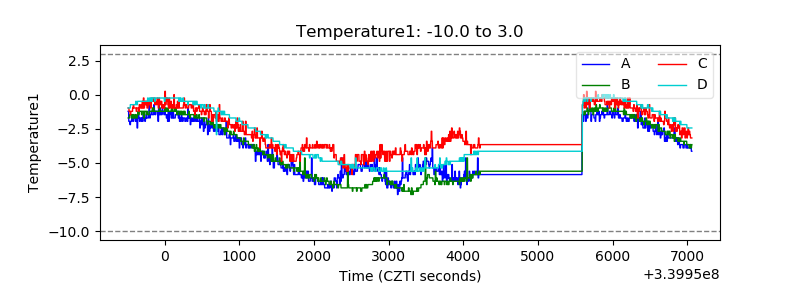 |
| Veto HV Monitor | 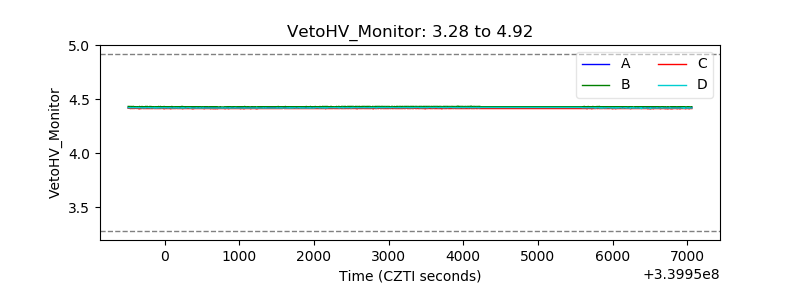 |
| Veto LLD | 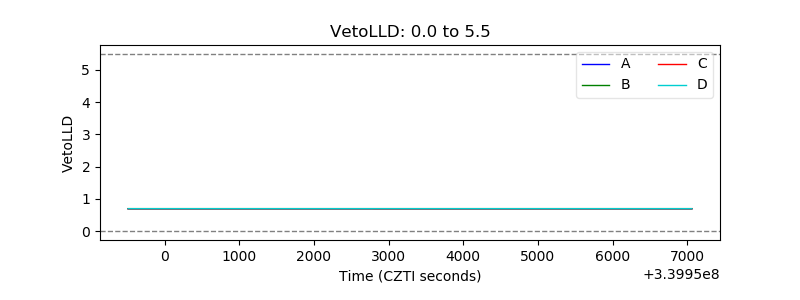 |
| Alpha Counter | 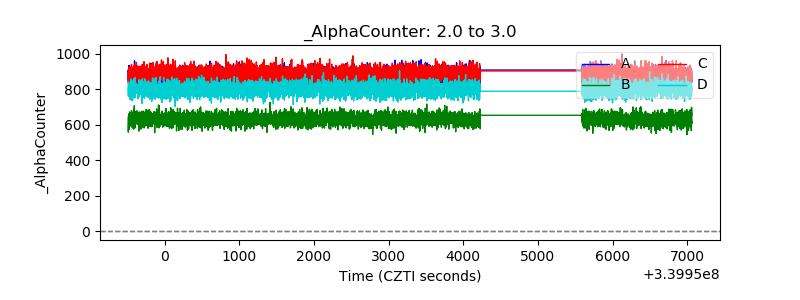 |
| _CPM_Rate | 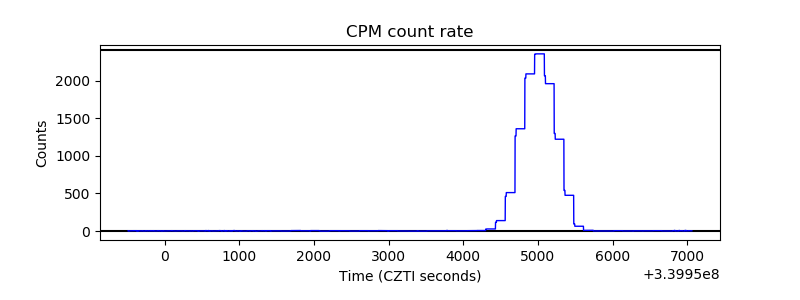 |
| CZT Counter | 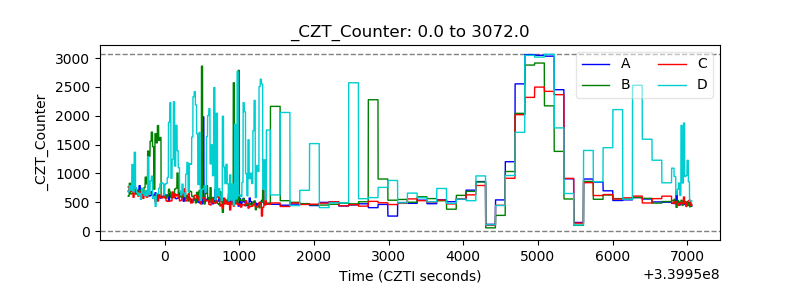 |
| +2.5 Volts monitor |  |
| +5 Volts monitor |  |
| _ROLL_ROT | 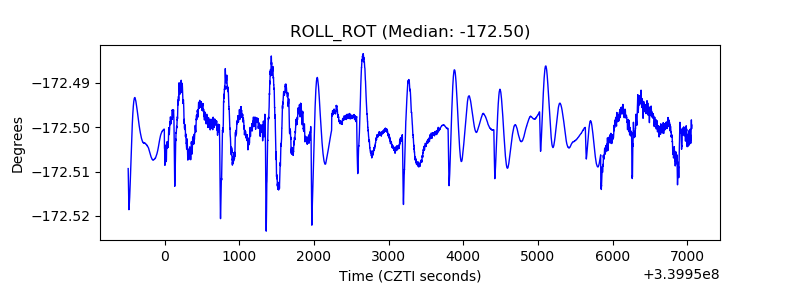 |
| _Roll_DEC | 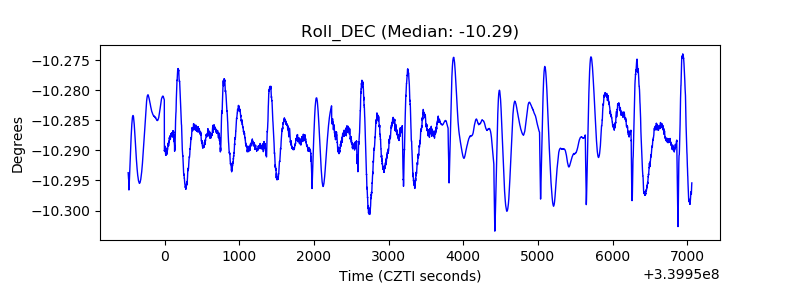 |
| _Roll_RA | 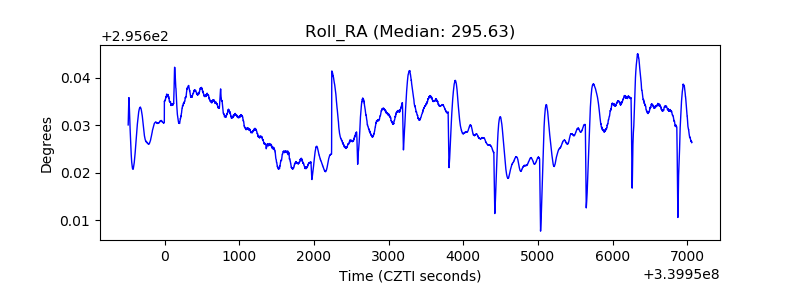 |
| Veto Counter |  |