| Param | Original file | Final file |
|---|---|---|
| Filename | modeM0/AS1T03_243T01_9000003918_27214cztM0_level2.evt | modeM0/AS1T03_243T01_9000003918_27214cztM0_level2_quad_clean.evt |
| Size (bytes) | 576,740,160 | 95,097,600 |
| Size | 550.0 MB | 90.7 MB |
| Events in quadrant A | 3,391,961 | 641,695 |
| Events in quadrant B | 3,589,550 | 653,170 |
| Events in quadrant C | 3,309,187 | 610,656 |
| Events in quadrant D | 6,740,558 | 525,719 |
| Mode M9 | |||
|---|---|---|---|
| Quadrant | BADHDUFLAG | Total packets | Discarded packets |
| A | 0 | 13 | 0 |
| B | 0 | 14 | 0 |
| C | 0 | 14 | 0 |
| D | 0 | 14 | 0 |
| Mode M0 | |||
|---|---|---|---|
| Quadrant | BADHDUFLAG | Total packets | Discarded packets |
| A | 0 | 14108 | 0 |
| B | 0 | 14612 | 0 |
| C | 0 | 13795 | 0 |
| D | 0 | 24391 | 0 |
| Quadrant | Total seconds | Saturated seconds | Saturation percentage |
|---|---|---|---|
| A | 6427 | 93 | 1.447020% |
| B | 6426 | 175 | 2.723312% |
| C | 6426 | 117 | 1.820728% |
| D | 6426 | 971 | 15.110489% |
Noise dominated data is calculated using 1-second bins in cleaned event files. If a bin has >2000 counts, and if more than 50% of those come from <1% of pixels, then it is considered to be noise-dominated and hence unusable.
| Quadrant | # 1 sec bins | Bins with >0 counts | Bins with >2000 counts | High rate bins dominated by noise | Noise dominated (total time) | Noise dominated (detector-on time) | Marked lightcurve |
|---|---|---|---|---|---|---|---|
| A | 7697 | 6429 | 1 | 1 | 0.01% | 0.02% | 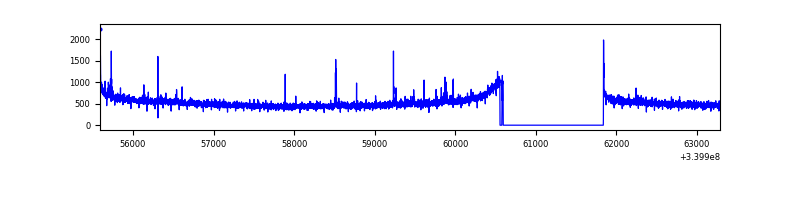 |
| B | 7696 | 6428 | 52 | 52 | 0.68% | 0.81% | 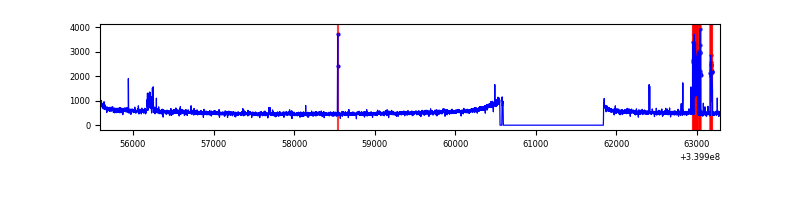 |
| C | 7696 | 6428 | 0 | 0 | 0.00% | 0.00% | 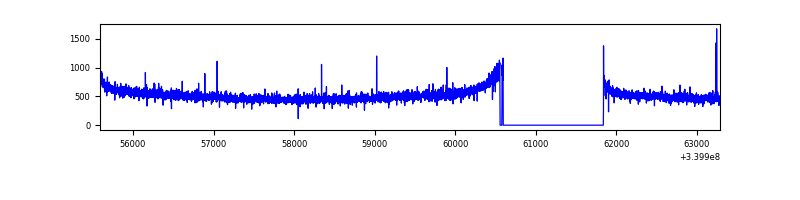 |
| D | 7696 | 6428 | 754 | 754 | 9.80% | 11.73% | 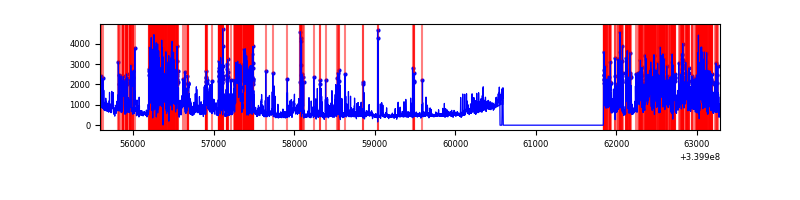 |
Top three noisy pixels from each quadrant. If the there are fewer than three noisy pixels in the level2.evt file, extra rows are filled as -1
| Pixel properties | Quadrant properties | ||||||
|---|---|---|---|---|---|---|---|
| Quadrant | DetID | PixID | Counts | Sigma | Mean | Median | Sigma |
| A | 14 | 235 | 38803 | 221.32 | 861 | 847 | 171.5 |
| A | 2 | 79 | 17718 | 98.37 | 861 | 847 | 171.5 |
| A | 8 | 192 | 12034 | 65.23 | 861 | 847 | 171.5 |
| B | 3 | 64 | 172394 | 1062.65 | 855 | 836 | 161.4 |
| B | 15 | 33 | 43761 | 265.88 | 855 | 836 | 161.4 |
| B | 12 | 111 | 18727 | 110.82 | 855 | 836 | 161.4 |
| C | 14 | 238 | 132451 | 692.67 | 812 | 817 | 190.0 |
| C | 15 | 208 | 11282 | 55.07 | 812 | 817 | 190.0 |
| C | 13 | 61 | 5499 | 24.64 | 812 | 817 | 190.0 |
| D | 1 | 52 | 2556121 | 13115.79 | 770 | 753 | 194.8 |
| D | 12 | 17 | 738171 | 3784.9 | 770 | 753 | 194.8 |
| D | 12 | 233 | 203128 | 1038.72 | 770 | 753 | 194.8 |
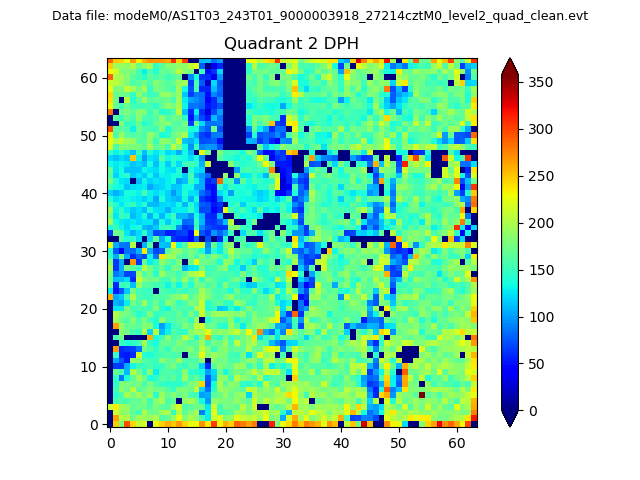
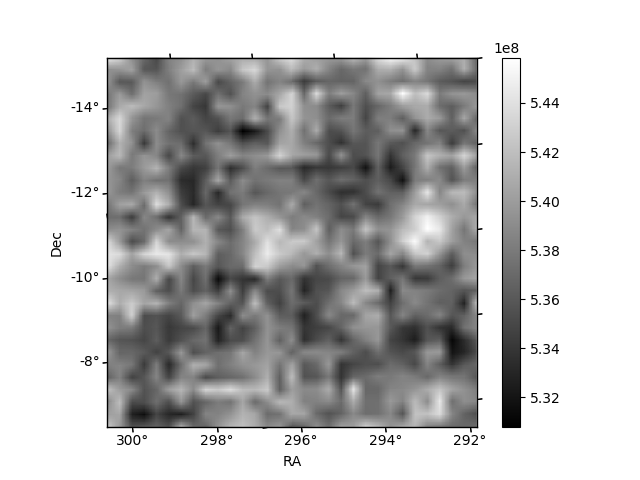
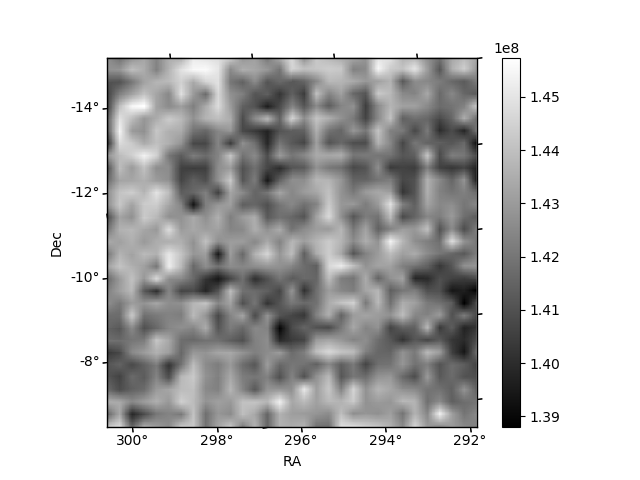
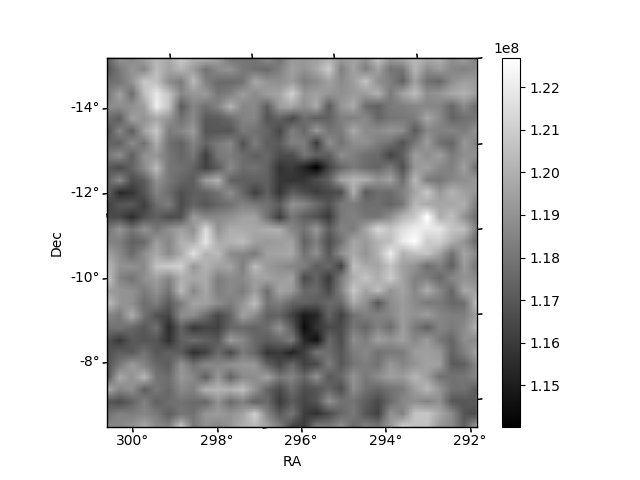
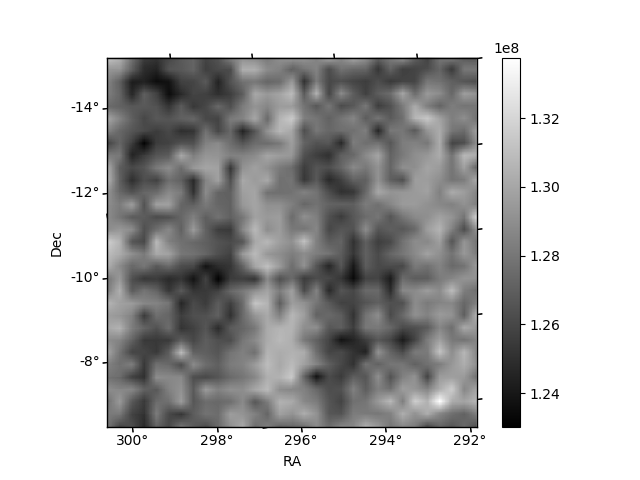
Histogram calculated using DETX and DETY for each event in the final _common_clean file
| Quadrant A | 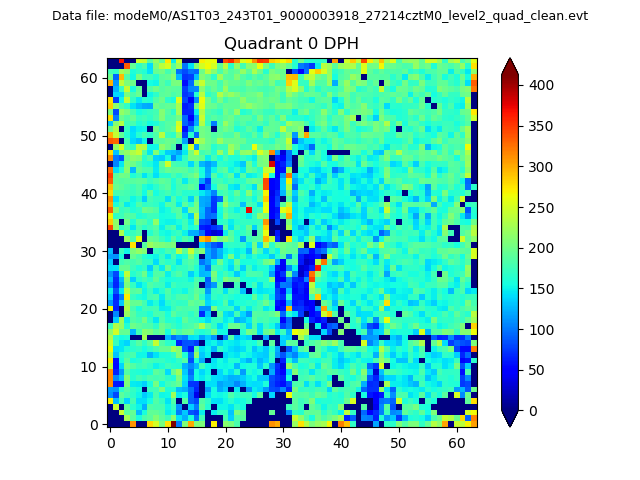 |
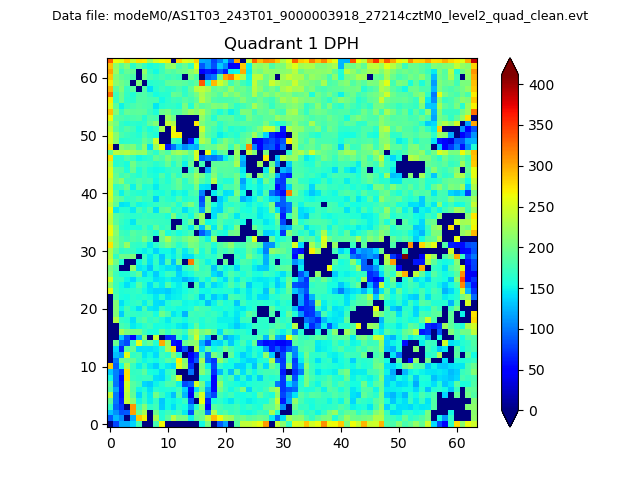 |
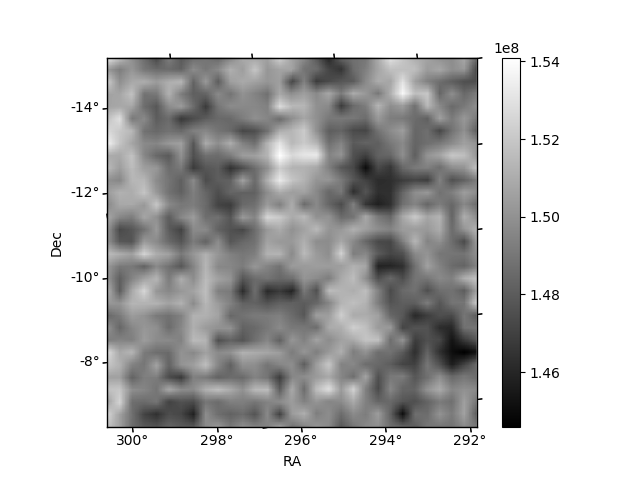
Quadrant B |
|---|---|---|---|
| Quadrant D | 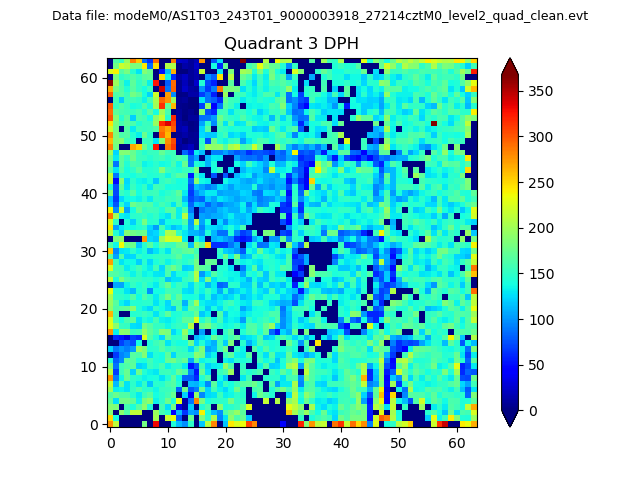 |
 |
Quadrant C |
| Plot type | Count rate plots | Images |
|---|---|---|
| Comparison with Poisson distribution Blue bars denote a histogram of data divided into 1 sec bins. Red curve is a Poisson curve with rate = median count rate of data. |
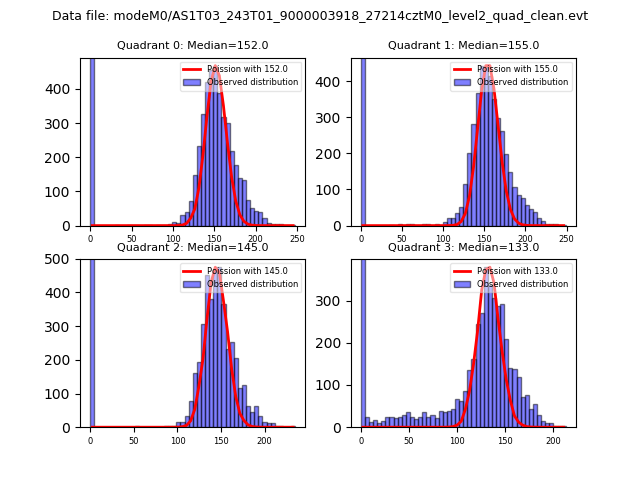 |
 |
| Quadrant-wise count rates Data is divided into 100 sec bins |
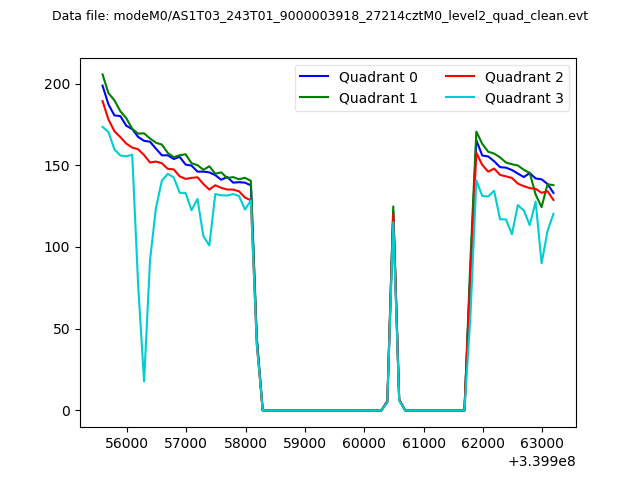 |
|
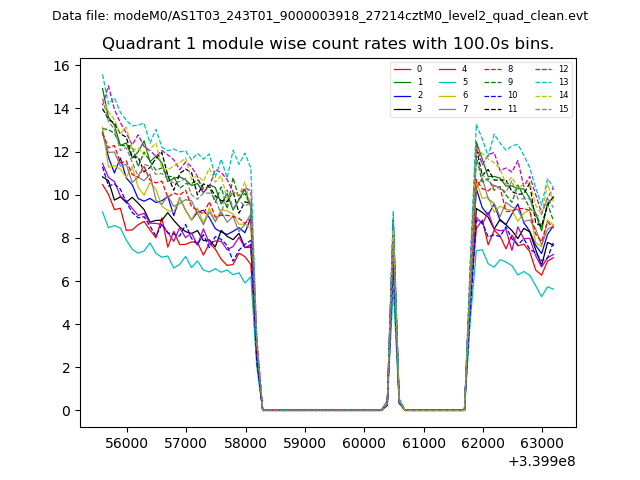
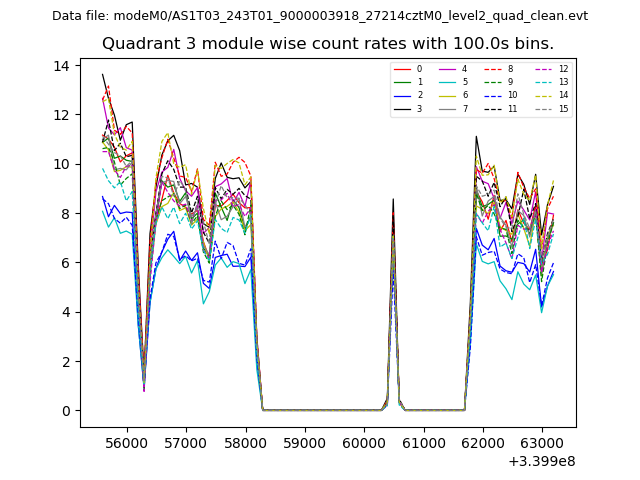
| Module-wise count rates for Quadrant A Data is divided into 100 sec bins |
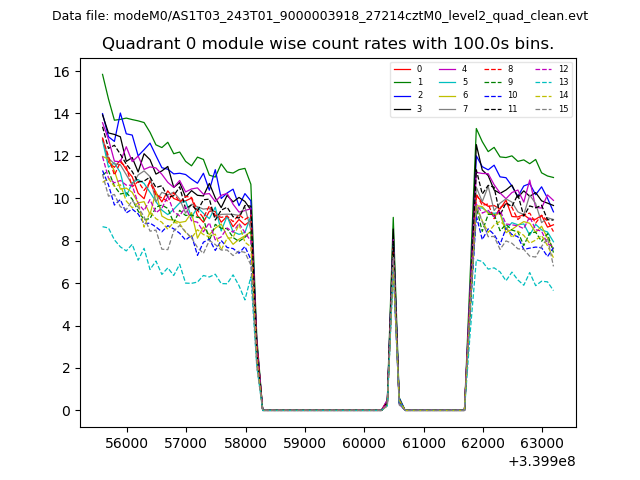 |
 |
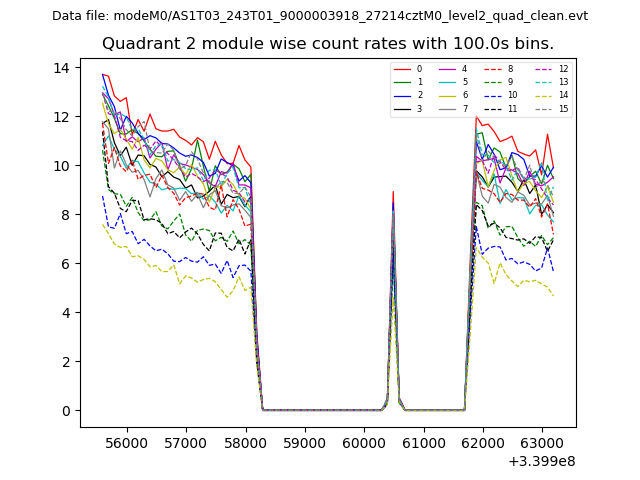
| Module-wise count rates for Quadrant B Data is divided into 100 sec bins |
 |
 |
| Module-wise count rates for Quadrant C Data is divided into 100 sec bins |
 |
 |
| Module-wise count rates for Quadrant D Data is divided into 100 sec bins |
 |
 |
| Parameter | Plot |
|---|---|
| CZT HV Monitor | 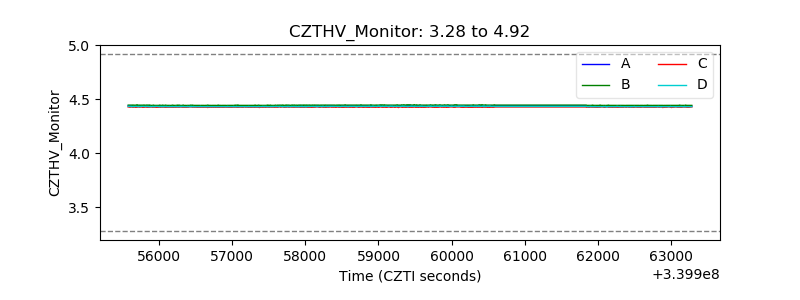 |
| D_VDD | 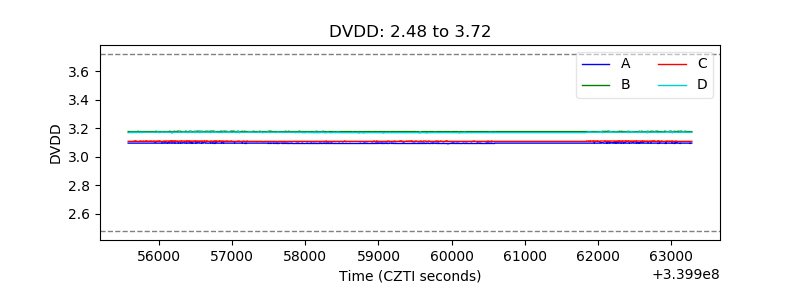 |
| Temperature 1 | 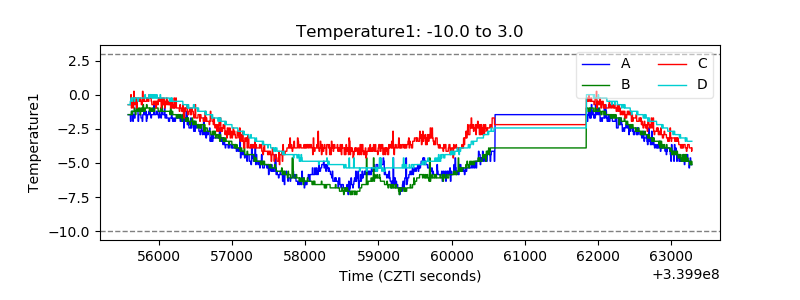 |
| Veto HV Monitor |  |
| Veto LLD | 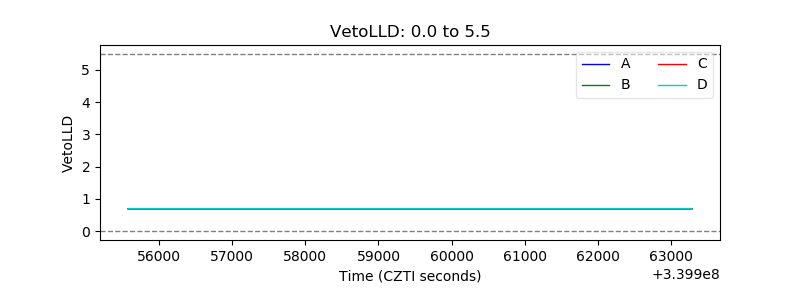 |
| Alpha Counter | 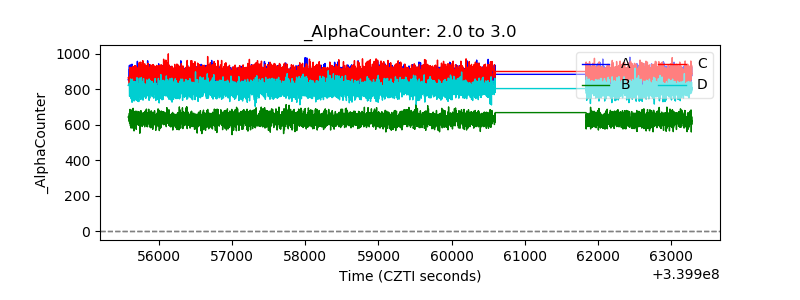 |
| _CPM_Rate | 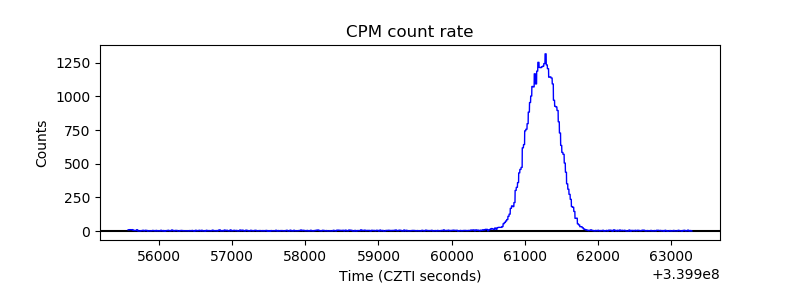 |
| CZT Counter | 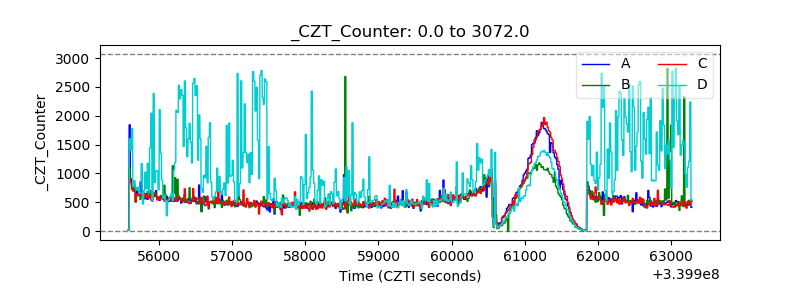 |
| +2.5 Volts monitor |  |
| +5 Volts monitor |  |
| _ROLL_ROT | 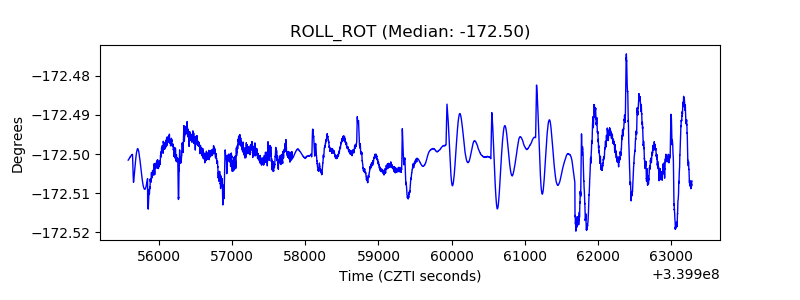 |
| _Roll_DEC | 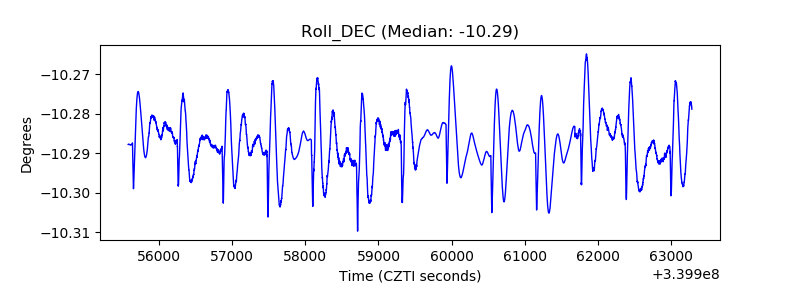 |
| _Roll_RA | 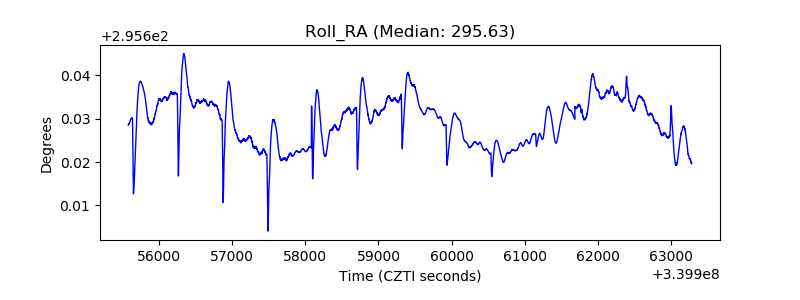 |
| Veto Counter | 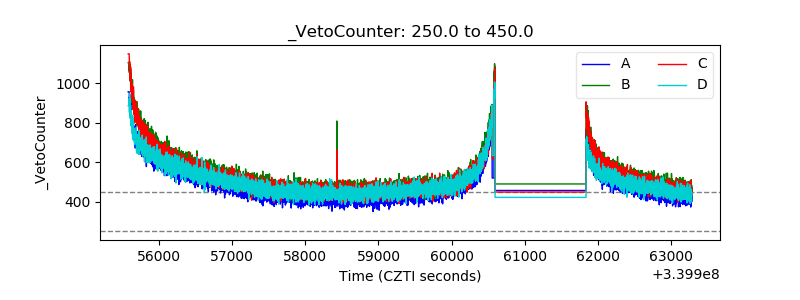 |