| Param | Original file | Final file |
|---|---|---|
| Filename | modeM0/AS1T03_243T01_9000003918_27215cztM0_level2.evt | modeM0/AS1T03_243T01_9000003918_27215cztM0_level2_quad_clean.evt |
| Size (bytes) | 597,764,160 | 92,980,800 |
| Size | 570.1 MB | 88.7 MB |
| Events in quadrant A | 3,402,436 | 615,836 |
| Events in quadrant B | 3,559,005 | 627,837 |
| Events in quadrant C | 3,265,994 | 594,899 |
| Events in quadrant D | 7,429,155 | 517,040 |
| Mode M9 | |||
|---|---|---|---|
| Quadrant | BADHDUFLAG | Total packets | Discarded packets |
| A | 0 | 12 | 0 |
| B | 0 | 13 | 0 |
| C | 0 | 13 | 0 |
| D | 0 | 13 | 0 |
| Mode M0 | |||
|---|---|---|---|
| Quadrant | BADHDUFLAG | Total packets | Discarded packets |
| A | 0 | 14337 | 0 |
| B | 0 | 14721 | 0 |
| C | 0 | 13856 | 0 |
| D | 0 | 26521 | 0 |
| Quadrant | Total seconds | Saturated seconds | Saturation percentage |
|---|---|---|---|
| A | 6585 | 98 | 1.488231% |
| B | 6585 | 160 | 2.429765% |
| C | 6585 | 103 | 1.564161% |
| D | 6585 | 1229 | 18.663629% |
Noise dominated data is calculated using 1-second bins in cleaned event files. If a bin has >2000 counts, and if more than 50% of those come from <1% of pixels, then it is considered to be noise-dominated and hence unusable.
| Quadrant | # 1 sec bins | Bins with >0 counts | Bins with >2000 counts | High rate bins dominated by noise | Noise dominated (total time) | Noise dominated (detector-on time) | Marked lightcurve |
|---|---|---|---|---|---|---|---|
| A | 7535 | 6586 | 15 | 15 | 0.20% | 0.23% | 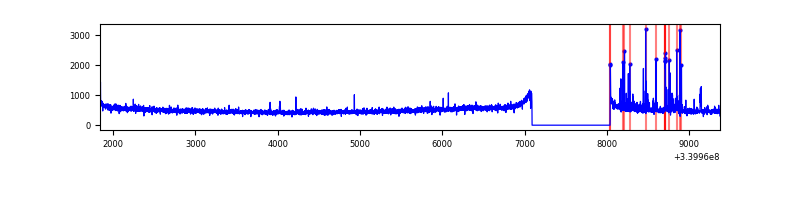 |
| B | 7535 | 6586 | 52 | 52 | 0.69% | 0.79% | 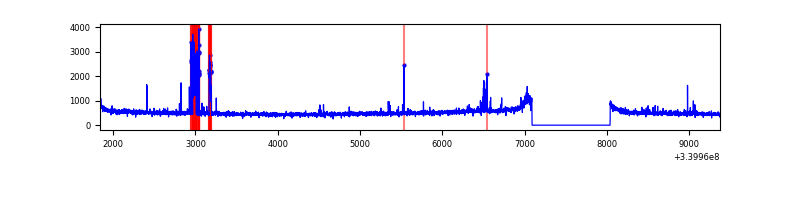 |
| C | 7535 | 6586 | 1 | 1 | 0.01% | 0.02% | 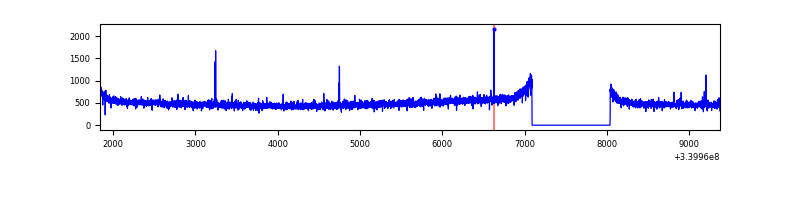 |
| D | 7535 | 6586 | 1016 | 1016 | 13.48% | 15.43% | 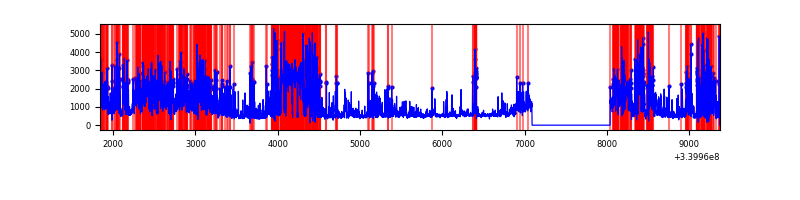 |
Top three noisy pixels from each quadrant. If the there are fewer than three noisy pixels in the level2.evt file, extra rows are filled as -1
| Pixel properties | Quadrant properties | ||||||
|---|---|---|---|---|---|---|---|
| Quadrant | DetID | PixID | Counts | Sigma | Mean | Median | Sigma |
| A | 13 | 248 | 89024 | 524.12 | 843 | 828 | 168.3 |
| A | 14 | 235 | 41322 | 240.64 | 843 | 828 | 168.3 |
| A | 8 | 192 | 14534 | 81.45 | 843 | 828 | 168.3 |
| B | 3 | 64 | 168941 | 1057.25 | 839 | 817 | 159.0 |
| B | 0 | 190 | 32967 | 202.18 | 839 | 817 | 159.0 |
| B | 0 | 230 | 25557 | 155.58 | 839 | 817 | 159.0 |
| C | 14 | 238 | 128514 | 676.22 | 800 | 803 | 188.9 |
| C | 2 | 16 | 13299 | 66.17 | 800 | 803 | 188.9 |
| C | 15 | 208 | 7996 | 38.09 | 800 | 803 | 188.9 |
| D | 1 | 52 | 3792882 | 19994.45 | 742 | 725 | 189.7 |
| D | 2 | 250 | 215985 | 1134.98 | 742 | 725 | 189.7 |
| D | 12 | 233 | 158702 | 832.95 | 742 | 725 | 189.7 |
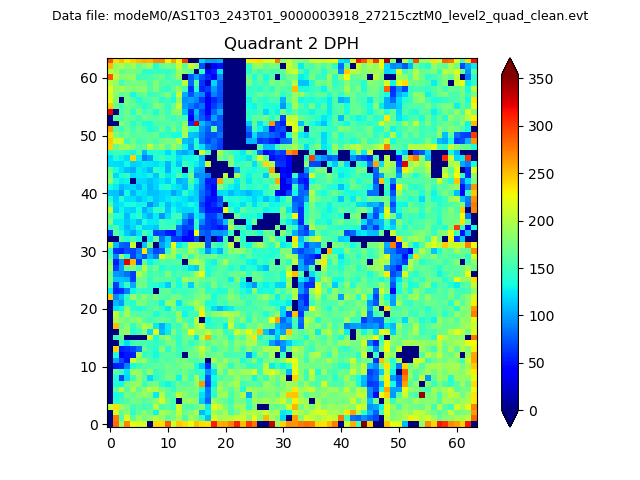
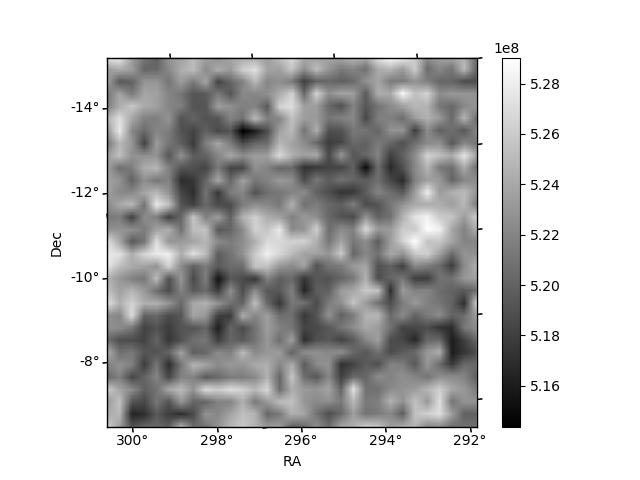
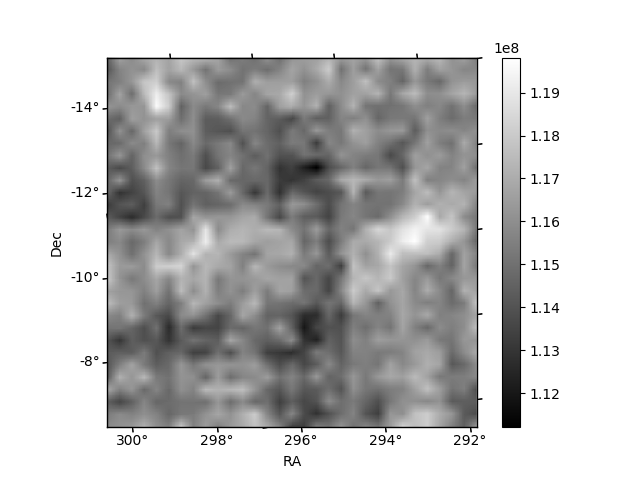
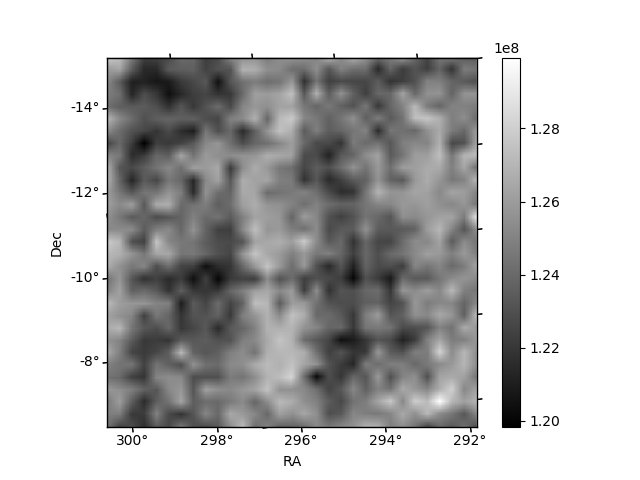
Histogram calculated using DETX and DETY for each event in the final _common_clean file
| Quadrant A | 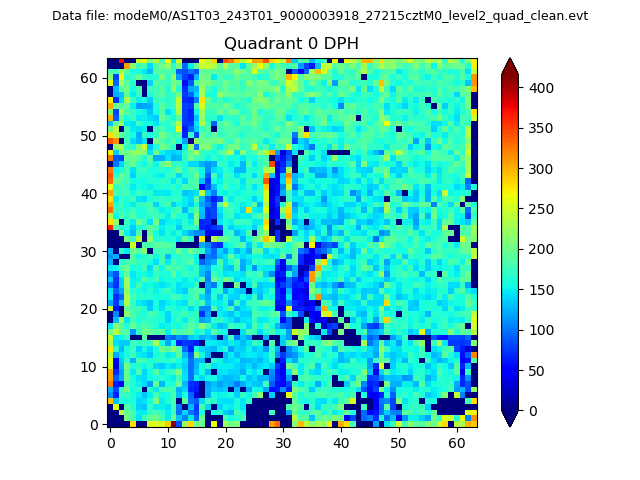 |
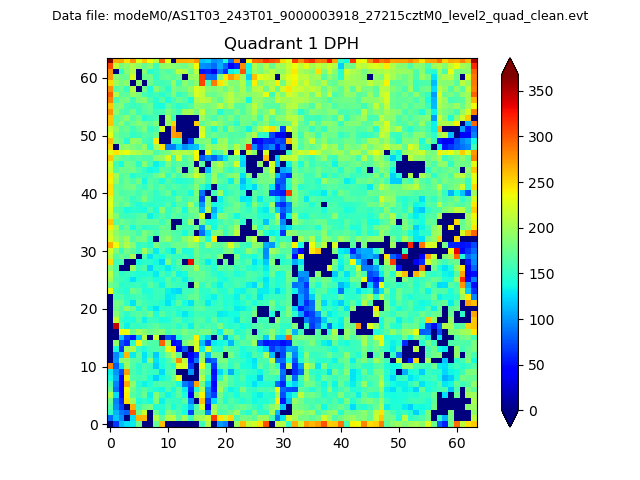 |
Quadrant B |
|---|---|---|---|
| Quadrant D | 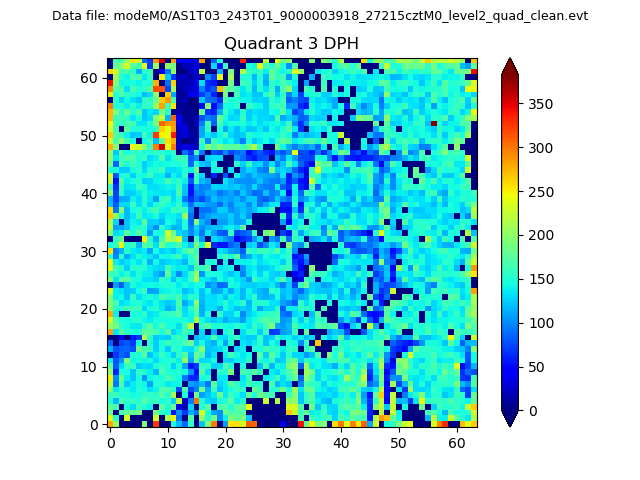 |
 |
Quadrant C |
| Plot type | Count rate plots | Images |
|---|---|---|
| Comparison with Poisson distribution Blue bars denote a histogram of data divided into 1 sec bins. Red curve is a Poisson curve with rate = median count rate of data. |
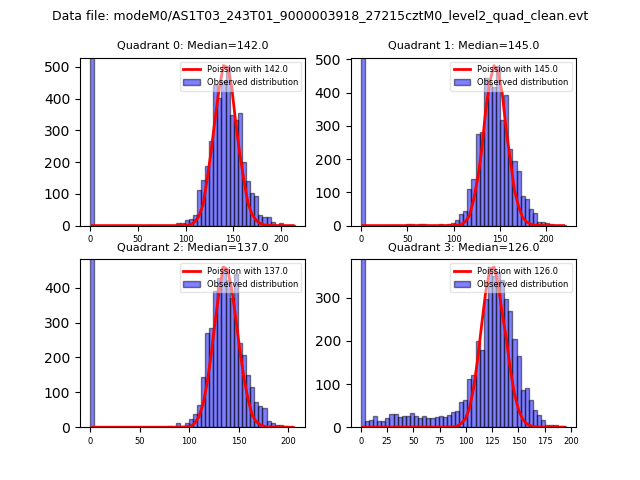 |
 |
| Quadrant-wise count rates Data is divided into 100 sec bins |
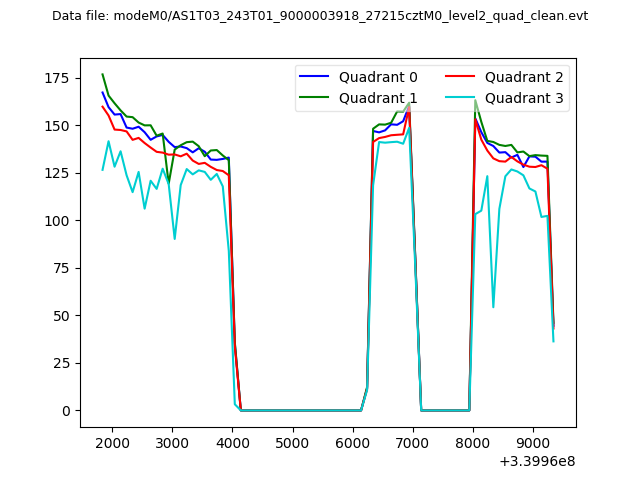 |
|
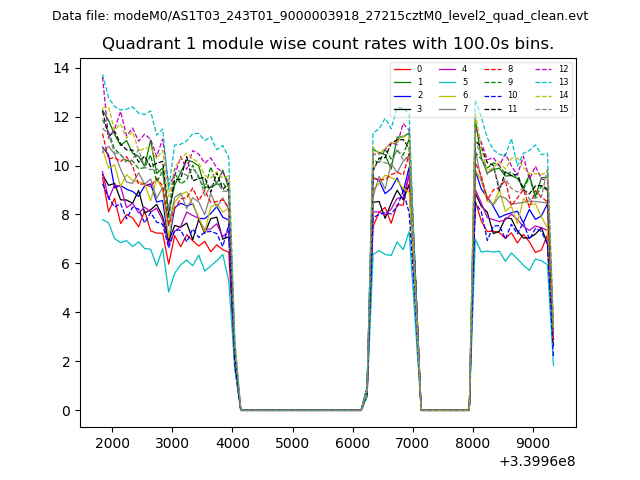
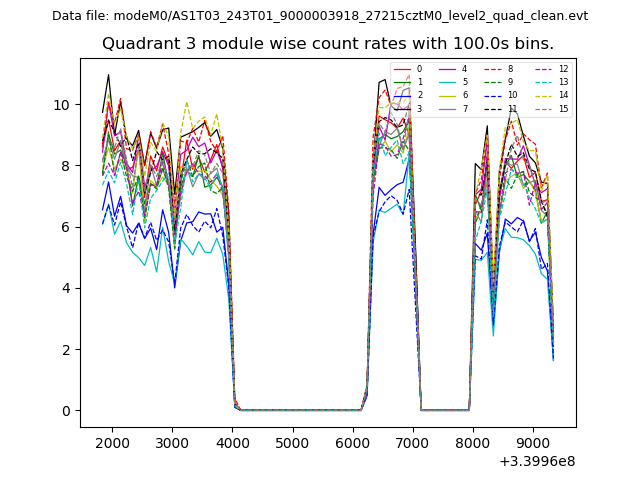
| Module-wise count rates for Quadrant A Data is divided into 100 sec bins |
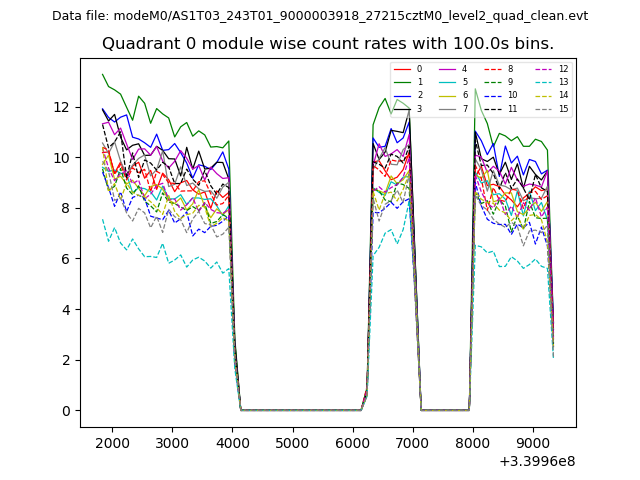 |
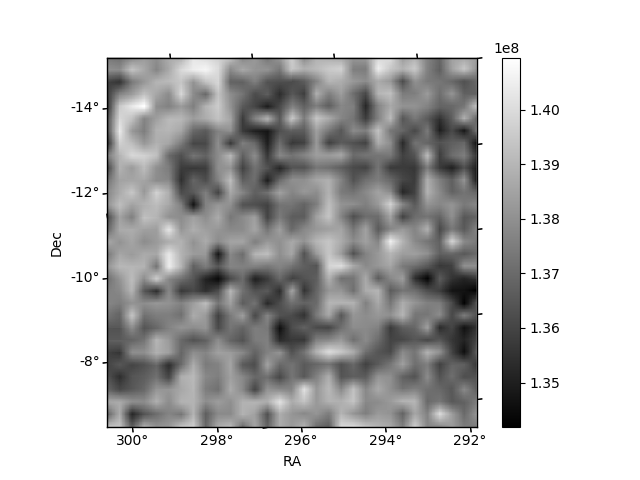 |
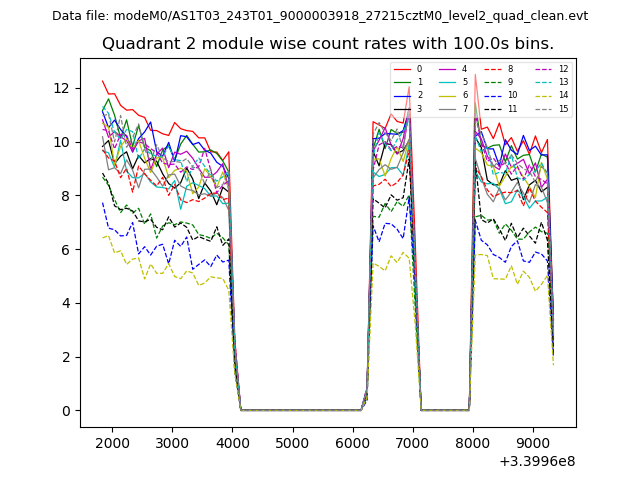
| Module-wise count rates for Quadrant B Data is divided into 100 sec bins |
 |
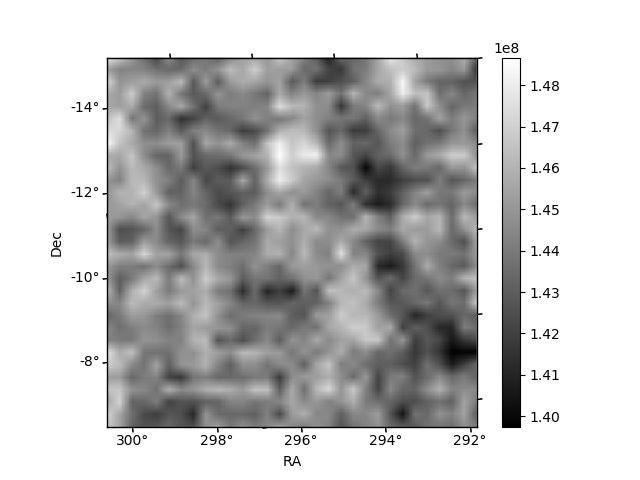 |
| Module-wise count rates for Quadrant C Data is divided into 100 sec bins |
 |
 |
| Module-wise count rates for Quadrant D Data is divided into 100 sec bins |
 |
 |
| Parameter | Plot |
|---|---|
| CZT HV Monitor | 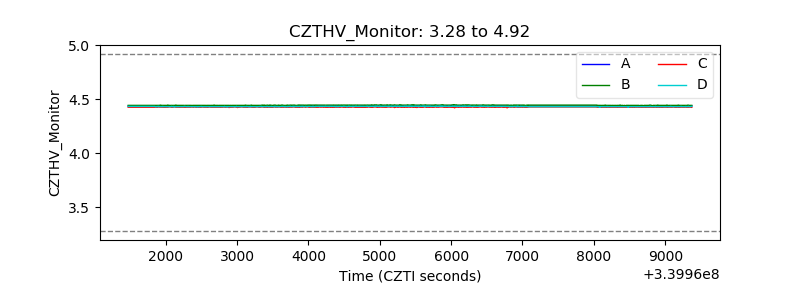 |
| D_VDD | 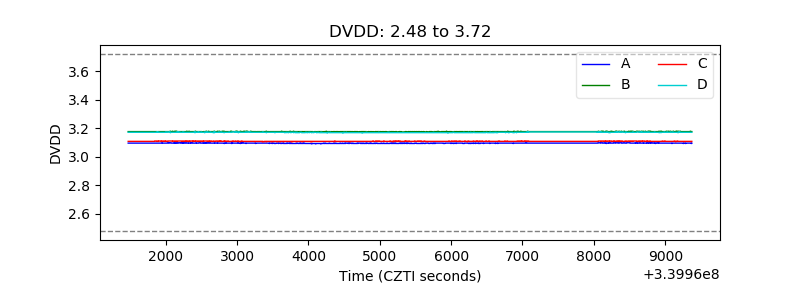 |
| Temperature 1 | 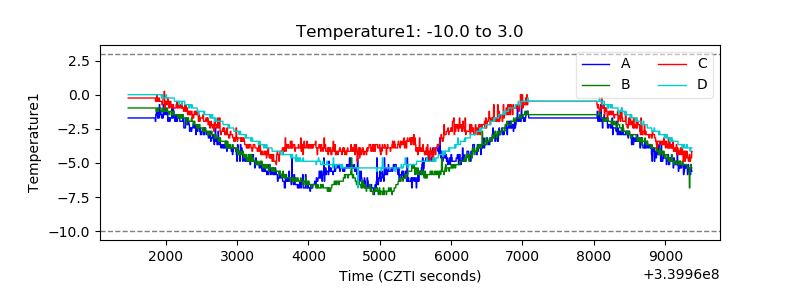 |
| Veto HV Monitor | 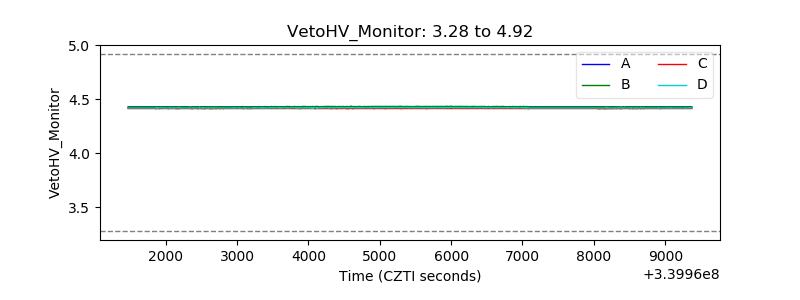 |
| Veto LLD | 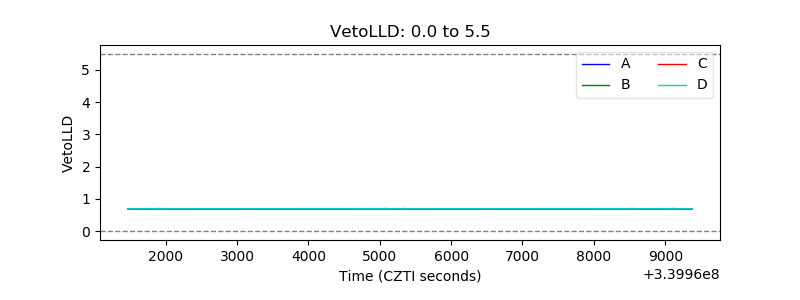 |
| Alpha Counter | 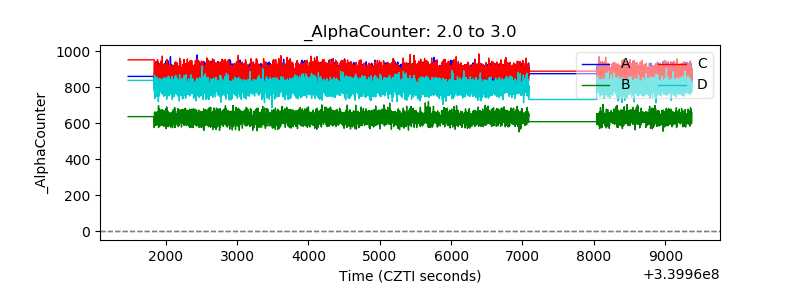 |
| _CPM_Rate | 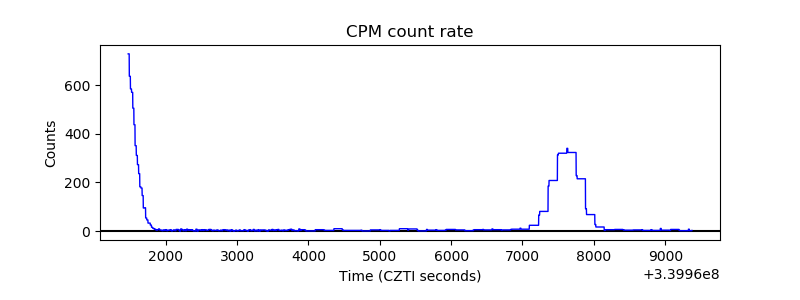 |
| CZT Counter | 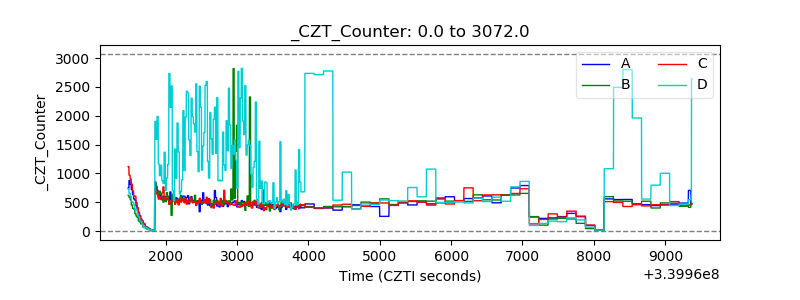 |
| +2.5 Volts monitor |  |
| +5 Volts monitor |  |
| _ROLL_ROT | 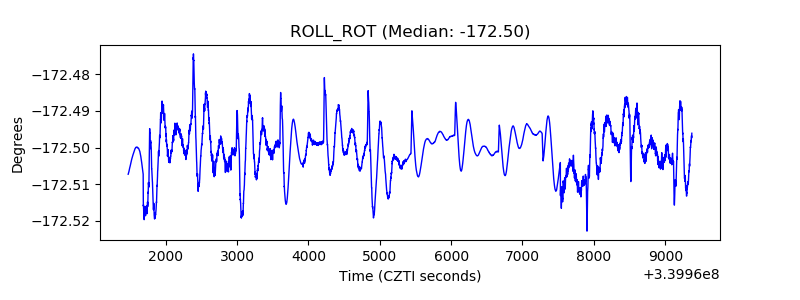 |
| _Roll_DEC | 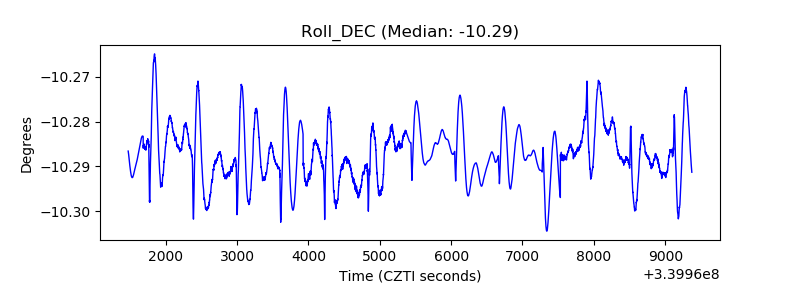 |
| _Roll_RA | 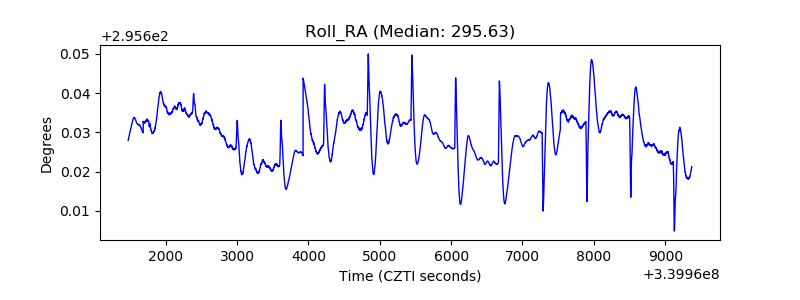 |
| Veto Counter | 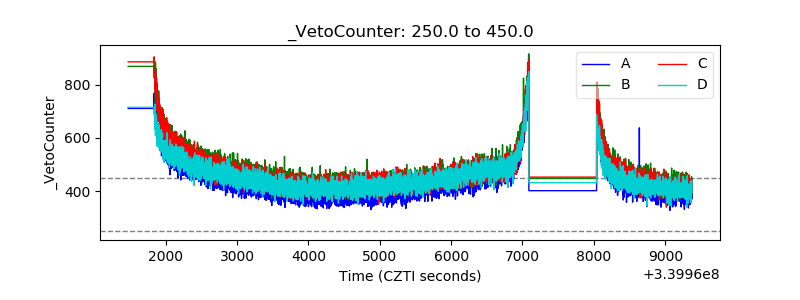 |