| Param | Original file | Final file |
|---|---|---|
| Filename | modeM0/AS1T03_243T01_9000003918_27216cztM0_level2.evt | modeM0/AS1T03_243T01_9000003918_27216cztM0_level2_quad_clean.evt |
| Size (bytes) | 616,435,200 | 102,850,560 |
| Size | 587.9 MB | 98.1 MB |
| Events in quadrant A | 3,848,368 | 672,929 |
| Events in quadrant B | 3,706,349 | 685,762 |
| Events in quadrant C | 3,535,855 | 656,632 |
| Events in quadrant D | 7,085,410 | 592,953 |
| Mode M9 | |||
|---|---|---|---|
| Quadrant | BADHDUFLAG | Total packets | Discarded packets |
| A | 0 | 14 | 0 |
| B | 0 | 14 | 0 |
| C | 0 | 14 | 0 |
| D | 0 | 14 | 0 |
| Mode M0 | |||
|---|---|---|---|
| Quadrant | BADHDUFLAG | Total packets | Discarded packets |
| A | 0 | 16137 | 0 |
| B | 0 | 15543 | 0 |
| C | 0 | 15125 | 0 |
| D | 0 | 26018 | 0 |
| Quadrant | Total seconds | Saturated seconds | Saturation percentage |
|---|---|---|---|
| A | 7266 | 157 | 2.160749% |
| B | 7267 | 168 | 2.311821% |
| C | 7267 | 146 | 2.009082% |
| D | 7267 | 1147 | 15.783680% |
Noise dominated data is calculated using 1-second bins in cleaned event files. If a bin has >2000 counts, and if more than 50% of those come from <1% of pixels, then it is considered to be noise-dominated and hence unusable.
| Quadrant | # 1 sec bins | Bins with >0 counts | Bins with >2000 counts | High rate bins dominated by noise | Noise dominated (total time) | Noise dominated (detector-on time) | Marked lightcurve |
|---|---|---|---|---|---|---|---|
| A | 8736 | 7268 | 38 | 38 | 0.43% | 0.52% | 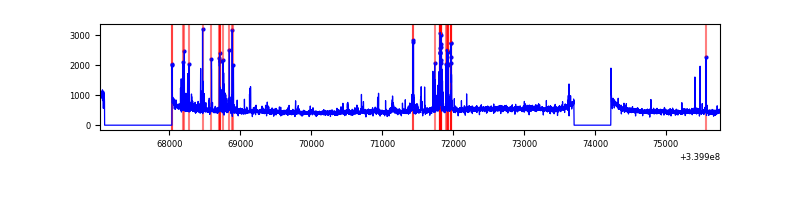 |
| B | 8737 | 7269 | 19 | 19 | 0.22% | 0.26% | 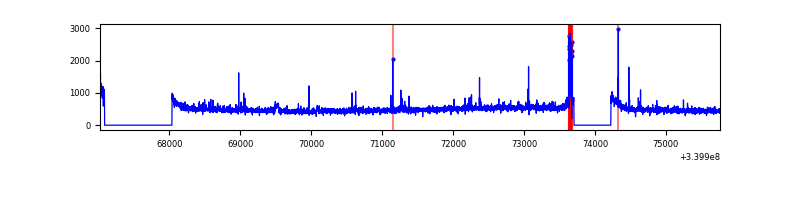 |
| C | 8737 | 7269 | 0 | 0 | 0.00% | 0.00% | 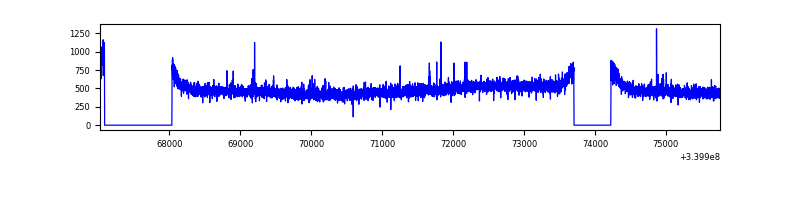 |
| D | 8737 | 7268 | 807 | 807 | 9.24% | 11.10% | 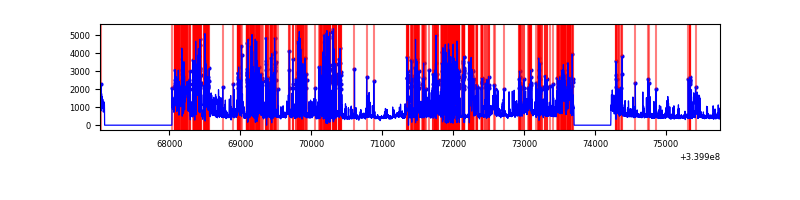 |
Top three noisy pixels from each quadrant. If the there are fewer than three noisy pixels in the level2.evt file, extra rows are filled as -1
| Pixel properties | Quadrant properties | ||||||
|---|---|---|---|---|---|---|---|
| Quadrant | DetID | PixID | Counts | Sigma | Mean | Median | Sigma |
| A | 14 | 235 | 248602 | 1353.01 | 905 | 886 | 183.1 |
| A | 13 | 248 | 87762 | 474.51 | 905 | 886 | 183.1 |
| A | 8 | 192 | 15186 | 78.11 | 905 | 886 | 183.1 |
| B | 5 | 172 | 78077 | 445.08 | 902 | 878 | 173.5 |
| B | 0 | 190 | 33478 | 187.95 | 902 | 878 | 173.5 |
| B | 12 | 111 | 20858 | 115.19 | 902 | 878 | 173.5 |
| C | 14 | 238 | 138496 | 675.54 | 866 | 871 | 203.7 |
| C | 2 | 16 | 16475 | 76.59 | 866 | 871 | 203.7 |
| C | 15 | 208 | 7088 | 30.52 | 866 | 871 | 203.7 |
| D | 1 | 52 | 3263118 | 15983.94 | 803 | 783 | 204.1 |
| D | 5 | 222 | 237737 | 1160.97 | 803 | 783 | 204.1 |
| D | 12 | 233 | 205925 | 1005.1 | 803 | 783 | 204.1 |
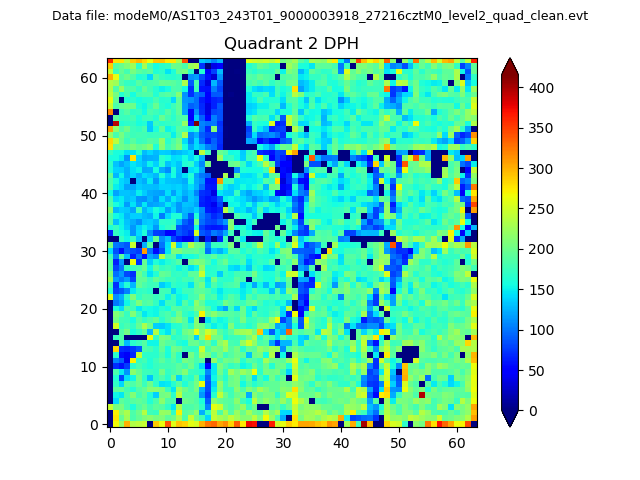
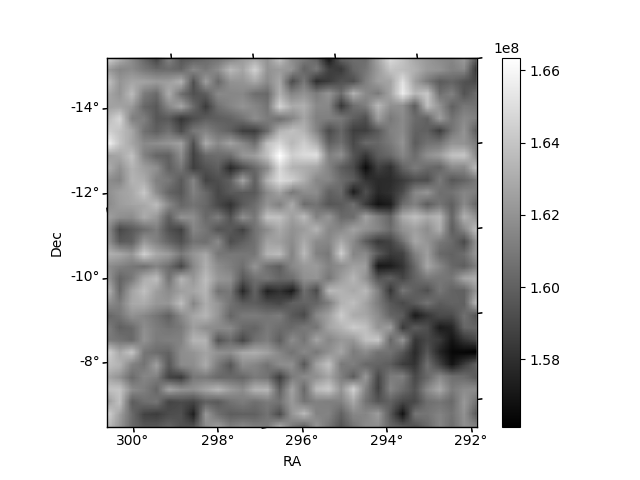
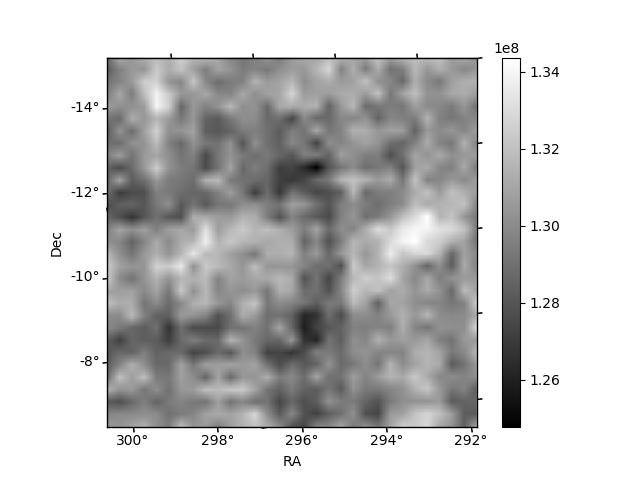
Histogram calculated using DETX and DETY for each event in the final _common_clean file
| Quadrant A | 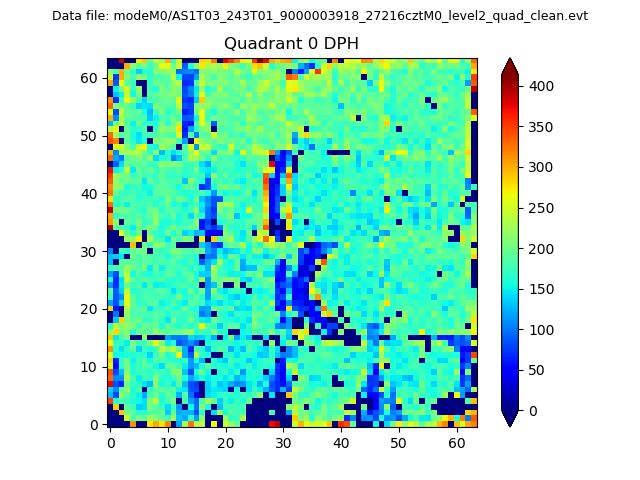 |
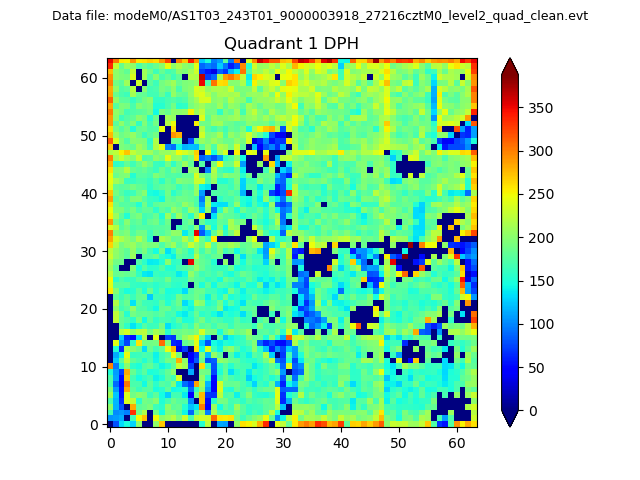 |
Quadrant B |
|---|---|---|---|
| Quadrant D | 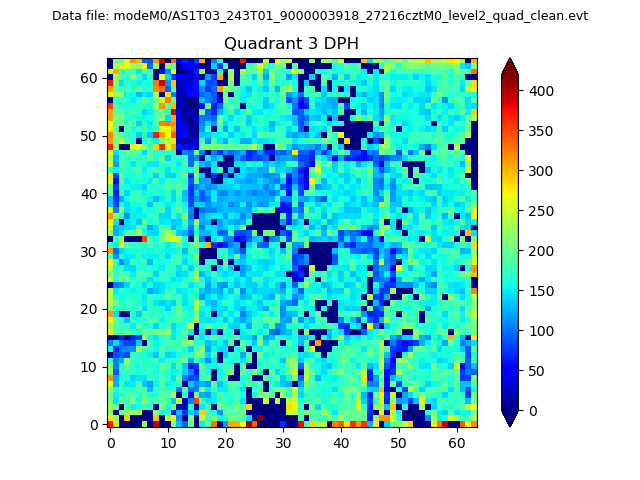 |
 |
Quadrant C |
| Plot type | Count rate plots | Images |
|---|---|---|
| Comparison with Poisson distribution Blue bars denote a histogram of data divided into 1 sec bins. Red curve is a Poisson curve with rate = median count rate of data. |
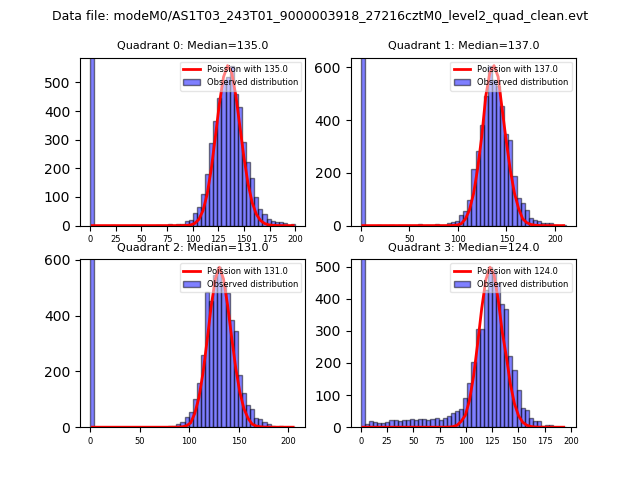 |
 |
| Quadrant-wise count rates Data is divided into 100 sec bins |
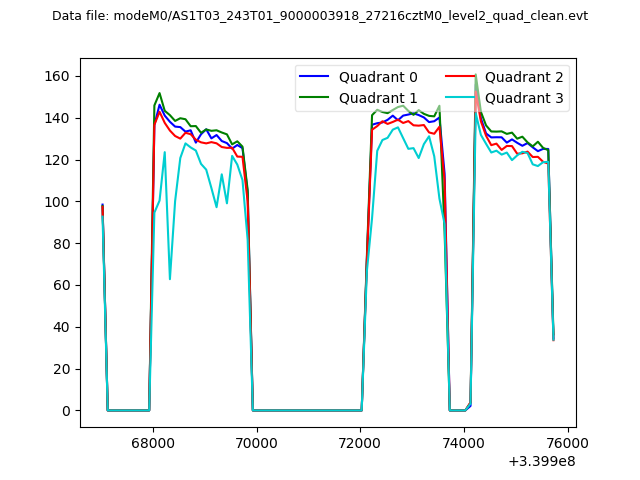 |
|
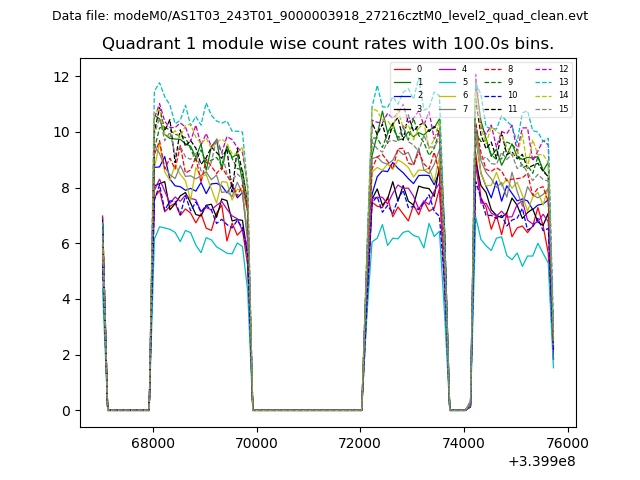
| Module-wise count rates for Quadrant A Data is divided into 100 sec bins |
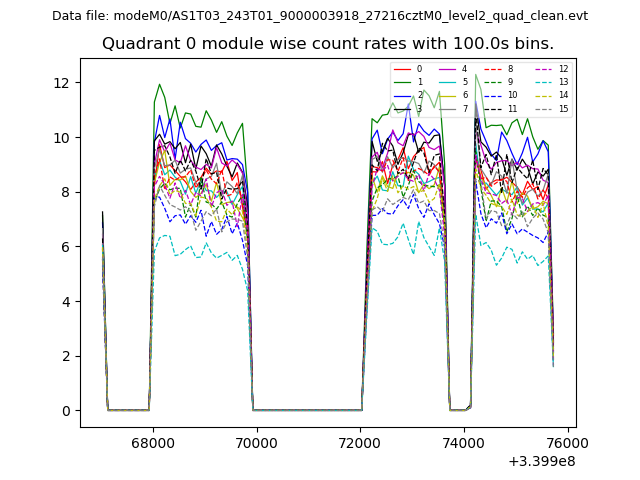 |
 |
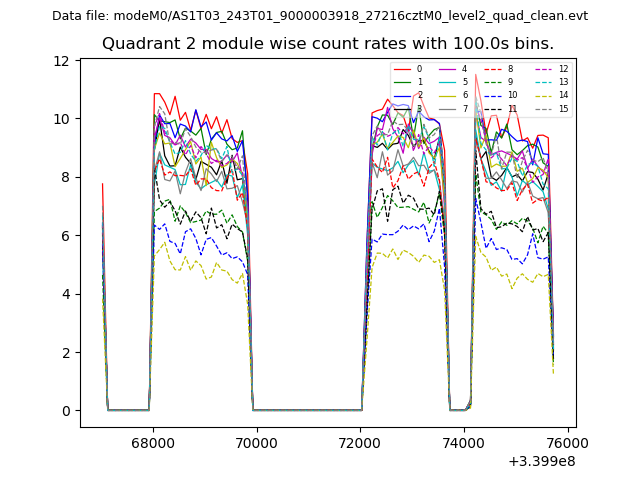
| Module-wise count rates for Quadrant B Data is divided into 100 sec bins |
 |
 |
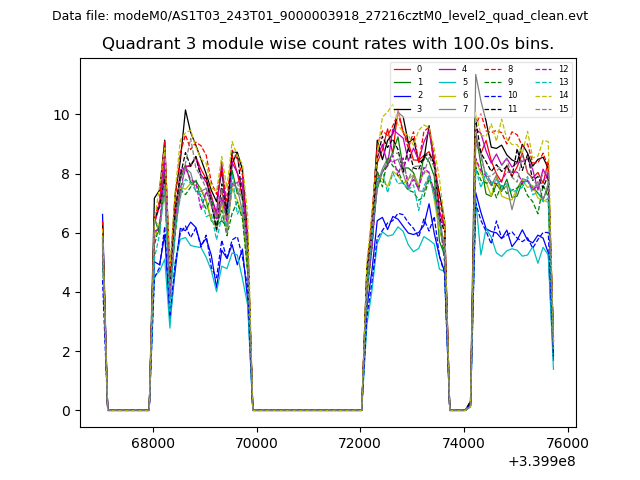
| Module-wise count rates for Quadrant C Data is divided into 100 sec bins |
 |
 |
| Module-wise count rates for Quadrant D Data is divided into 100 sec bins |
 |
 |
| Parameter | Plot |
|---|---|
| CZT HV Monitor | 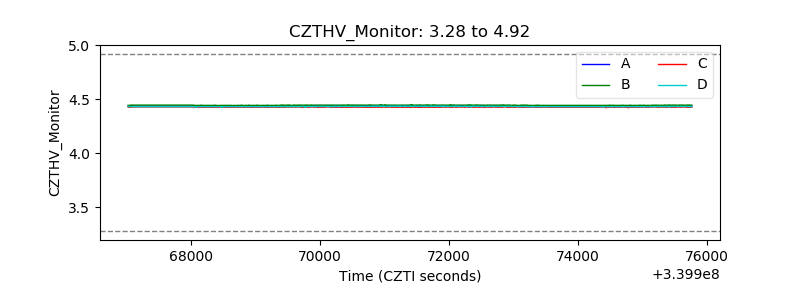 |
| D_VDD | 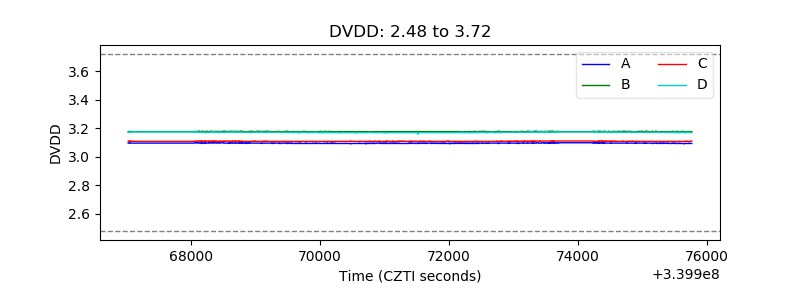 |
| Temperature 1 | 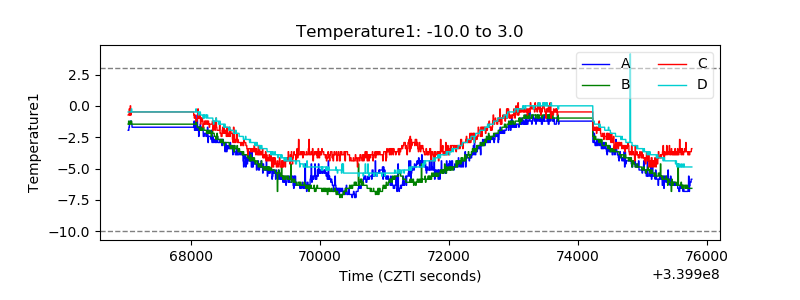 |
| Veto HV Monitor | 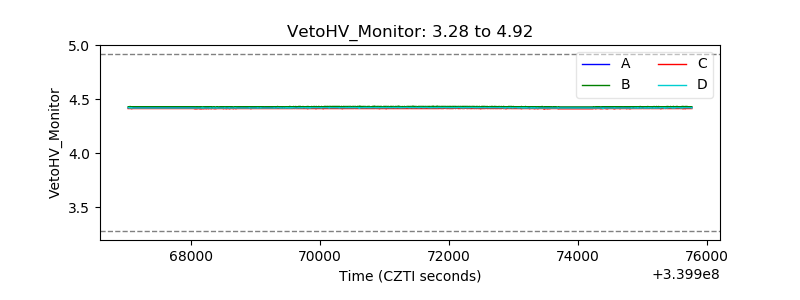 |
| Veto LLD | 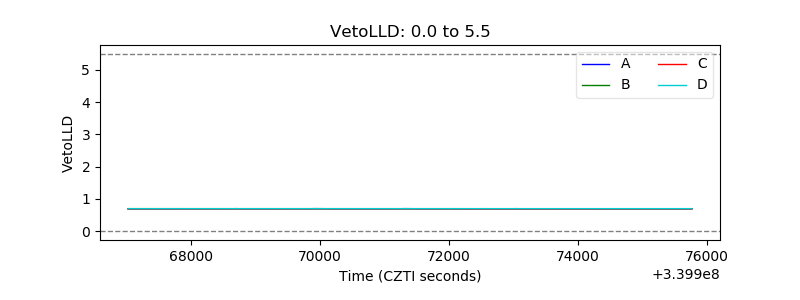 |
| Alpha Counter | 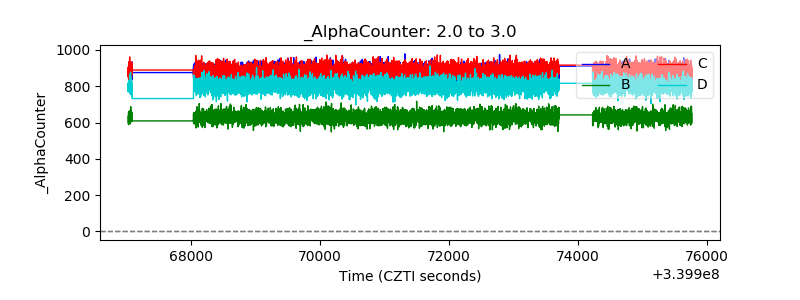 |
| _CPM_Rate | 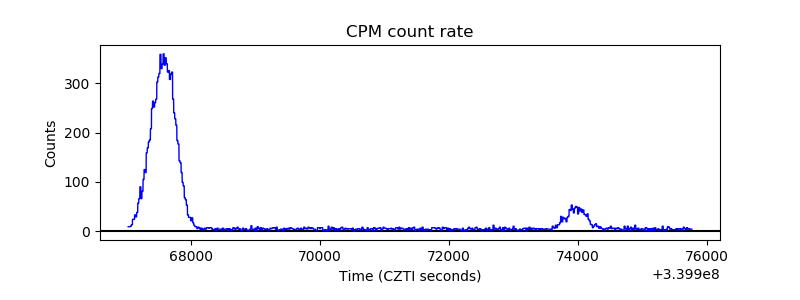 |
| CZT Counter | 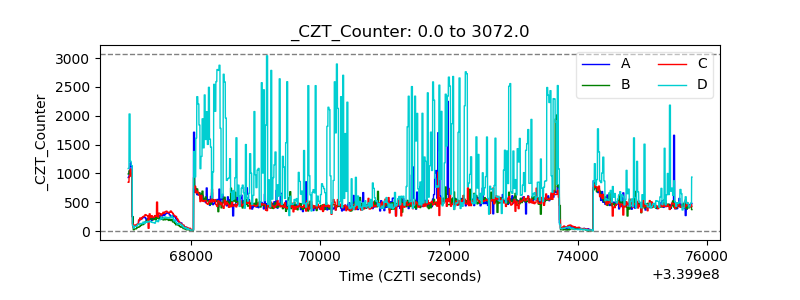 |
| +2.5 Volts monitor |  |
| +5 Volts monitor | 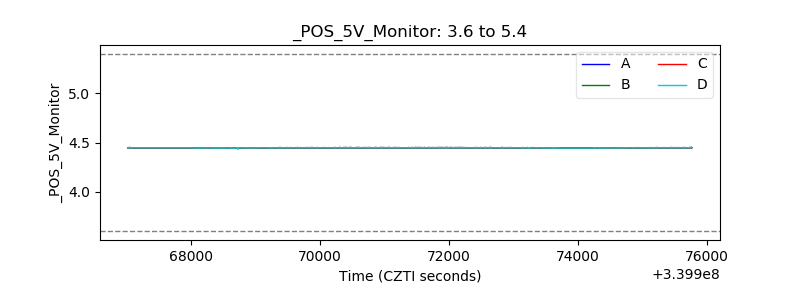 |
| _ROLL_ROT | 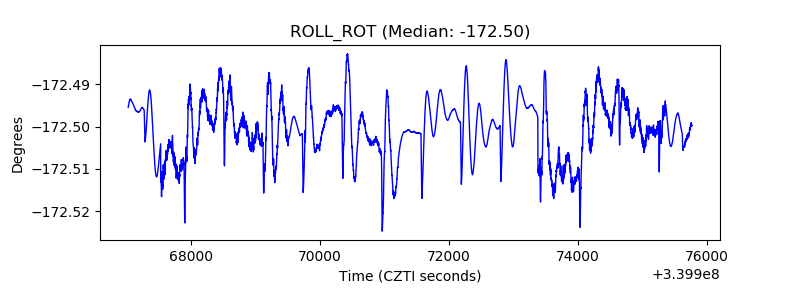 |
| _Roll_DEC | 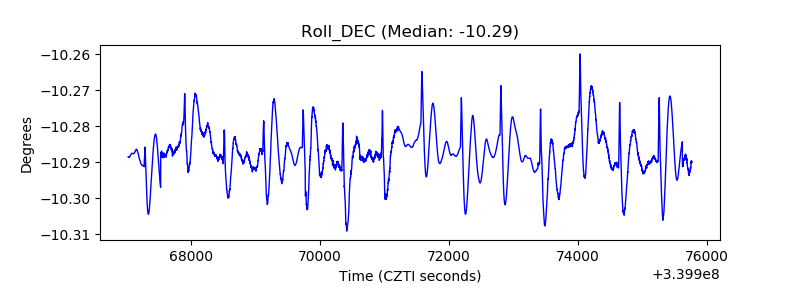 |
| _Roll_RA | 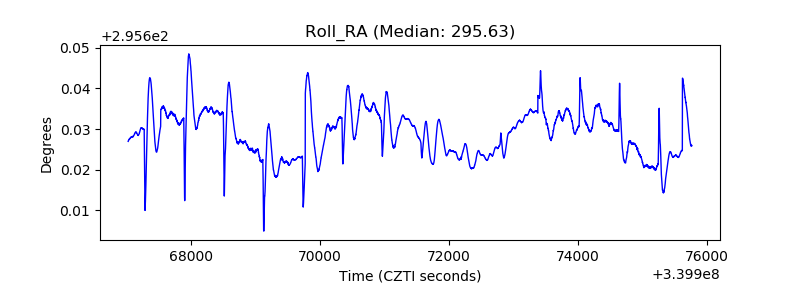 |
| Veto Counter | 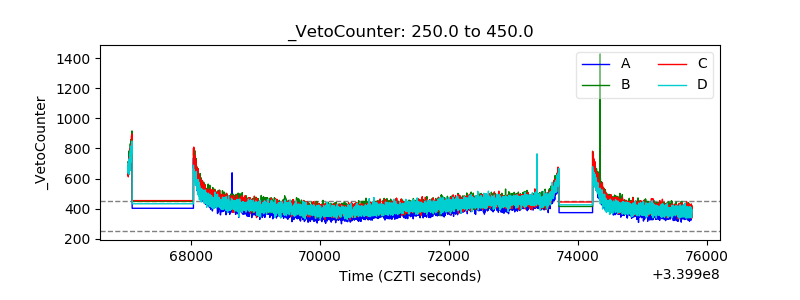 |