| Param | Original file | Final file |
|---|---|---|
| Filename | modeM0/AS1T03_243T01_9000003918_27217cztM0_level2.evt | modeM0/AS1T03_243T01_9000003918_27217cztM0_level2_quad_clean.evt |
| Size (bytes) | 567,806,400 | 107,988,480 |
| Size | 541.5 MB | 103.0 MB |
| Events in quadrant A | 3,921,416 | 693,798 |
| Events in quadrant B | 3,978,457 | 706,241 |
| Events in quadrant C | 3,842,941 | 672,876 |
| Events in quadrant D | 4,921,804 | 652,678 |
| Mode M9 | |||
|---|---|---|---|
| Quadrant | BADHDUFLAG | Total packets | Discarded packets |
| A | 0 | 6 | 0 |
| B | 0 | 6 | 0 |
| C | 0 | 6 | 0 |
| D | 0 | 6 | 0 |
| Mode M0 | |||
|---|---|---|---|
| Quadrant | BADHDUFLAG | Total packets | Discarded packets |
| A | 0 | 16747 | 0 |
| B | 0 | 16764 | 0 |
| C | 0 | 16429 | 0 |
| D | 0 | 19930 | 0 |
| Quadrant | Total seconds | Saturated seconds | Saturation percentage |
|---|---|---|---|
| A | 7826 | 136 | 1.737797% |
| B | 7827 | 217 | 2.772454% |
| C | 7827 | 199 | 2.542481% |
| D | 7827 | 333 | 4.254504% |
Noise dominated data is calculated using 1-second bins in cleaned event files. If a bin has >2000 counts, and if more than 50% of those come from <1% of pixels, then it is considered to be noise-dominated and hence unusable.
| Quadrant | # 1 sec bins | Bins with >0 counts | Bins with >2000 counts | High rate bins dominated by noise | Noise dominated (total time) | Noise dominated (detector-on time) | Marked lightcurve |
|---|---|---|---|---|---|---|---|
| A | 8476 | 7829 | 4 | 4 | 0.05% | 0.05% | 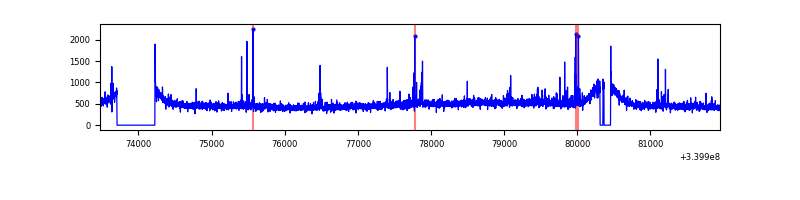 |
| B | 8476 | 7829 | 19 | 19 | 0.22% | 0.24% | 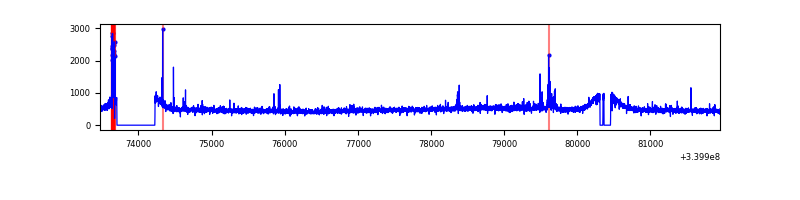 |
| C | 8476 | 7829 | 4 | 4 | 0.05% | 0.05% | 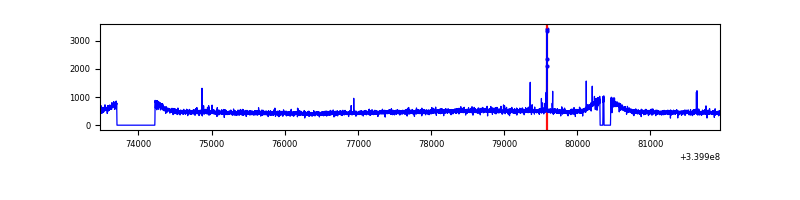 |
| D | 8477 | 7830 | 182 | 182 | 2.15% | 2.32% | 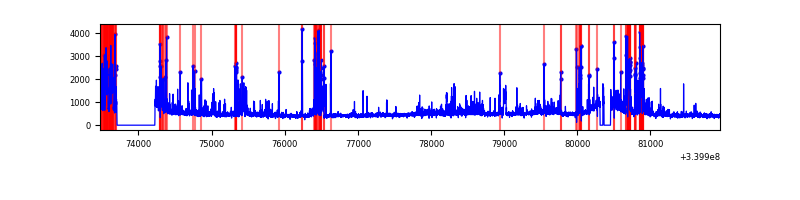 |
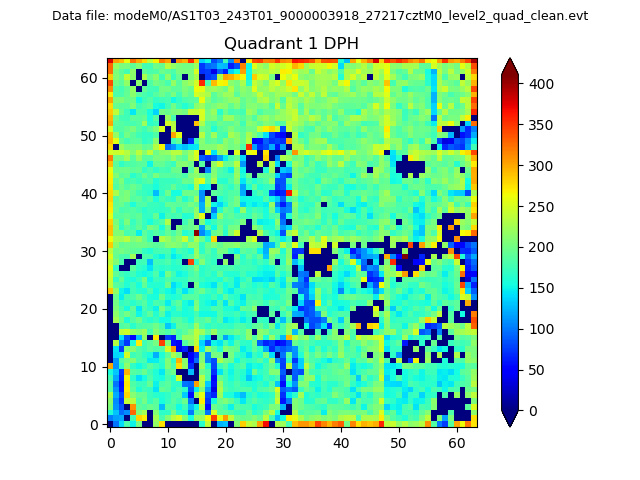
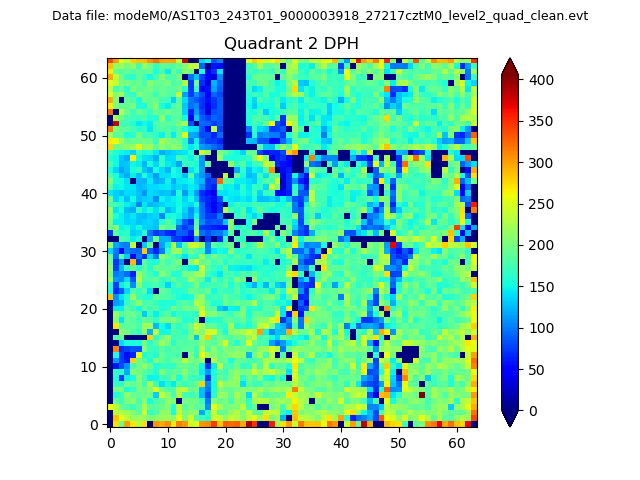
Top three noisy pixels from each quadrant. If the there are fewer than three noisy pixels in the level2.evt file, extra rows are filled as -1
| Pixel properties | Quadrant properties | ||||||
|---|---|---|---|---|---|---|---|
| Quadrant | DetID | PixID | Counts | Sigma | Mean | Median | Sigma |
| A | 14 | 235 | 106212 | 528.42 | 979 | 955 | 199.2 |
| A | 13 | 248 | 18124 | 86.19 | 979 | 955 | 199.2 |
| A | 8 | 192 | 13157 | 61.26 | 979 | 955 | 199.2 |
| B | 5 | 172 | 74144 | 387.87 | 974 | 949 | 188.7 |
| B | 15 | 33 | 47120 | 244.67 | 974 | 949 | 188.7 |
| B | 12 | 111 | 23000 | 116.85 | 974 | 949 | 188.7 |
| C | 14 | 238 | 147829 | 663.99 | 935 | 942 | 221.2 |
| C | 15 | 208 | 37537 | 165.42 | 935 | 942 | 221.2 |
| C | 13 | 61 | 6348 | 24.44 | 935 | 942 | 221.2 |
| D | 1 | 52 | 813947 | 3451.46 | 930 | 910 | 235.6 |
| D | 2 | 250 | 165418 | 698.36 | 930 | 910 | 235.6 |
| D | 12 | 233 | 142286 | 600.16 | 930 | 910 | 235.6 |
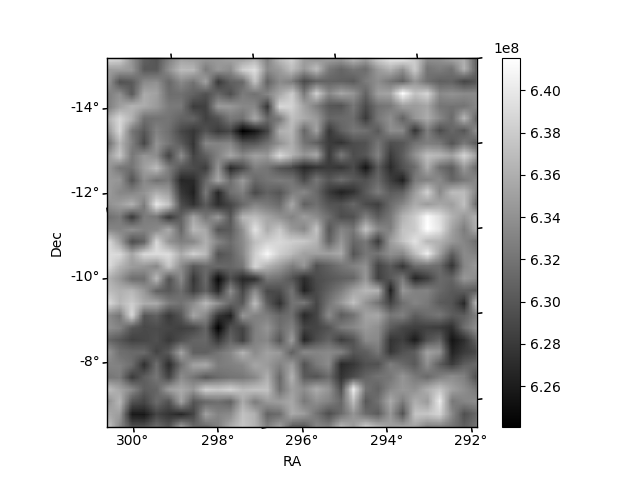
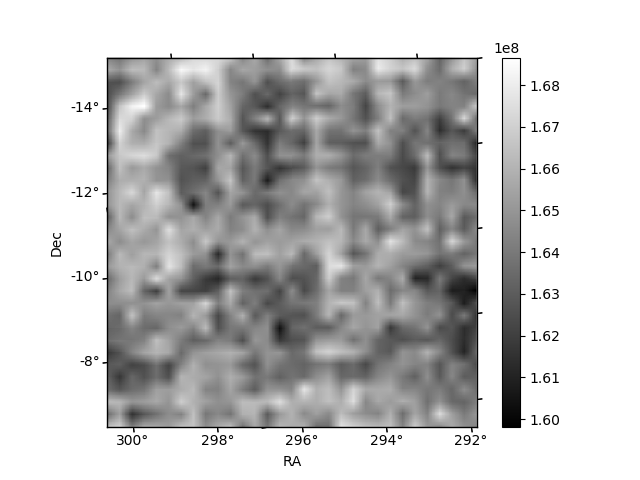
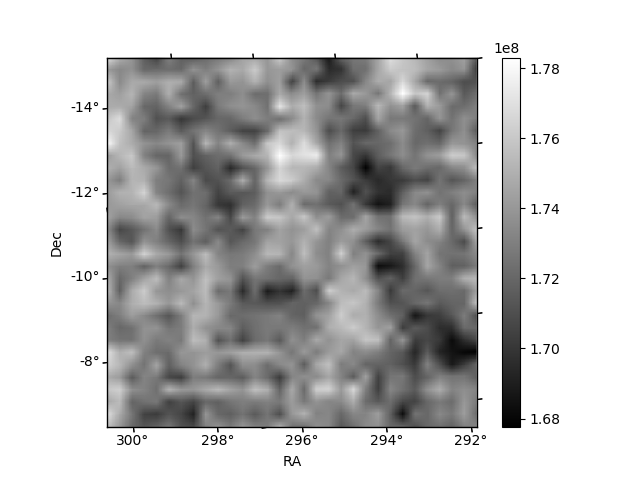
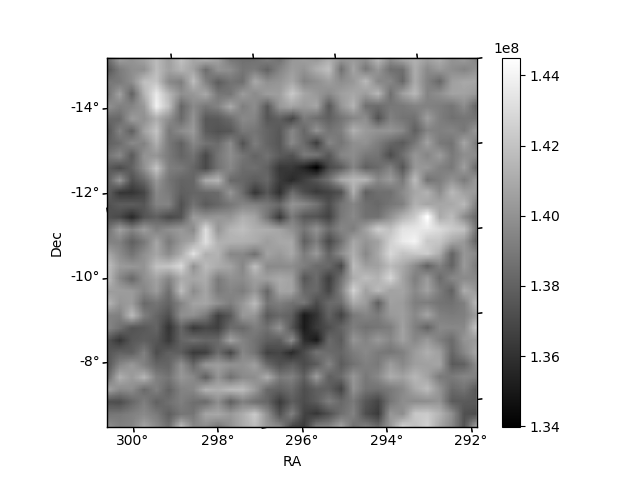
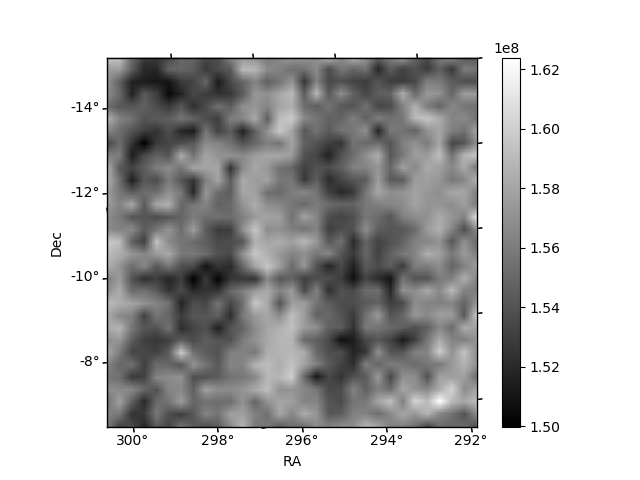
Histogram calculated using DETX and DETY for each event in the final _common_clean file
| Quadrant A | 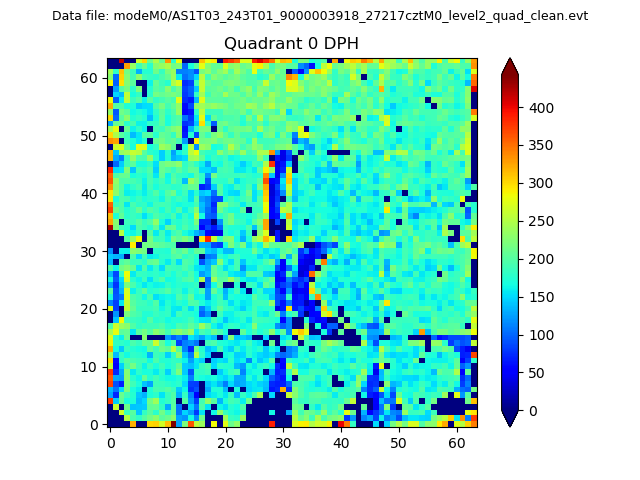 |
 |
Quadrant B |
|---|---|---|---|
| Quadrant D |  |
 |
Quadrant C |
| Plot type | Count rate plots | Images |
|---|---|---|
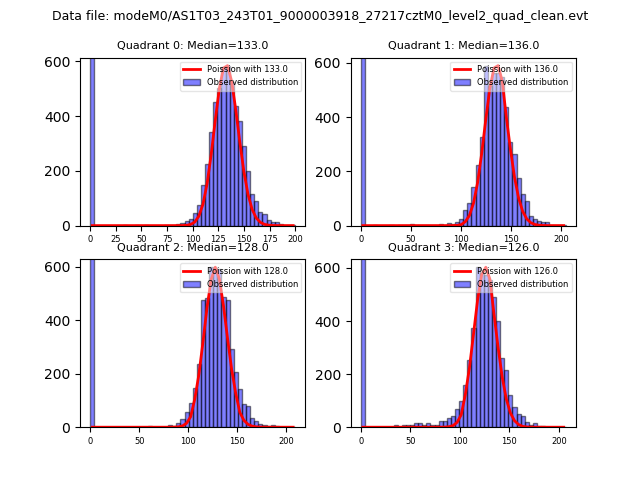
| Comparison with Poisson distribution Blue bars denote a histogram of data divided into 1 sec bins. Red curve is a Poisson curve with rate = median count rate of data. |
 |
 |
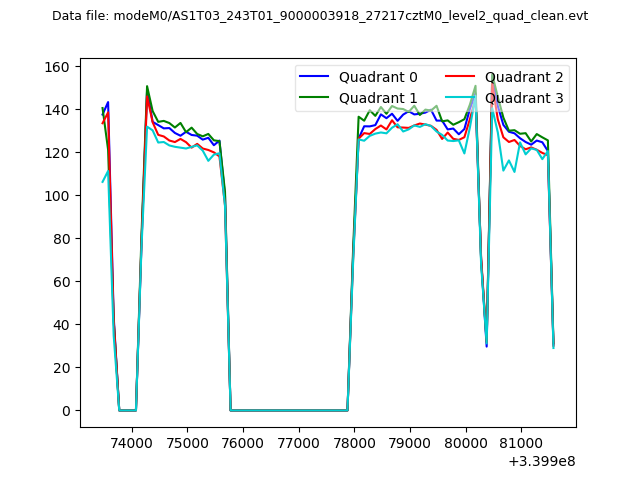
| Quadrant-wise count rates Data is divided into 100 sec bins |
 |
|
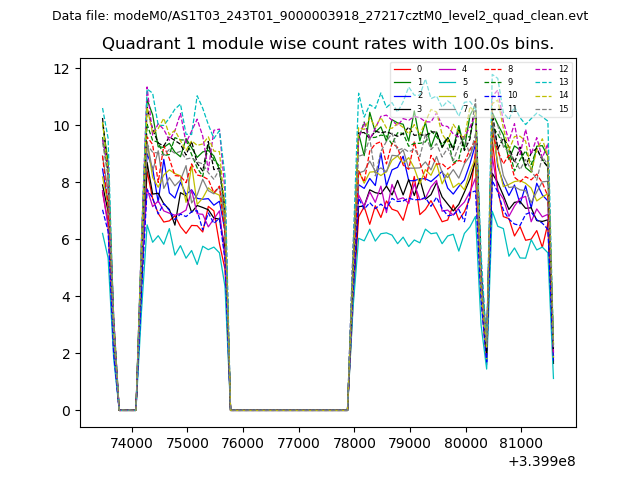
| Module-wise count rates for Quadrant A Data is divided into 100 sec bins |
 |
 |
| Module-wise count rates for Quadrant B Data is divided into 100 sec bins |
 |
 |
| Module-wise count rates for Quadrant C Data is divided into 100 sec bins |
 |
 |
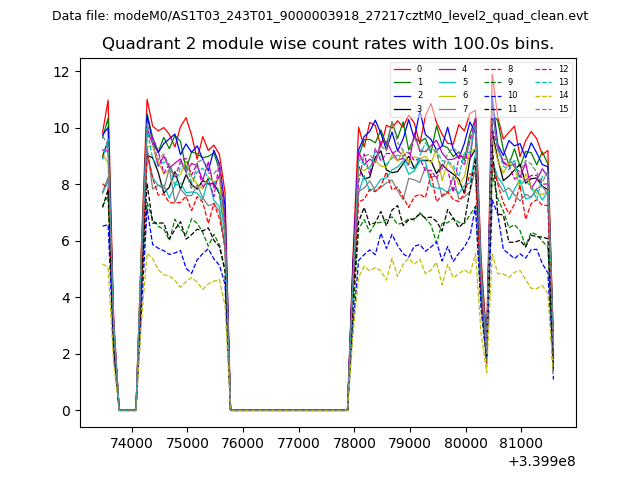
| Module-wise count rates for Quadrant D Data is divided into 100 sec bins |
 |
 |
| Parameter | Plot |
|---|---|
| CZT HV Monitor |  |
| D_VDD | 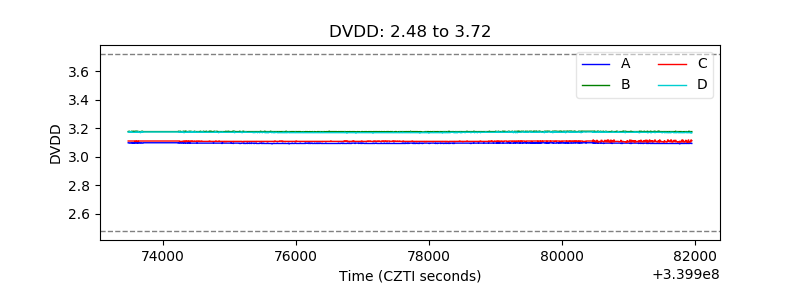 |
| Temperature 1 | 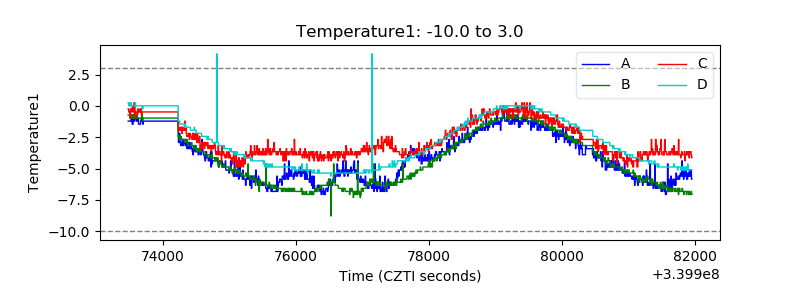 |
| Veto HV Monitor | 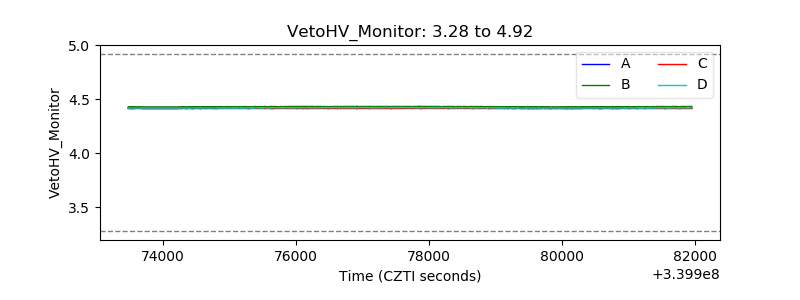 |
| Veto LLD | 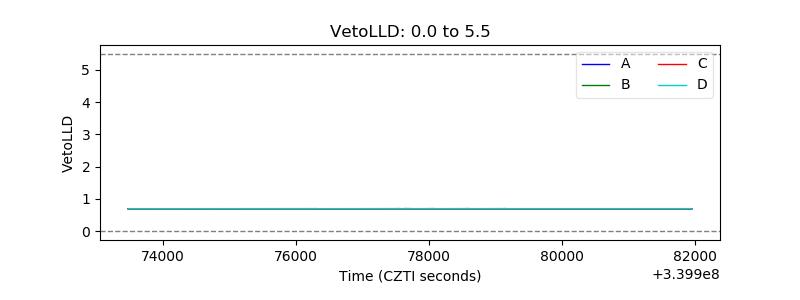 |
| Alpha Counter | 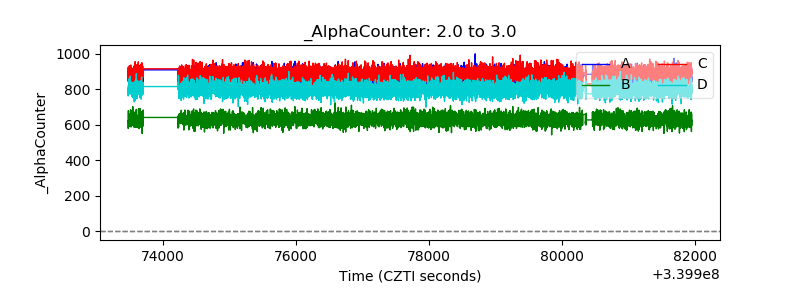 |
| _CPM_Rate | 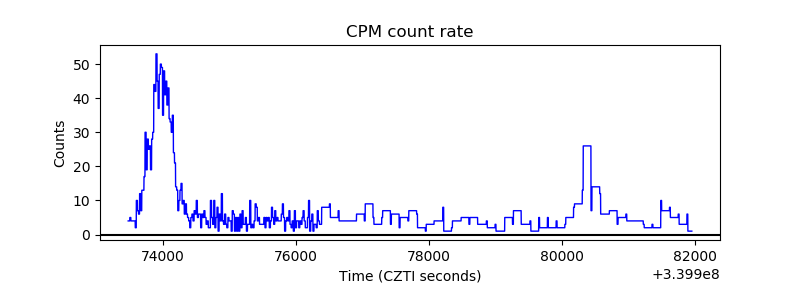 |
| CZT Counter | 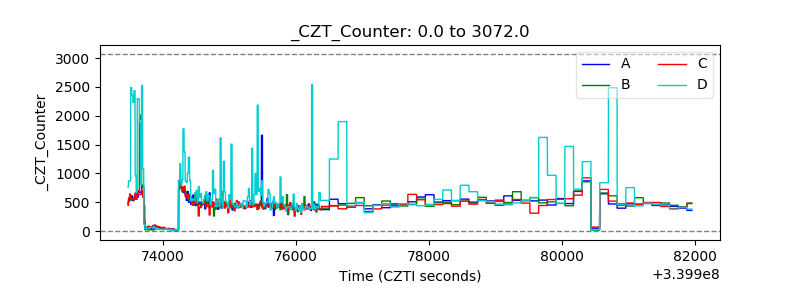 |
| +2.5 Volts monitor |  |
| +5 Volts monitor |  |
| _ROLL_ROT |  |
| _Roll_DEC | 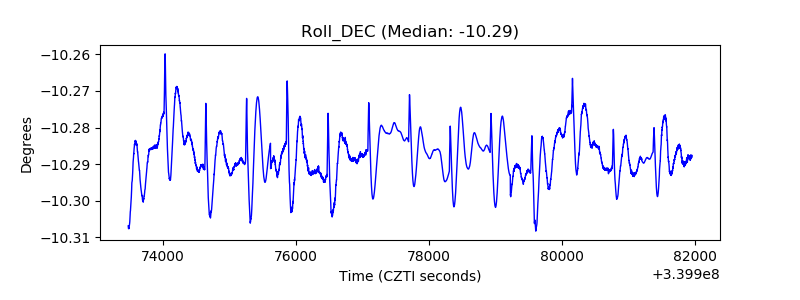 |
| _Roll_RA | 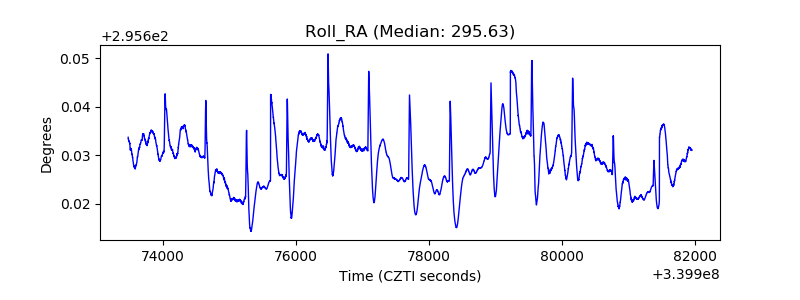 |
| Veto Counter | 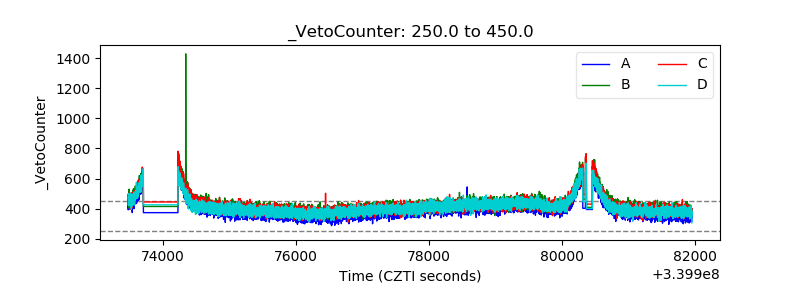 |