| Param | Original file | Final file |
|---|---|---|
| Filename | modeM0/AS1T03_243T01_9000003918_27218cztM0_level2.evt | modeM0/AS1T03_243T01_9000003918_27218cztM0_level2_quad_clean.evt |
| Size (bytes) | 639,408,960 | 113,135,040 |
| Size | 609.8 MB | 107.9 MB |
| Events in quadrant A | 4,414,644 | 720,529 |
| Events in quadrant B | 4,386,632 | 735,722 |
| Events in quadrant C | 4,279,964 | 698,046 |
| Events in quadrant D | 5,688,845 | 662,926 |
| Mode M9 | |||
|---|---|---|---|
| Quadrant | BADHDUFLAG | Total packets | Discarded packets |
| A | 0 | 4 | 0 |
| B | 0 | 4 | 0 |
| C | 0 | 4 | 0 |
| D | 0 | 4 | 0 |
| Mode M0 | |||
|---|---|---|---|
| Quadrant | BADHDUFLAG | Total packets | Discarded packets |
| A | 0 | 18724 | 0 |
| B | 0 | 18550 | 0 |
| C | 0 | 18306 | 0 |
| D | 0 | 22969 | 0 |
| Quadrant | Total seconds | Saturated seconds | Saturation percentage |
|---|---|---|---|
| A | 8762 | 156 | 1.780415% |
| B | 8763 | 188 | 2.145384% |
| C | 8763 | 189 | 2.156796% |
| D | 8763 | 602 | 6.869793% |
Noise dominated data is calculated using 1-second bins in cleaned event files. If a bin has >2000 counts, and if more than 50% of those come from <1% of pixels, then it is considered to be noise-dominated and hence unusable.
| Quadrant | # 1 sec bins | Bins with >0 counts | Bins with >2000 counts | High rate bins dominated by noise | Noise dominated (total time) | Noise dominated (detector-on time) | Marked lightcurve |
|---|---|---|---|---|---|---|---|
| A | 9177 | 8766 | 5 | 5 | 0.05% | 0.06% | 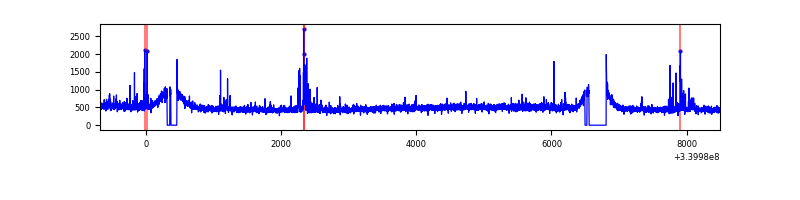 |
| B | 9178 | 8767 | 2 | 2 | 0.02% | 0.02% | 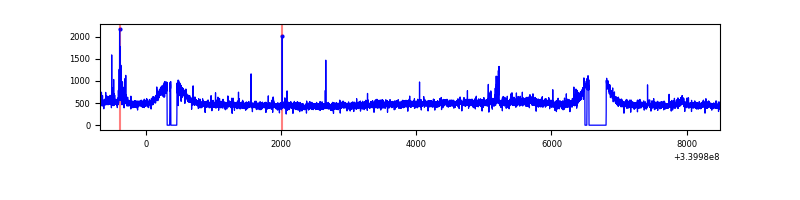 |
| C | 9178 | 8767 | 4 | 4 | 0.04% | 0.05% | 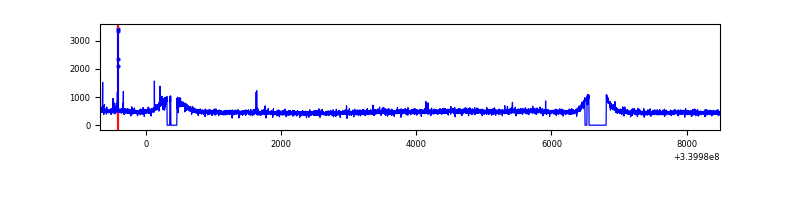 |
| D | 9178 | 8767 | 433 | 433 | 4.72% | 4.94% | 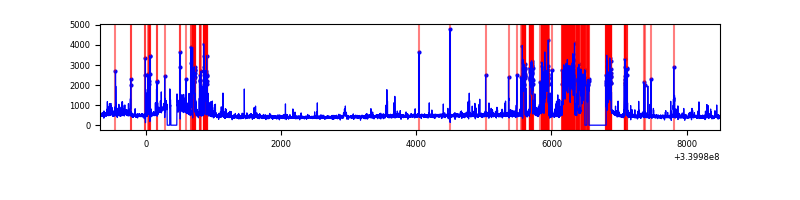 |
Top three noisy pixels from each quadrant. If the there are fewer than three noisy pixels in the level2.evt file, extra rows are filled as -1
| Pixel properties | Quadrant properties | ||||||
|---|---|---|---|---|---|---|---|
| Quadrant | DetID | PixID | Counts | Sigma | Mean | Median | Sigma |
| A | 14 | 235 | 100761 | 452.23 | 1092 | 1067 | 220.4 |
| A | 15 | 174 | 43929 | 194.43 | 1092 | 1067 | 220.4 |
| A | 13 | 248 | 23423 | 101.41 | 1092 | 1067 | 220.4 |
| B | 15 | 33 | 70747 | 327.55 | 1091 | 1062 | 212.7 |
| B | 12 | 111 | 26023 | 117.33 | 1091 | 1062 | 212.7 |
| B | 11 | 111 | 23026 | 103.24 | 1091 | 1062 | 212.7 |
| C | 14 | 238 | 165342 | 667.58 | 1042 | 1048 | 246.1 |
| C | 15 | 208 | 37689 | 148.88 | 1042 | 1048 | 246.1 |
| C | 13 | 61 | 7074 | 24.49 | 1042 | 1048 | 246.1 |
| D | 1 | 52 | 1366748 | 5331.41 | 1026 | 1004 | 256.2 |
| D | 2 | 250 | 148669 | 576.43 | 1026 | 1004 | 256.2 |
| D | 12 | 233 | 77122 | 297.14 | 1026 | 1004 | 256.2 |
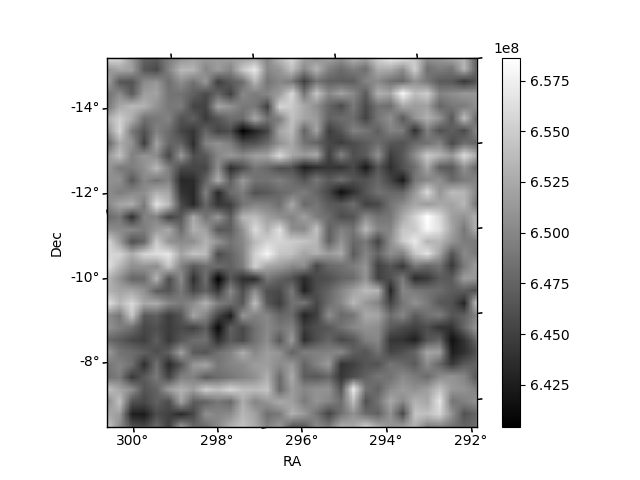
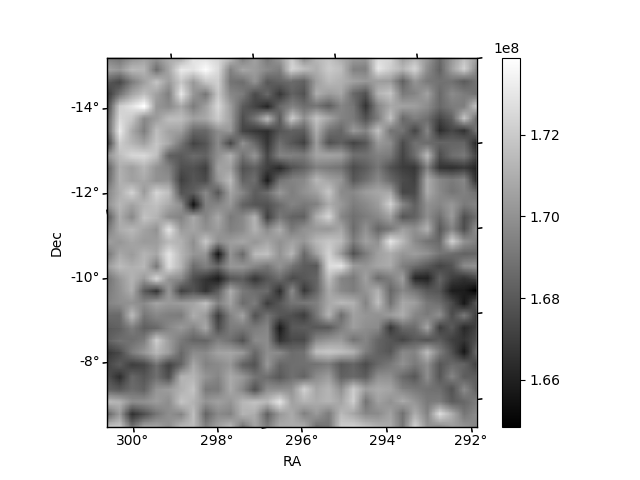
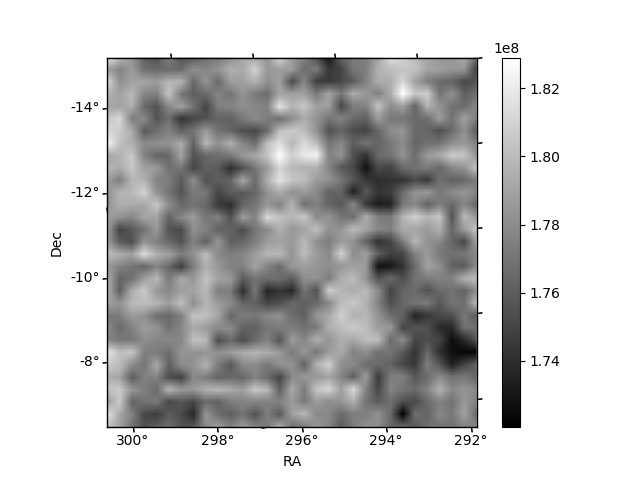
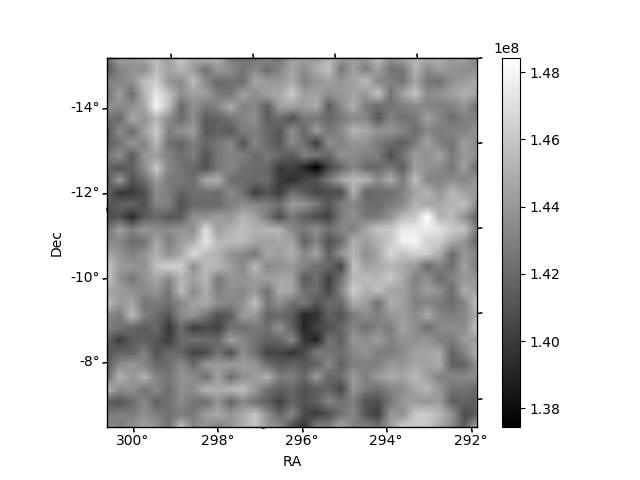
Histogram calculated using DETX and DETY for each event in the final _common_clean file
| Quadrant A | 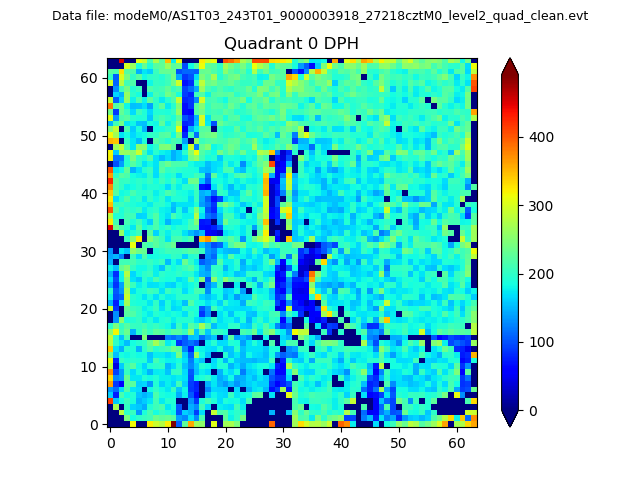 |
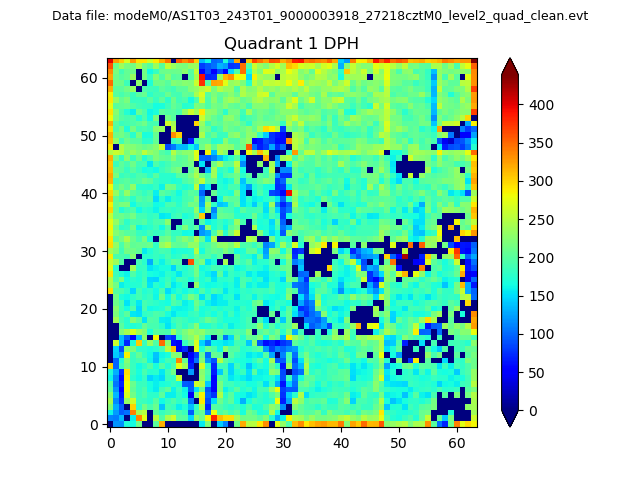 |
Quadrant B |
|---|---|---|---|
| Quadrant D |  |
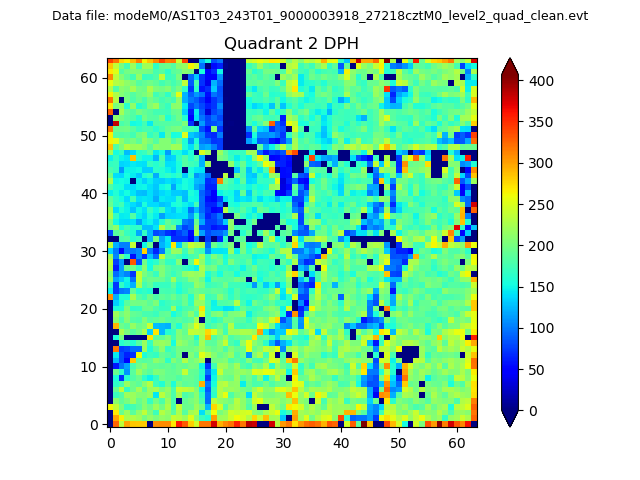 |
Quadrant C |
| Plot type | Count rate plots | Images |
|---|---|---|
| Comparison with Poisson distribution Blue bars denote a histogram of data divided into 1 sec bins. Red curve is a Poisson curve with rate = median count rate of data. |
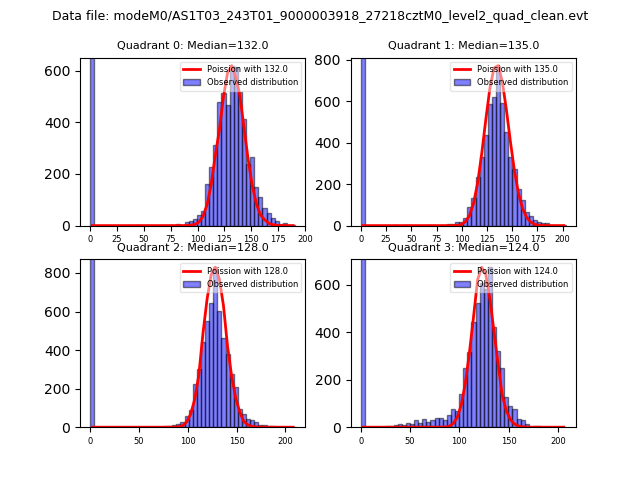 |
 |
| Quadrant-wise count rates Data is divided into 100 sec bins |
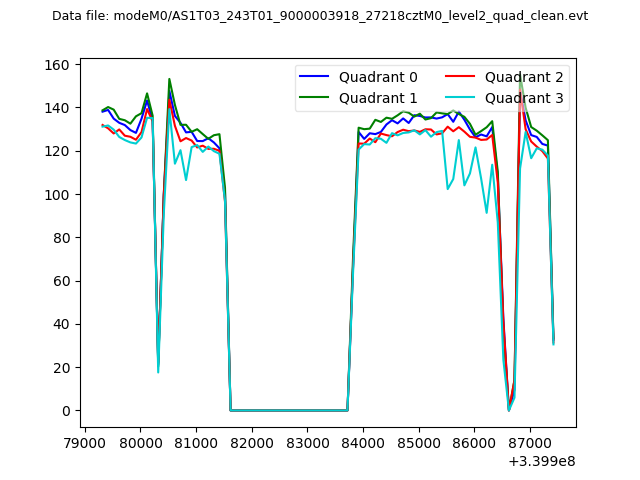 |
|
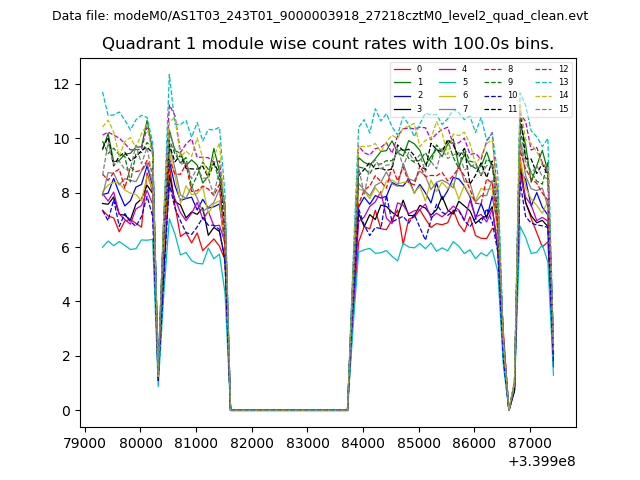
| Module-wise count rates for Quadrant A Data is divided into 100 sec bins |
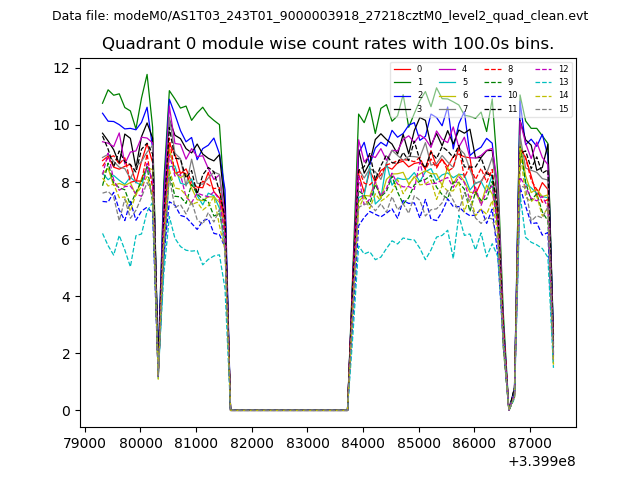 |
 |
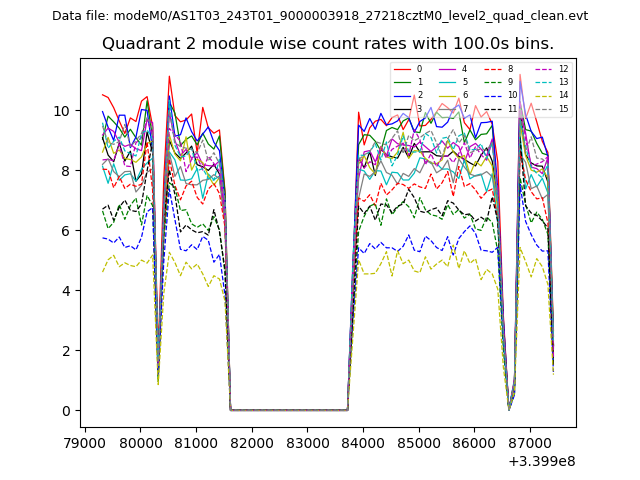
| Module-wise count rates for Quadrant B Data is divided into 100 sec bins |
 |
 |
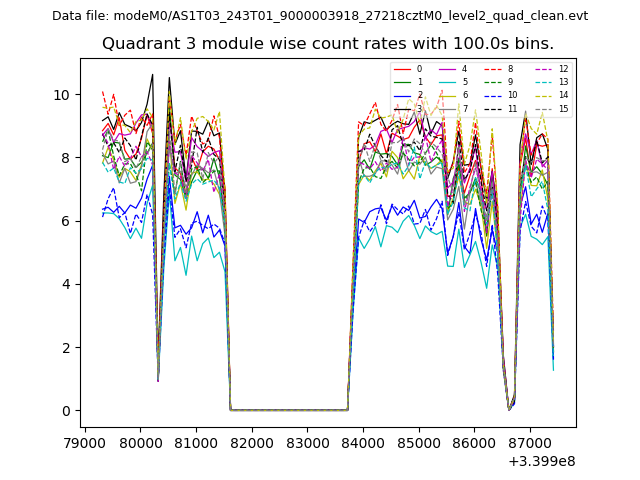
| Module-wise count rates for Quadrant C Data is divided into 100 sec bins |
 |
 |
| Module-wise count rates for Quadrant D Data is divided into 100 sec bins |
 |
 |
| Parameter | Plot |
|---|---|
| CZT HV Monitor | 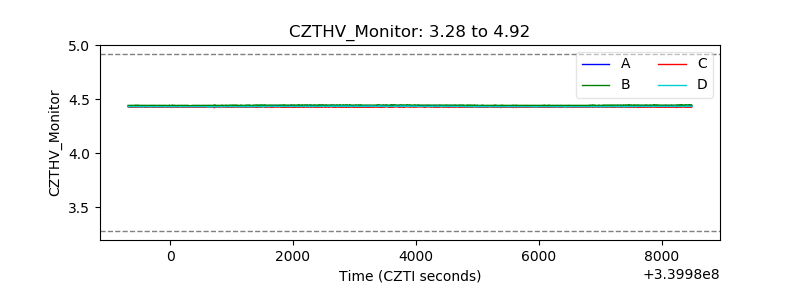 |
| D_VDD | 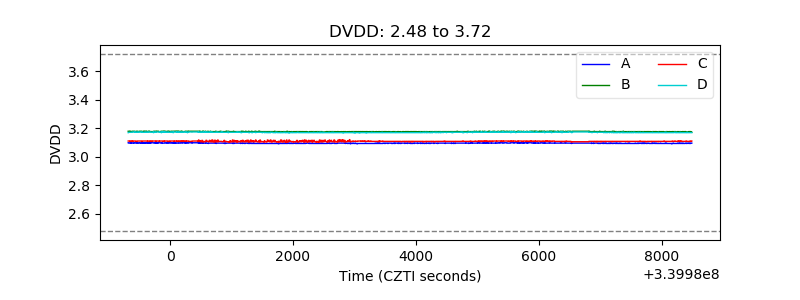 |
| Temperature 1 | 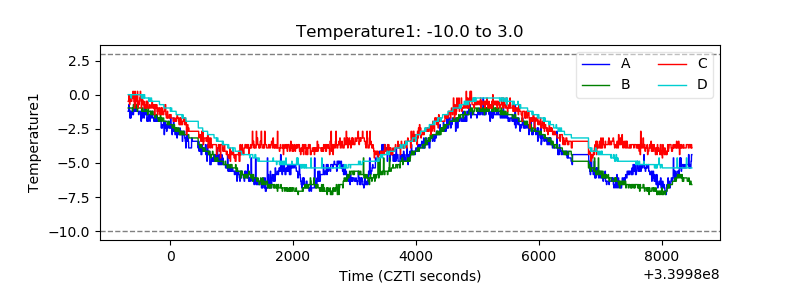 |
| Veto HV Monitor | 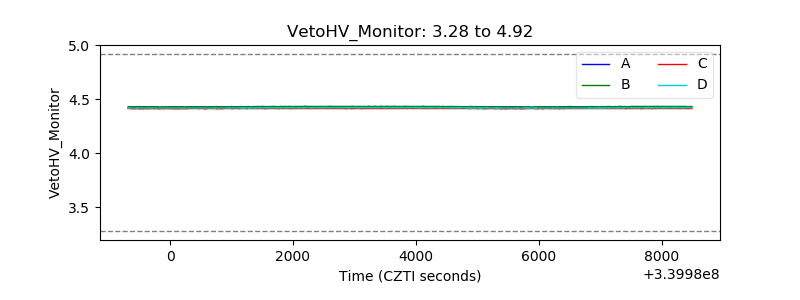 |
| Veto LLD | 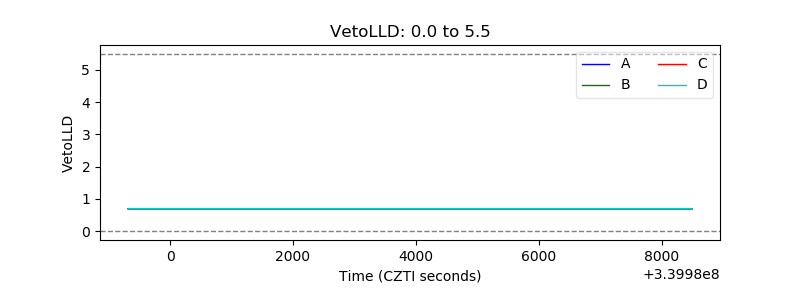 |
| Alpha Counter | 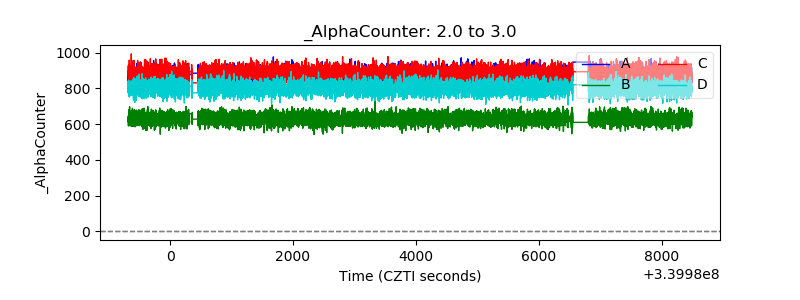 |
| _CPM_Rate | 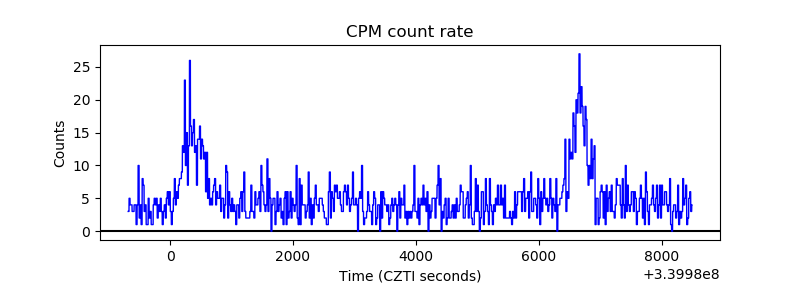 |
| CZT Counter | 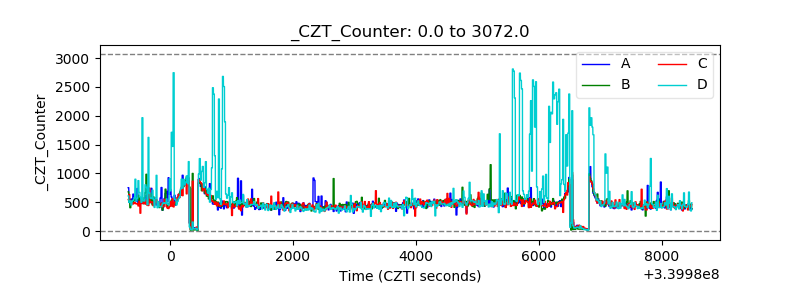 |
| +2.5 Volts monitor |  |
| +5 Volts monitor |  |
| _ROLL_ROT | 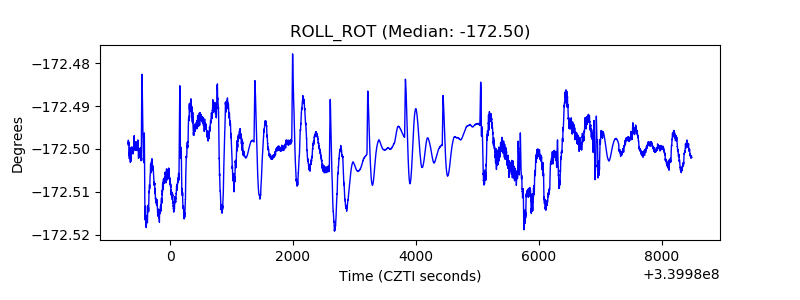 |
| _Roll_DEC | 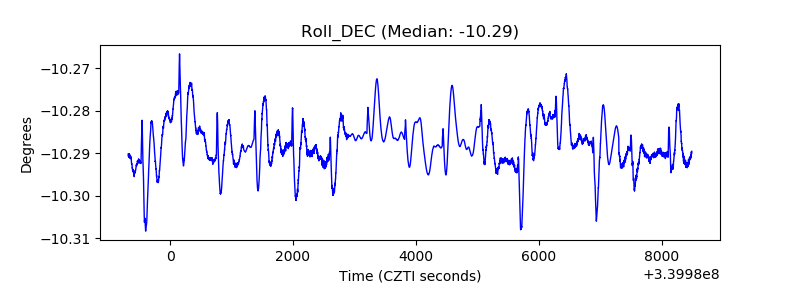 |
| _Roll_RA | 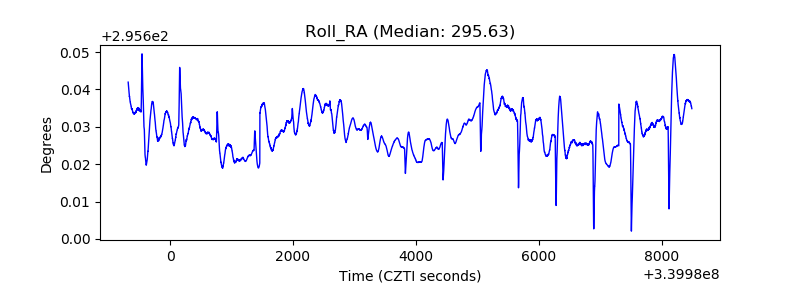 |
| Veto Counter |  |