| Param | Original file | Final file |
|---|---|---|
| Filename | modeM0/AS1T03_243T01_9000003918_27221cztM0_level2.evt | modeM0/AS1T03_243T01_9000003918_27221cztM0_level2_quad_clean.evt |
| Size (bytes) | 1,613,986,560 | 210,867,840 |
| Size | 1.5 GB | 201.1 MB |
| Events in quadrant A | 9,157,288 | 1,377,635 |
| Events in quadrant B | 9,113,478 | 1,406,644 |
| Events in quadrant C | 8,946,185 | 1,345,805 |
| Events in quadrant D | 20,397,124 | 963,458 |
| Mode M9 | |||
|---|---|---|---|
| Quadrant | BADHDUFLAG | Total packets | Discarded packets |
| A | 0 | 21 | 0 |
| B | 0 | 21 | 0 |
| C | 0 | 21 | 0 |
| D | 0 | 21 | 0 |
| Mode M0 | |||
|---|---|---|---|
| Quadrant | BADHDUFLAG | Total packets | Discarded packets |
| A | 0 | 39043 | 0 |
| B | 0 | 38646 | 0 |
| C | 0 | 38428 | 0 |
| D | 0 | 73301 | 0 |
| Quadrant | Total seconds | Saturated seconds | Saturation percentage |
|---|---|---|---|
| A | 18727 | 202 | 1.078656% |
| B | 18728 | 225 | 1.201410% |
| C | 18728 | 272 | 1.452371% |
| D | 18728 | 5362 | 28.630927% |
Noise dominated data is calculated using 1-second bins in cleaned event files. If a bin has >2000 counts, and if more than 50% of those come from <1% of pixels, then it is considered to be noise-dominated and hence unusable.
| Quadrant | # 1 sec bins | Bins with >0 counts | Bins with >2000 counts | High rate bins dominated by noise | Noise dominated (total time) | Noise dominated (detector-on time) | Marked lightcurve |
|---|---|---|---|---|---|---|---|
| A | 20892 | 18732 | 2 | 2 | 0.01% | 0.01% | 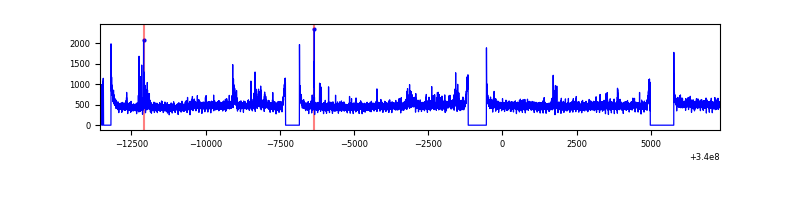 |
| B | 20893 | 18733 | 1 | 1 | 0.00% | 0.01% | 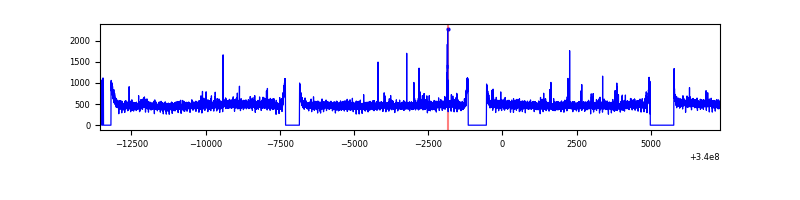 |
| C | 20893 | 18733 | 3 | 3 | 0.01% | 0.02% | 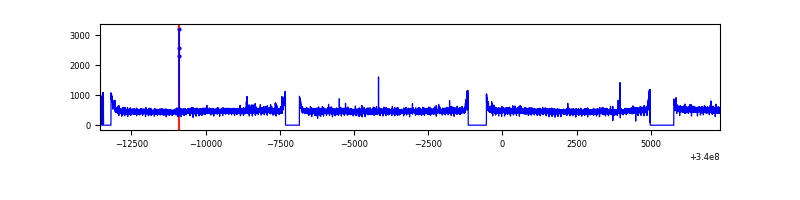 |
| D | 20893 | 18726 | 3640 | 3640 | 17.42% | 19.44% | 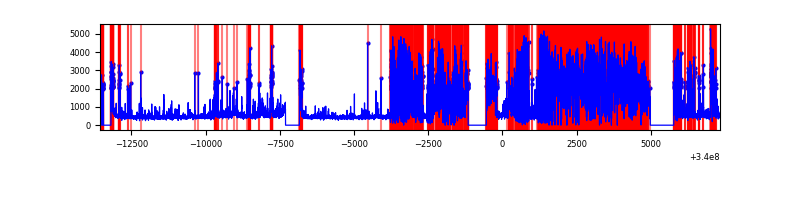 |
Top three noisy pixels from each quadrant. If the there are fewer than three noisy pixels in the level2.evt file, extra rows are filled as -1
| Pixel properties | Quadrant properties | ||||||
|---|---|---|---|---|---|---|---|
| Quadrant | DetID | PixID | Counts | Sigma | Mean | Median | Sigma |
| A | 0 | 13 | 141708 | 302.65 | 2295 | 2247 | 460.8 |
| A | 15 | 174 | 78011 | 164.42 | 2295 | 2247 | 460.8 |
| A | 14 | 235 | 58630 | 122.36 | 2295 | 2247 | 460.8 |
| B | 12 | 111 | 55264 | 119.9 | 2290 | 2229 | 442.3 |
| B | 11 | 111 | 49732 | 107.4 | 2290 | 2229 | 442.3 |
| B | 14 | 111 | 44999 | 96.7 | 2290 | 2229 | 442.3 |
| C | 14 | 238 | 351062 | 676.92 | 2198 | 2212 | 515.3 |
| C | 15 | 208 | 30096 | 54.11 | 2198 | 2212 | 515.3 |
| C | 13 | 61 | 14872 | 24.57 | 2198 | 2212 | 515.3 |
| D | 1 | 52 | 12701459 | 29019.26 | 1830 | 1789 | 437.6 |
| D | 2 | 250 | 323179 | 734.39 | 1830 | 1789 | 437.6 |
| D | 7 | 38 | 165945 | 375.1 | 1830 | 1789 | 437.6 |
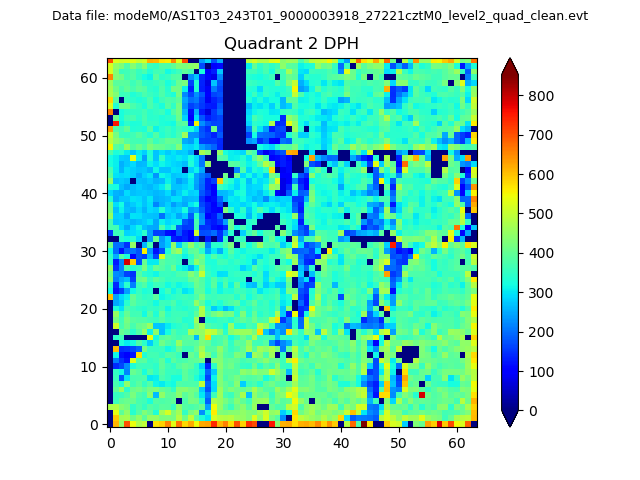
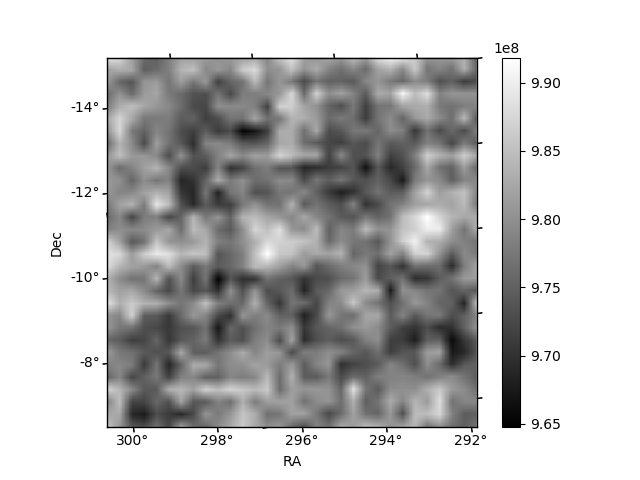
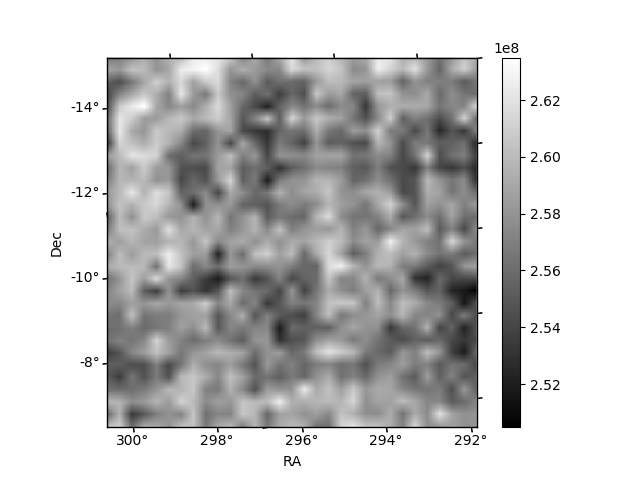
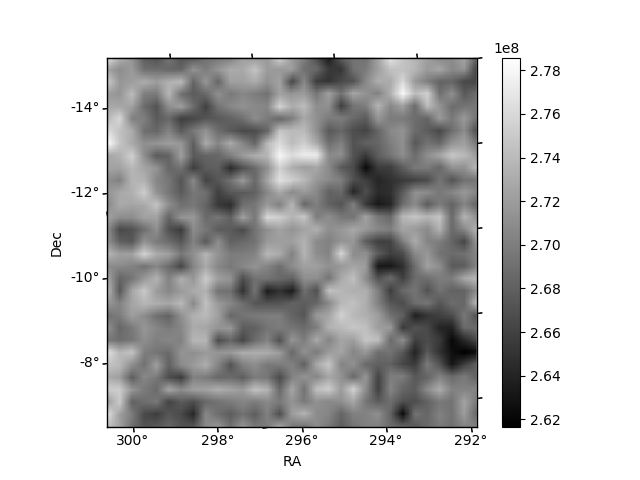
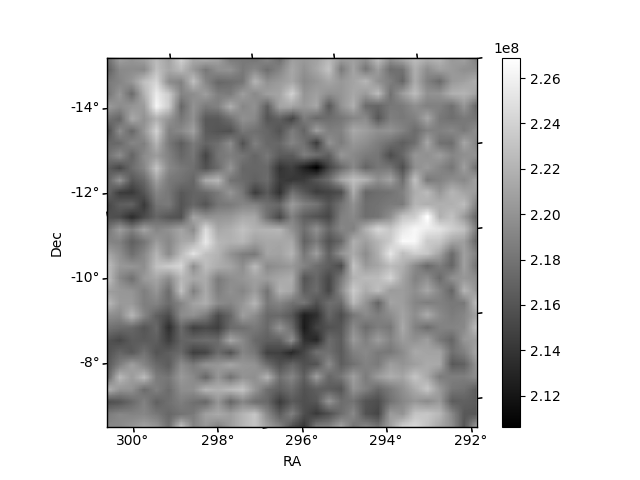
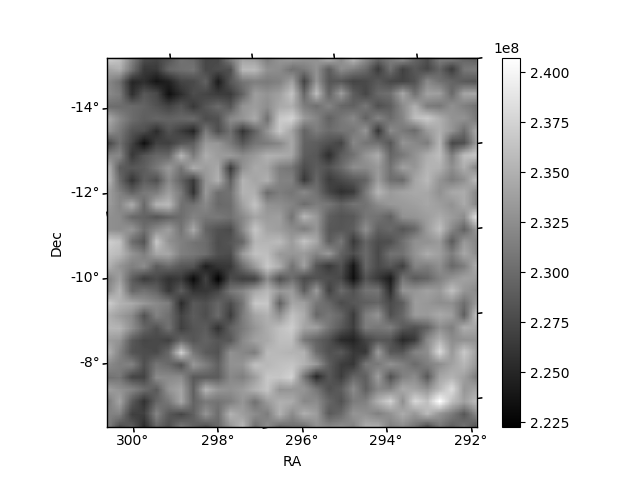
Histogram calculated using DETX and DETY for each event in the final _common_clean file
| Quadrant A | 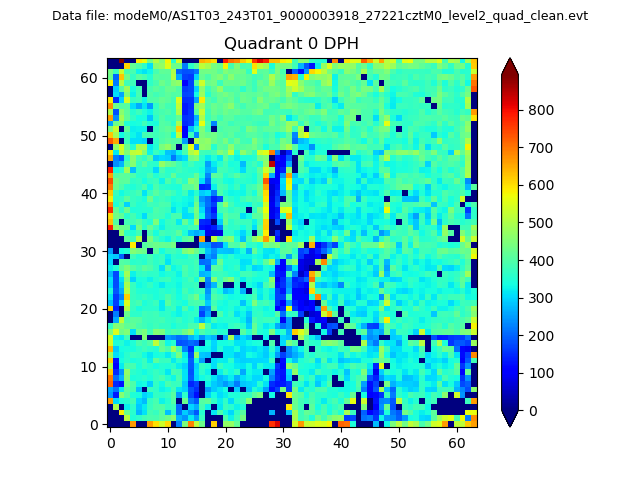 |
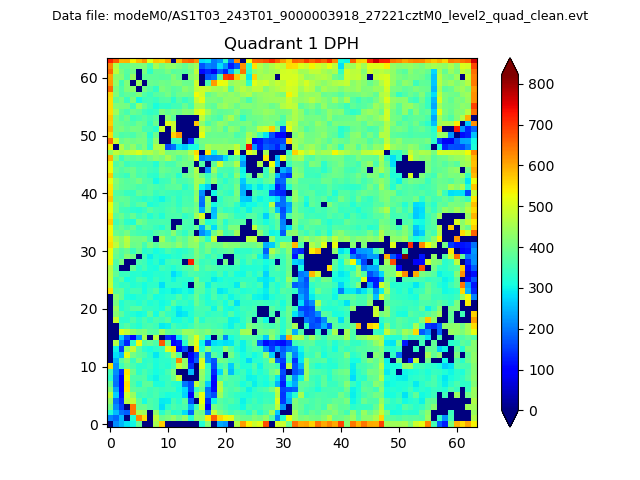 |
Quadrant B |
|---|---|---|---|
| Quadrant D | 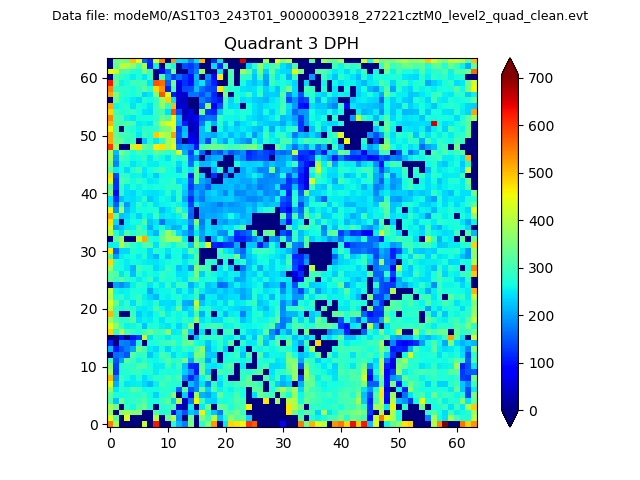 |
 |
Quadrant C |
| Plot type | Count rate plots | Images |
|---|---|---|
| Comparison with Poisson distribution Blue bars denote a histogram of data divided into 1 sec bins. Red curve is a Poisson curve with rate = median count rate of data. |
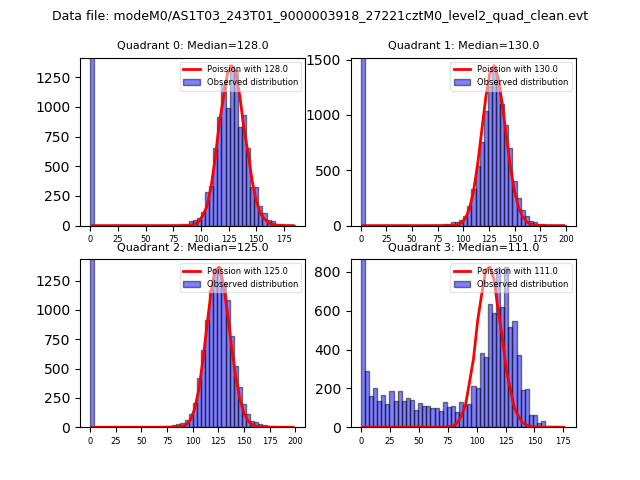 |
 |
| Quadrant-wise count rates Data is divided into 100 sec bins |
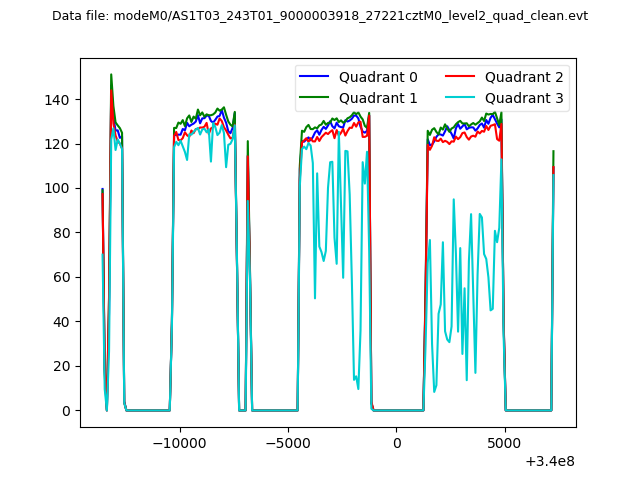 |
|
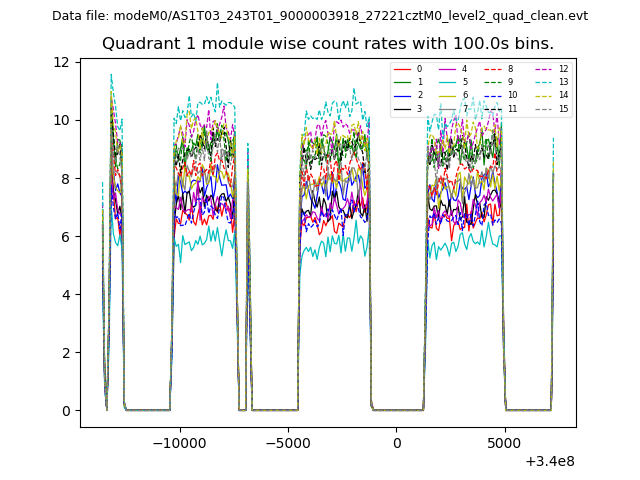
| Module-wise count rates for Quadrant A Data is divided into 100 sec bins |
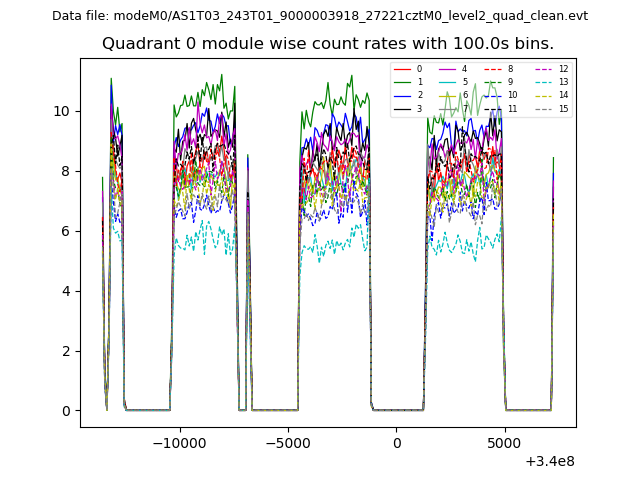 |
 |
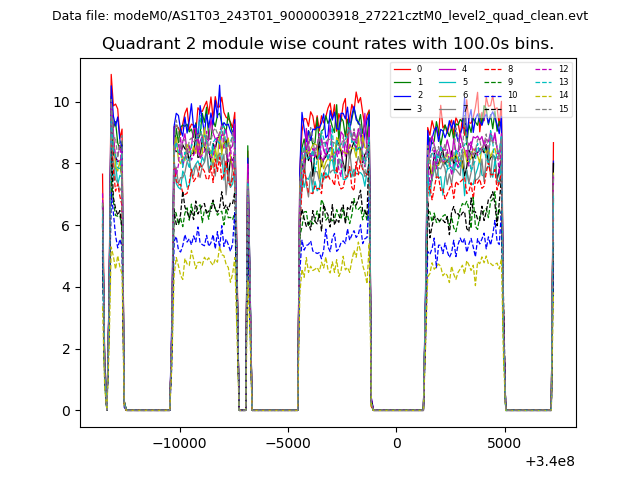
| Module-wise count rates for Quadrant B Data is divided into 100 sec bins |
 |
 |
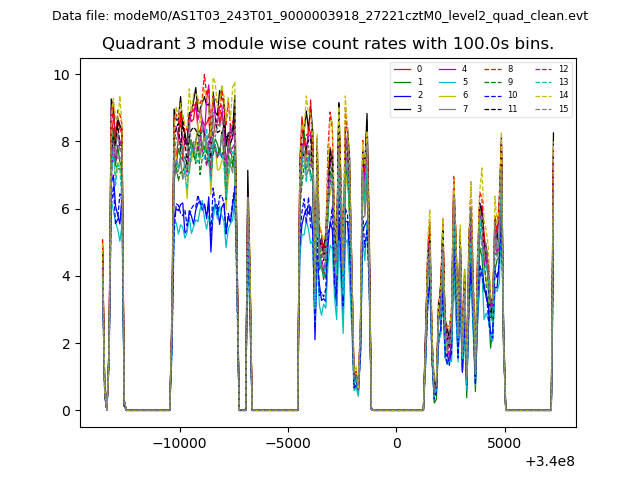
| Module-wise count rates for Quadrant C Data is divided into 100 sec bins |
 |
 |
| Module-wise count rates for Quadrant D Data is divided into 100 sec bins |
 |
 |
| Parameter | Plot |
|---|---|
| CZT HV Monitor | 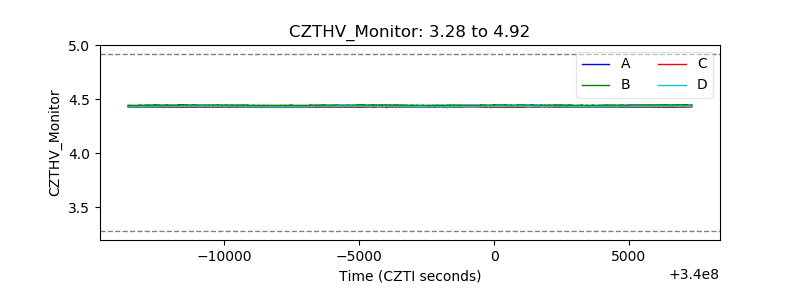 |
| D_VDD | 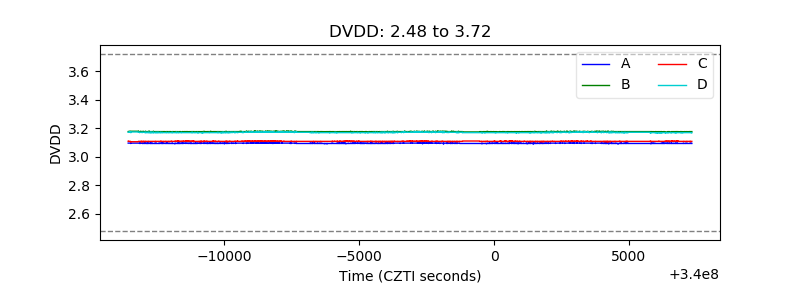 |
| Temperature 1 | 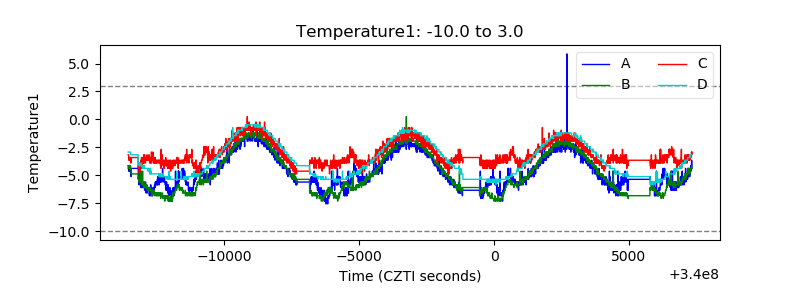 |
| Veto HV Monitor | 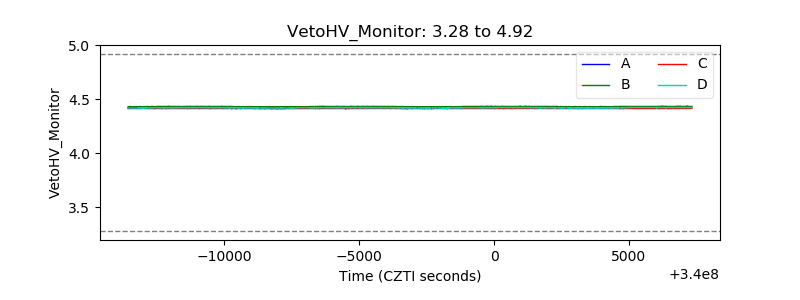 |
| Veto LLD | 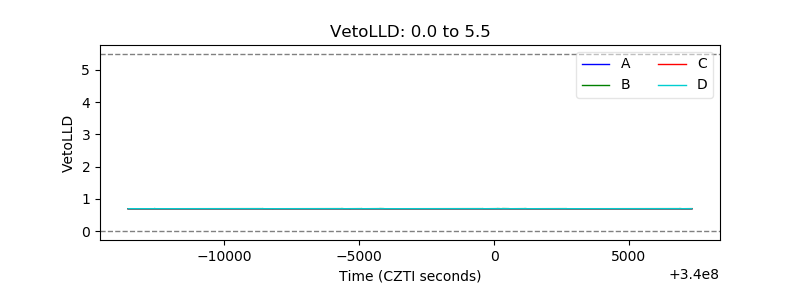 |
| Alpha Counter | 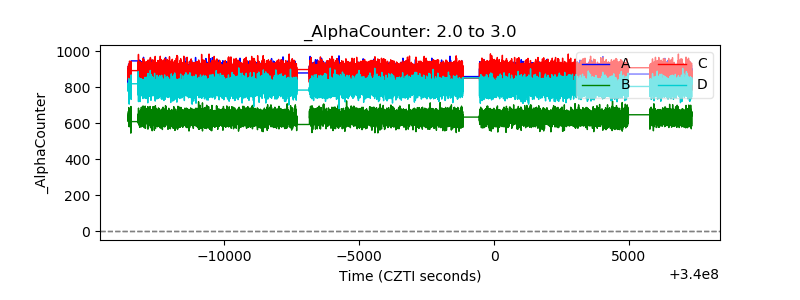 |
| _CPM_Rate | 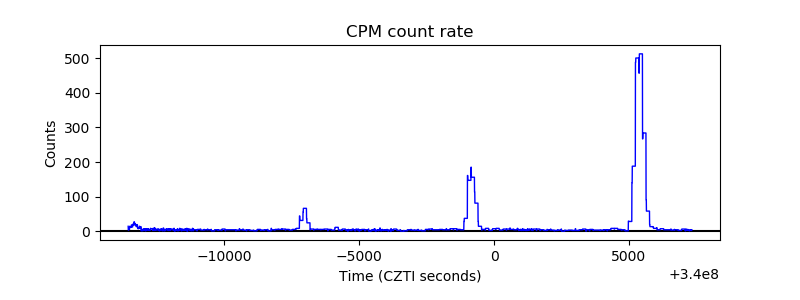 |
| CZT Counter |  |
| +2.5 Volts monitor |  |
| +5 Volts monitor |  |
| _ROLL_ROT | 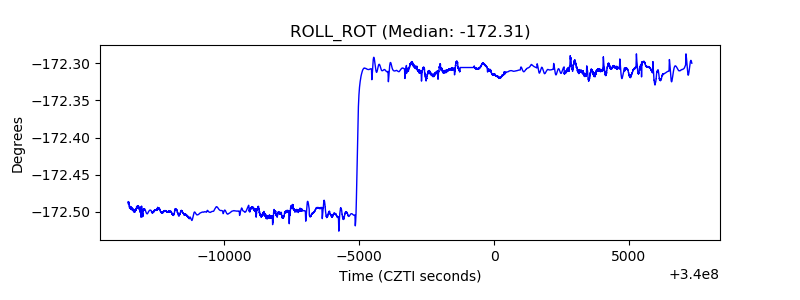 |
| _Roll_DEC | 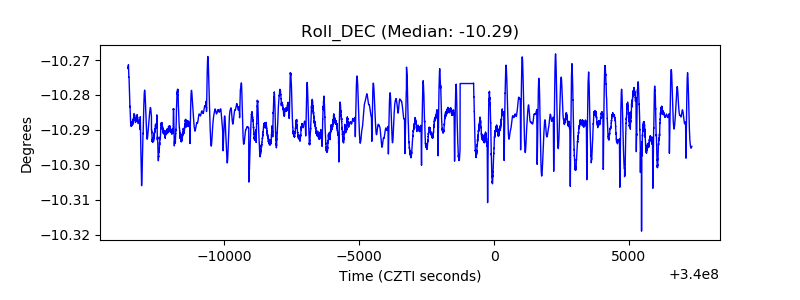 |
| _Roll_RA | 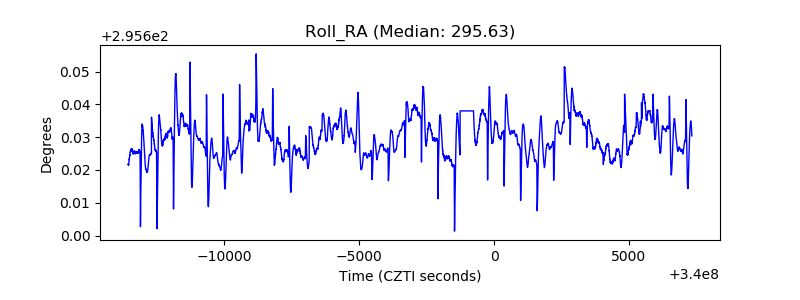 |
| Veto Counter | 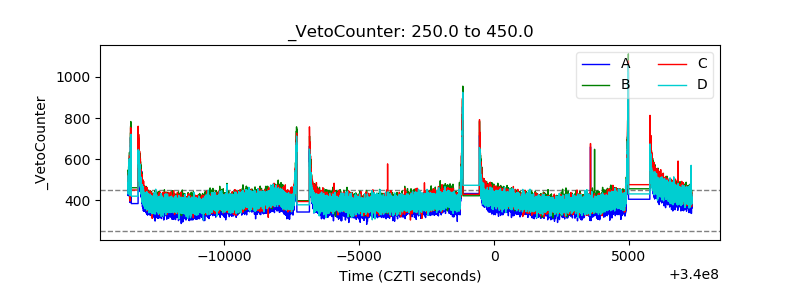 |