| Param | Original file | Final file |
|---|---|---|
| Filename | modeM0/AS1T03_243T01_9000003918_27222cztM0_level2.evt | modeM0/AS1T03_243T01_9000003918_27222cztM0_level2_quad_clean.evt |
| Size (bytes) | 532,676,160 | 81,722,880 |
| Size | 508.0 MB | 77.9 MB |
| Events in quadrant A | 3,370,079 | 511,983 |
| Events in quadrant B | 3,371,543 | 521,460 |
| Events in quadrant C | 3,331,307 | 495,493 |
| Events in quadrant D | 5,603,193 | 477,196 |
| Mode M9 | |||
|---|---|---|---|
| Quadrant | BADHDUFLAG | Total packets | Discarded packets |
| A | 0 | 13 | 0 |
| B | 0 | 14 | 0 |
| C | 0 | 14 | 0 |
| D | 0 | 14 | 0 |
| Mode M0 | |||
|---|---|---|---|
| Quadrant | BADHDUFLAG | Total packets | Discarded packets |
| A | 0 | 14137 | 0 |
| B | 0 | 14091 | 0 |
| C | 0 | 14039 | 0 |
| D | 0 | 21089 | 0 |
| Quadrant | Total seconds | Saturated seconds | Saturation percentage |
|---|---|---|---|
| A | 6728 | 71 | 1.055291% |
| B | 6728 | 76 | 1.129608% |
| C | 6728 | 102 | 1.516052% |
| D | 6728 | 666 | 9.898930% |
Noise dominated data is calculated using 1-second bins in cleaned event files. If a bin has >2000 counts, and if more than 50% of those come from <1% of pixels, then it is considered to be noise-dominated and hence unusable.
| Quadrant | # 1 sec bins | Bins with >0 counts | Bins with >2000 counts | High rate bins dominated by noise | Noise dominated (total time) | Noise dominated (detector-on time) | Marked lightcurve |
|---|---|---|---|---|---|---|---|
| A | 7698 | 6729 | 0 | 0 | 0.00% | 0.00% | 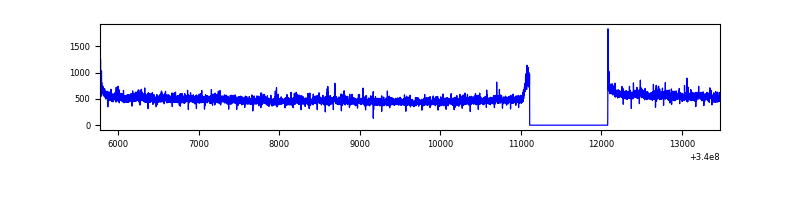 |
| B | 7698 | 6729 | 0 | 0 | 0.00% | 0.00% | 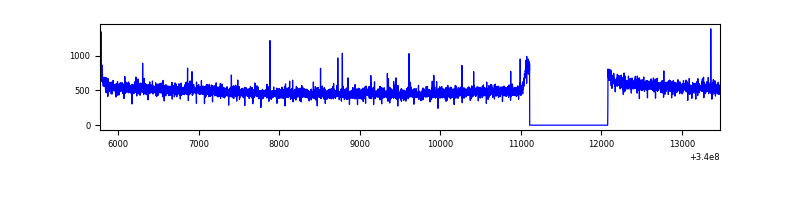 |
| C | 7698 | 6729 | 0 | 0 | 0.00% | 0.00% | 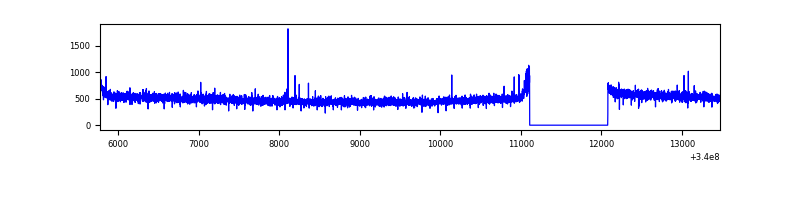 |
| D | 7698 | 6729 | 463 | 463 | 6.01% | 6.88% | 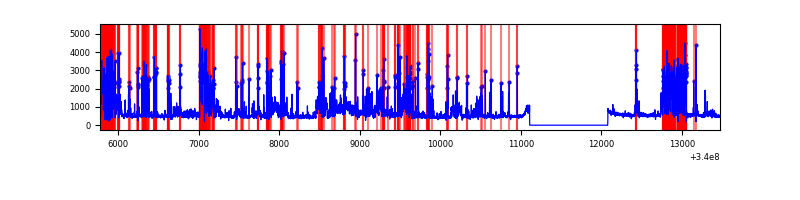 |
Top three noisy pixels from each quadrant. If the there are fewer than three noisy pixels in the level2.evt file, extra rows are filled as -1
| Pixel properties | Quadrant properties | ||||||
|---|---|---|---|---|---|---|---|
| Quadrant | DetID | PixID | Counts | Sigma | Mean | Median | Sigma |
| A | 0 | 13 | 50783 | 290.39 | 856 | 838 | 172.0 |
| A | 8 | 192 | 11856 | 64.06 | 856 | 838 | 172.0 |
| A | 13 | 254 | 9574 | 50.79 | 856 | 838 | 172.0 |
| B | 12 | 111 | 20286 | 119.27 | 851 | 831 | 163.1 |
| B | 11 | 111 | 18353 | 107.42 | 851 | 831 | 163.1 |
| B | 0 | 230 | 17435 | 101.79 | 851 | 831 | 163.1 |
| C | 14 | 238 | 131716 | 686.2 | 816 | 820 | 190.8 |
| C | 15 | 208 | 15698 | 78.0 | 816 | 820 | 190.8 |
| C | 13 | 61 | 5396 | 23.99 | 816 | 820 | 190.8 |
| D | 1 | 52 | 2507596 | 12884.79 | 786 | 766 | 194.6 |
| D | 2 | 250 | 42233 | 213.14 | 786 | 766 | 194.6 |
| D | 5 | 222 | 29618 | 148.3 | 786 | 766 | 194.6 |
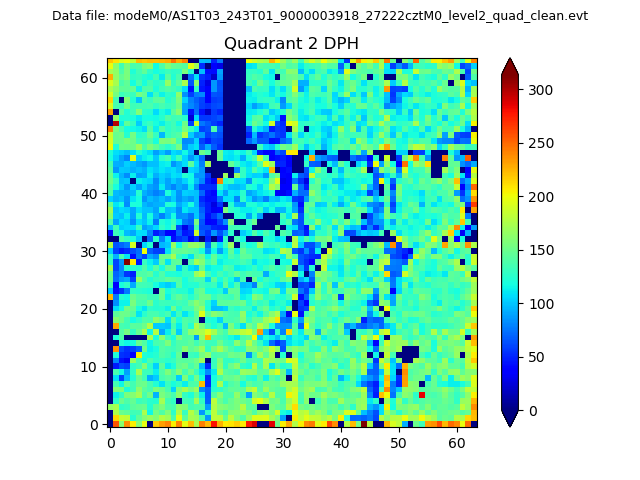
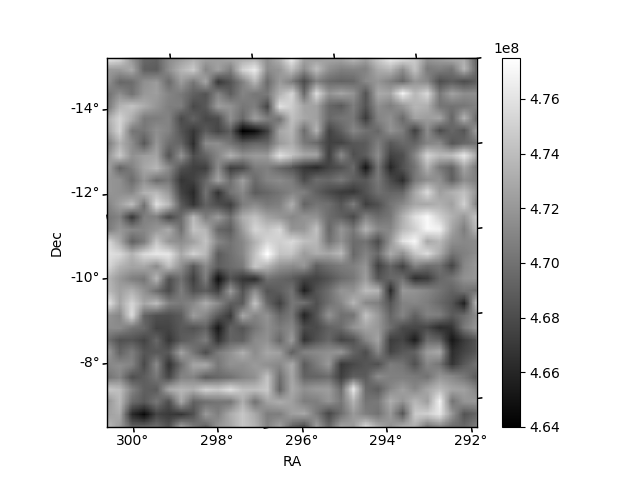
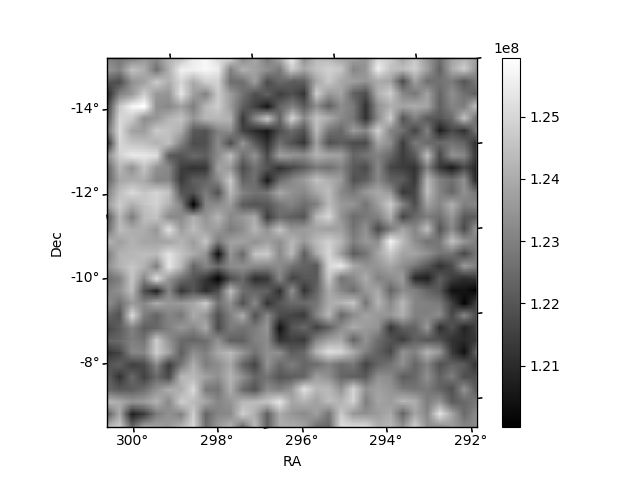
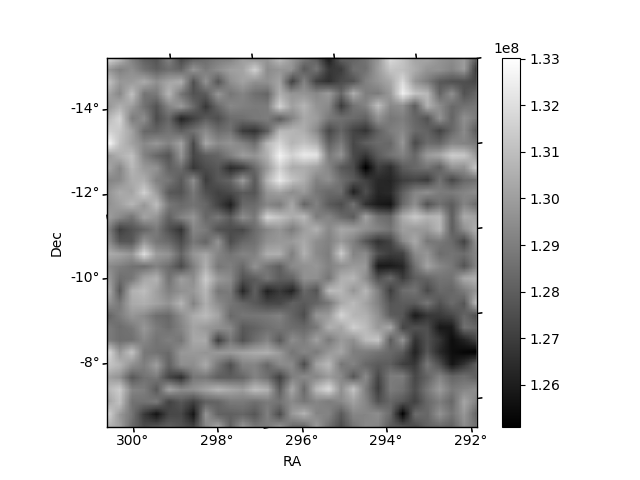
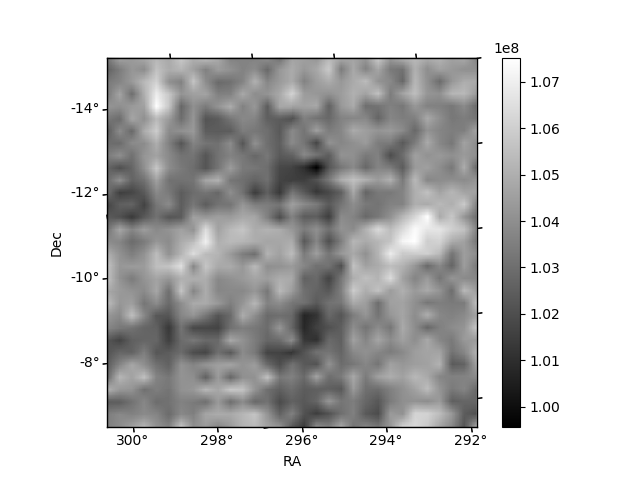
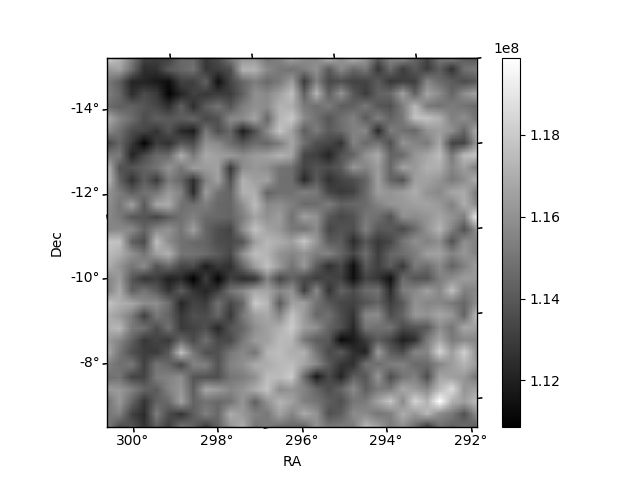
Histogram calculated using DETX and DETY for each event in the final _common_clean file
| Quadrant A | 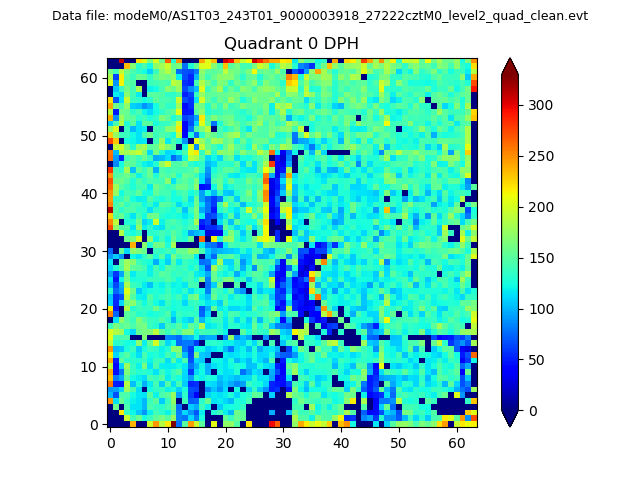 |
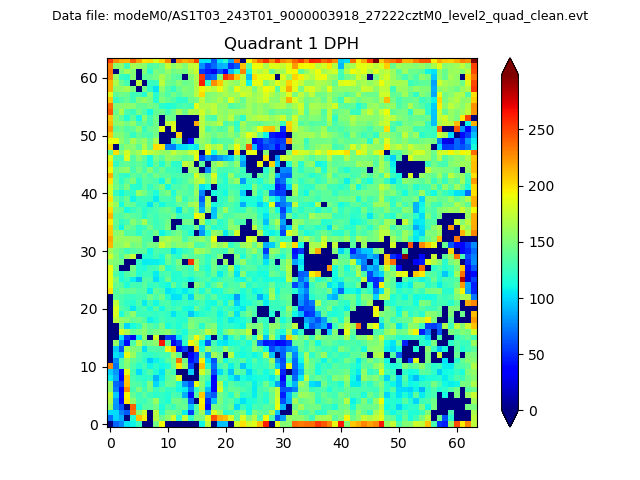 |
Quadrant B |
|---|---|---|---|
| Quadrant D | 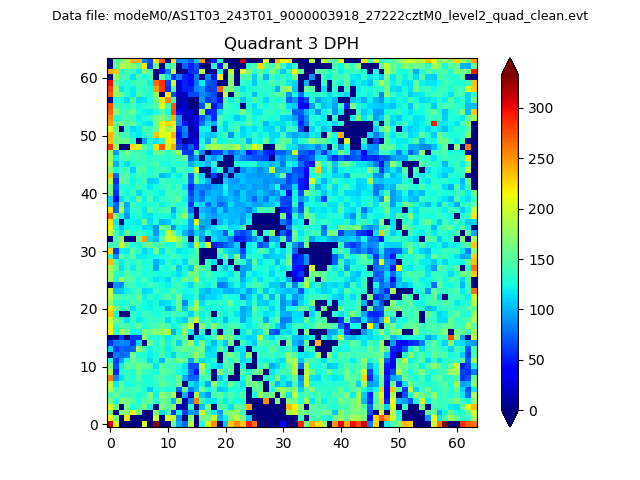 |
 |
Quadrant C |
| Plot type | Count rate plots | Images |
|---|---|---|
| Comparison with Poisson distribution Blue bars denote a histogram of data divided into 1 sec bins. Red curve is a Poisson curve with rate = median count rate of data. |
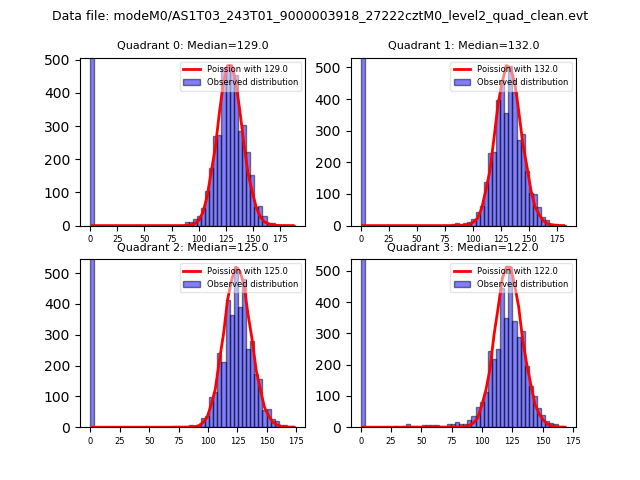 |
 |
| Quadrant-wise count rates Data is divided into 100 sec bins |
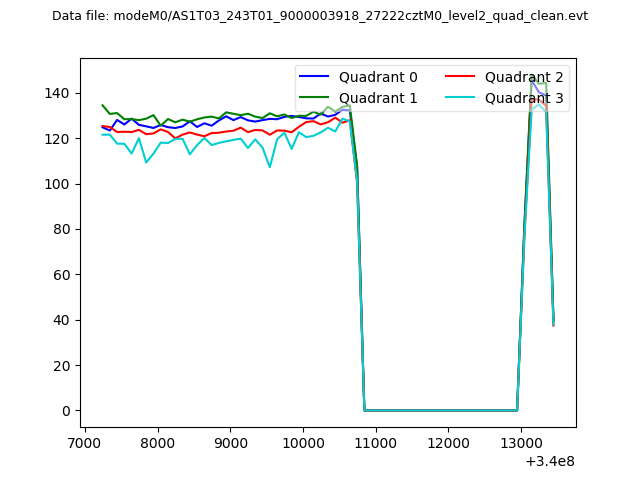 |
|
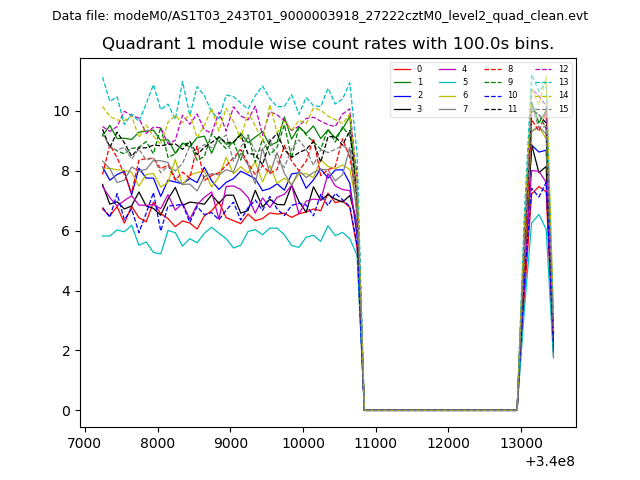
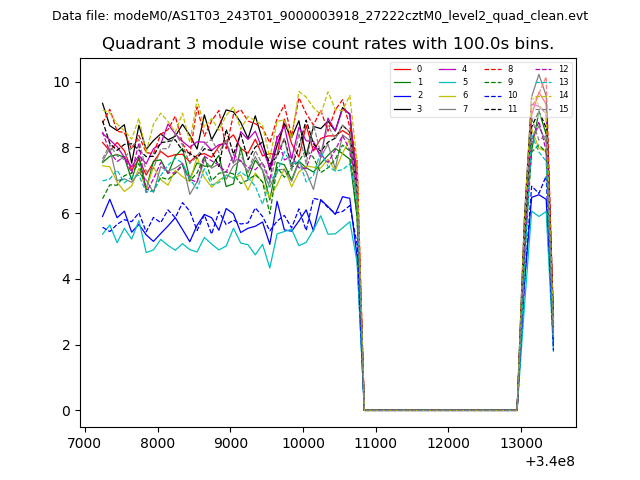
| Module-wise count rates for Quadrant A Data is divided into 100 sec bins |
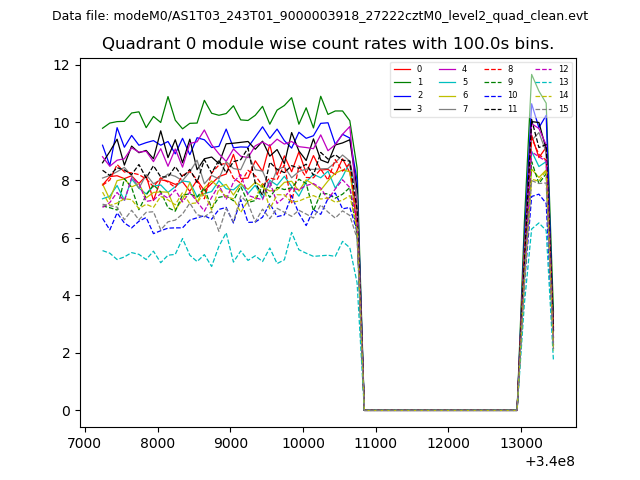 |
 |
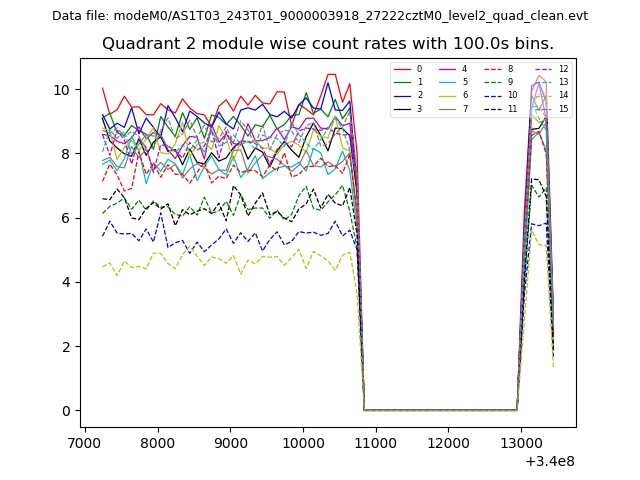
| Module-wise count rates for Quadrant B Data is divided into 100 sec bins |
 |
 |
| Module-wise count rates for Quadrant C Data is divided into 100 sec bins |
 |
 |
| Module-wise count rates for Quadrant D Data is divided into 100 sec bins |
 |
 |
| Parameter | Plot |
|---|---|
| CZT HV Monitor |  |
| D_VDD | 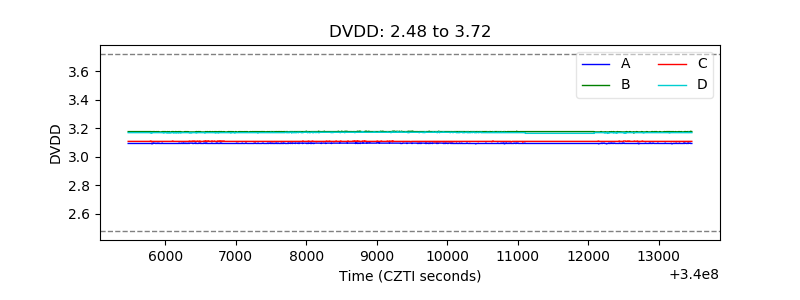 |
| Temperature 1 | 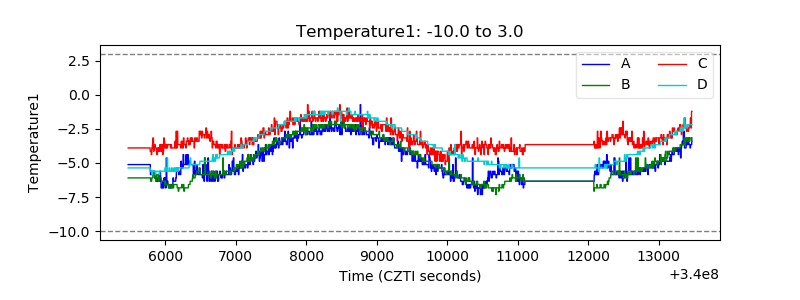 |
| Veto HV Monitor | 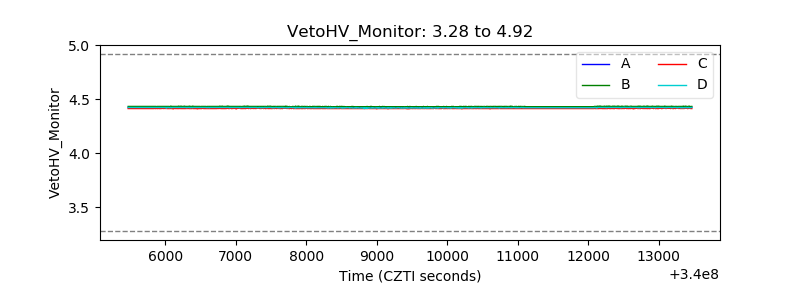 |
| Veto LLD | 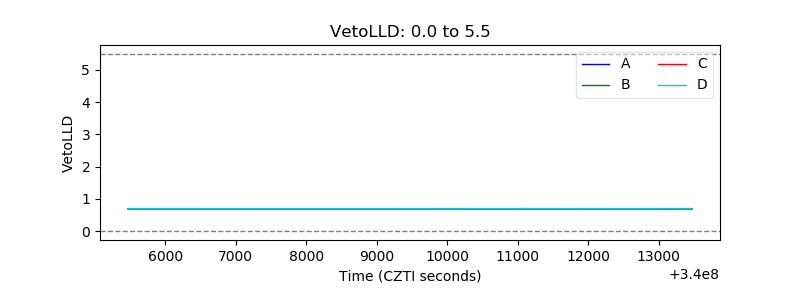 |
| Alpha Counter | 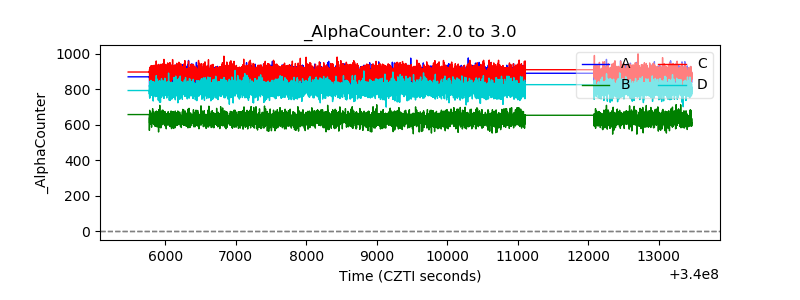 |
| _CPM_Rate | 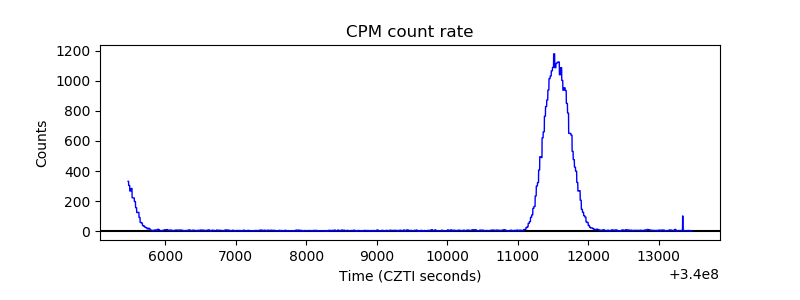 |
| CZT Counter | 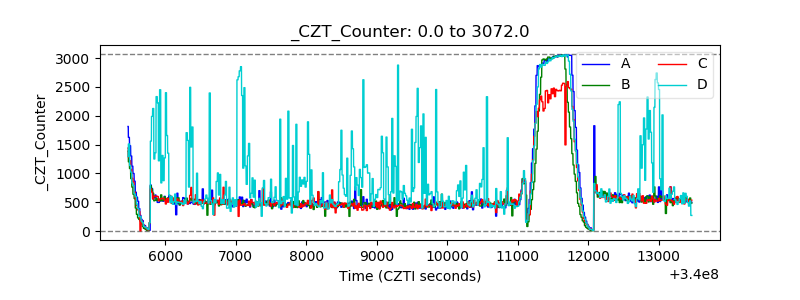 |
| +2.5 Volts monitor |  |
| +5 Volts monitor | 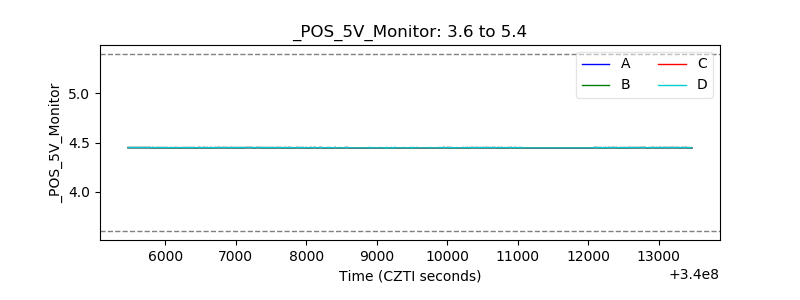 |
| _ROLL_ROT |  |
| _Roll_DEC | 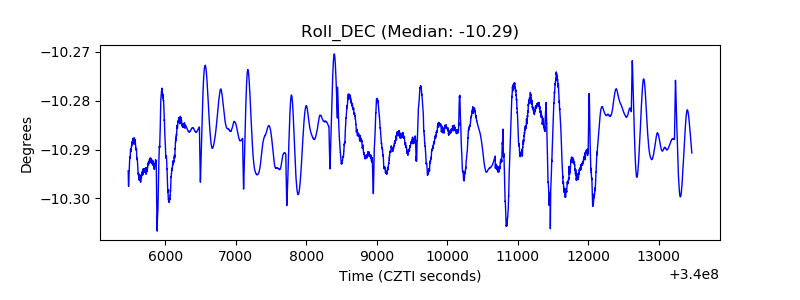 |
| _Roll_RA |  |
| Veto Counter |  |