| Param | Original file | Final file |
|---|---|---|
| Filename | modeM0/AS1T03_243T01_9000003918_27224cztM0_level2.evt | modeM0/AS1T03_243T01_9000003918_27224cztM0_level2_quad_clean.evt |
| Size (bytes) | 479,865,600 | 92,145,600 |
| Size | 457.6 MB | 87.9 MB |
| Events in quadrant A | 3,303,818 | 600,205 |
| Events in quadrant B | 3,295,506 | 609,831 |
| Events in quadrant C | 3,193,994 | 574,637 |
| Events in quadrant D | 4,314,031 | 568,494 |
| Mode M9 | |||
|---|---|---|---|
| Quadrant | BADHDUFLAG | Total packets | Discarded packets |
| A | 0 | 11 | 0 |
| B | 0 | 11 | 0 |
| C | 0 | 11 | 0 |
| D | 0 | 11 | 0 |
| Mode M0 | |||
|---|---|---|---|
| Quadrant | BADHDUFLAG | Total packets | Discarded packets |
| A | 0 | 13863 | 0 |
| B | 0 | 13754 | 0 |
| C | 0 | 13496 | 0 |
| D | 0 | 17012 | 0 |
| Quadrant | Total seconds | Saturated seconds | Saturation percentage |
|---|---|---|---|
| A | 6264 | 65 | 1.037676% |
| B | 6265 | 63 | 1.005587% |
| C | 6265 | 94 | 1.500399% |
| D | 6265 | 283 | 4.517159% |
Noise dominated data is calculated using 1-second bins in cleaned event files. If a bin has >2000 counts, and if more than 50% of those come from <1% of pixels, then it is considered to be noise-dominated and hence unusable.
| Quadrant | # 1 sec bins | Bins with >0 counts | Bins with >2000 counts | High rate bins dominated by noise | Noise dominated (total time) | Noise dominated (detector-on time) | Marked lightcurve |
|---|---|---|---|---|---|---|---|
| A | 7384 | 6265 | 8 | 8 | 0.11% | 0.13% | 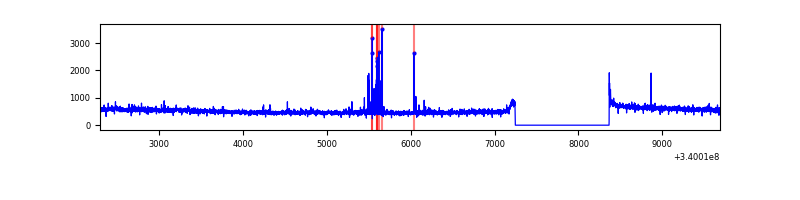 |
| B | 7385 | 6266 | 2 | 2 | 0.03% | 0.03% | 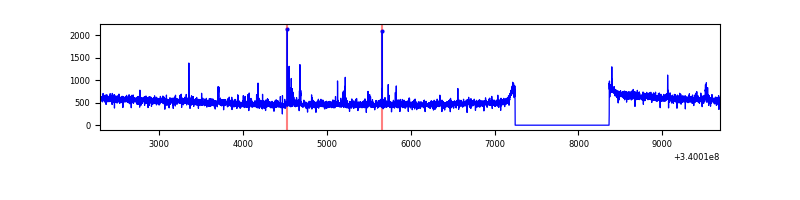 |
| C | 7385 | 6266 | 1 | 1 | 0.01% | 0.02% | 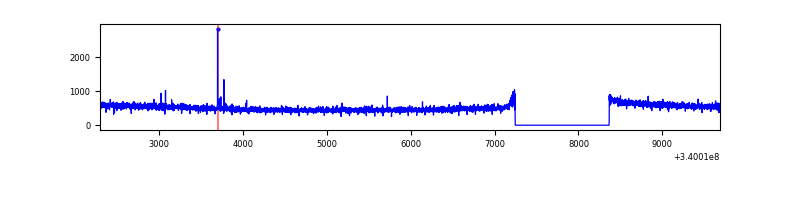 |
| D | 7385 | 6266 | 189 | 189 | 2.56% | 3.02% | 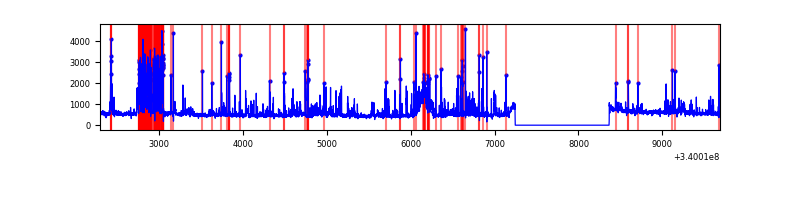 |
Top three noisy pixels from each quadrant. If the there are fewer than three noisy pixels in the level2.evt file, extra rows are filled as -1
| Pixel properties | Quadrant properties | ||||||
|---|---|---|---|---|---|---|---|
| Quadrant | DetID | PixID | Counts | Sigma | Mean | Median | Sigma |
| A | 12 | 96 | 59442 | 351.14 | 829 | 815 | 167.0 |
| A | 0 | 13 | 39356 | 230.83 | 829 | 815 | 167.0 |
| A | 13 | 254 | 8634 | 46.83 | 829 | 815 | 167.0 |
| B | 4 | 171 | 25079 | 155.52 | 820 | 800 | 156.1 |
| B | 0 | 190 | 21420 | 132.09 | 820 | 800 | 156.1 |
| B | 0 | 182 | 19310 | 118.57 | 820 | 800 | 156.1 |
| C | 14 | 238 | 127764 | 692.24 | 783 | 788 | 183.4 |
| C | 15 | 208 | 13917 | 71.58 | 783 | 788 | 183.4 |
| C | 13 | 61 | 5202 | 24.06 | 783 | 788 | 183.4 |
| D | 1 | 52 | 1147458 | 6032.49 | 784 | 766 | 190.1 |
| D | 2 | 250 | 87640 | 457.02 | 784 | 766 | 190.1 |
| D | 12 | 233 | 26244 | 134.03 | 784 | 766 | 190.1 |
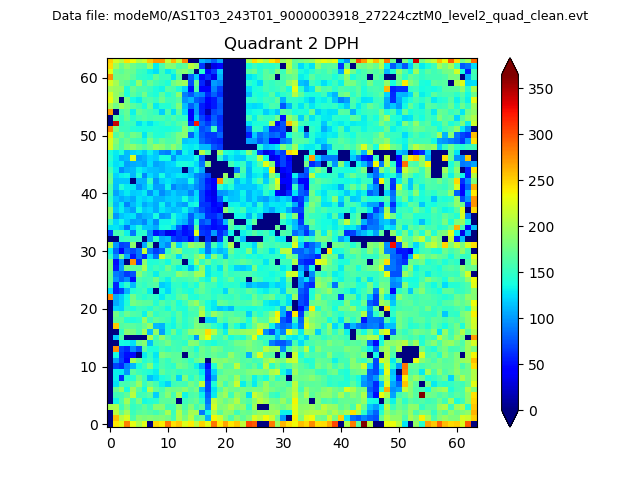
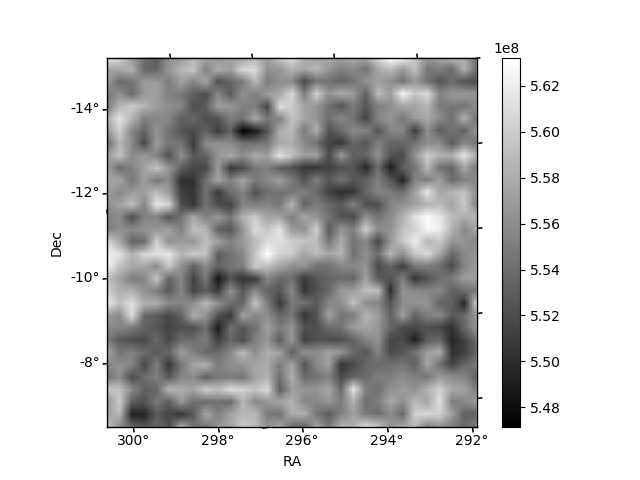
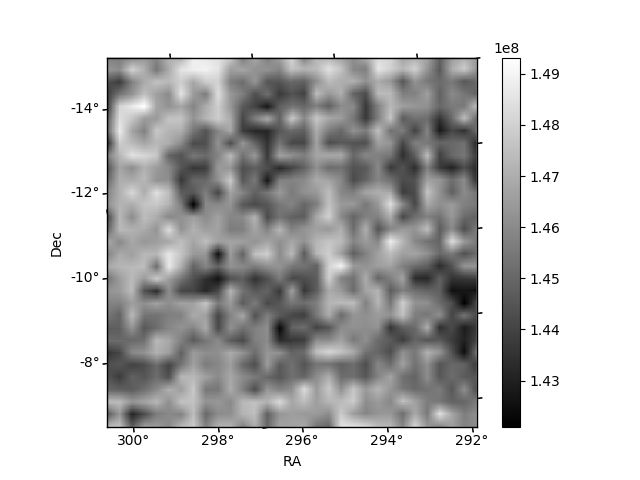
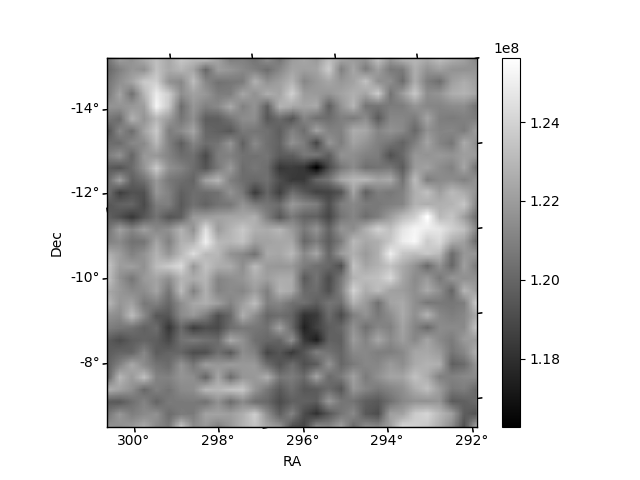
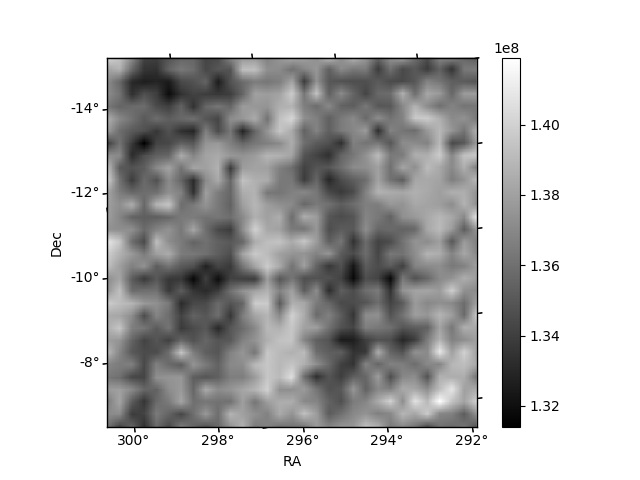
Histogram calculated using DETX and DETY for each event in the final _common_clean file
| Quadrant A | 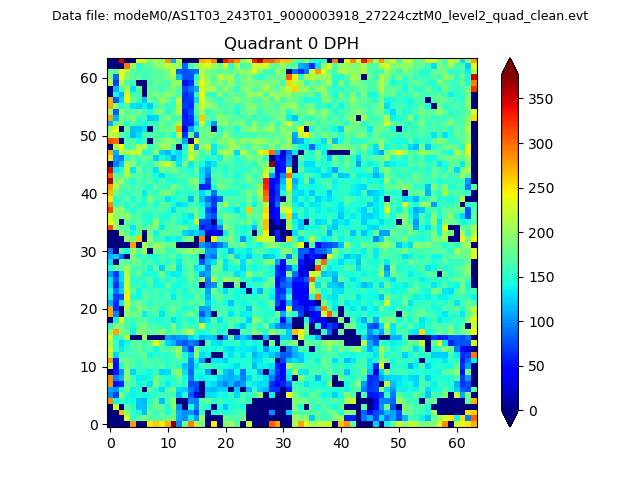 |
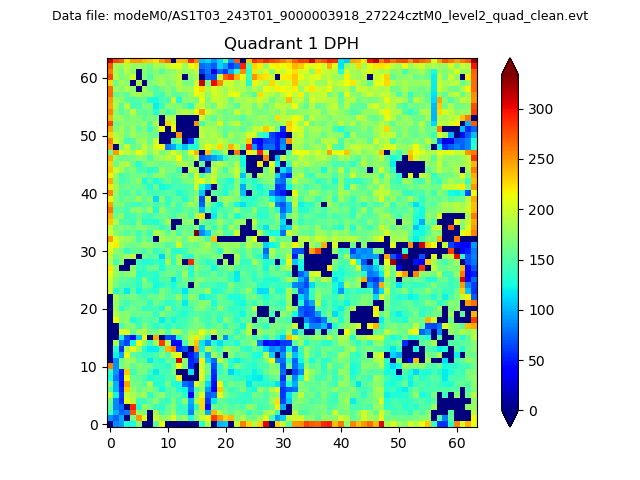 |
Quadrant B |
|---|---|---|---|
| Quadrant D | 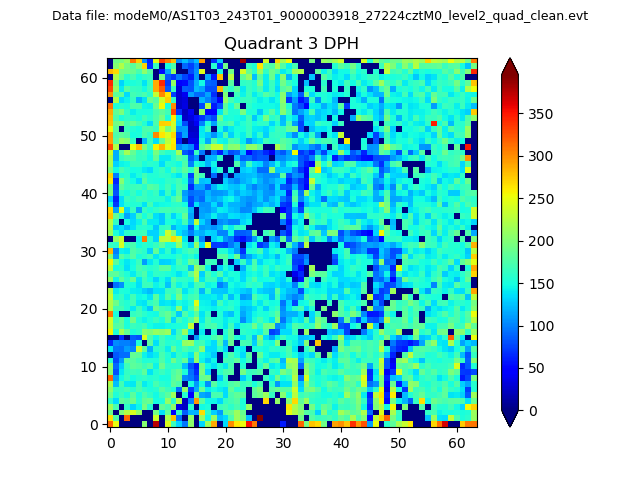 |
 |
Quadrant C |
| Plot type | Count rate plots | Images |
|---|---|---|
| Comparison with Poisson distribution Blue bars denote a histogram of data divided into 1 sec bins. Red curve is a Poisson curve with rate = median count rate of data. |
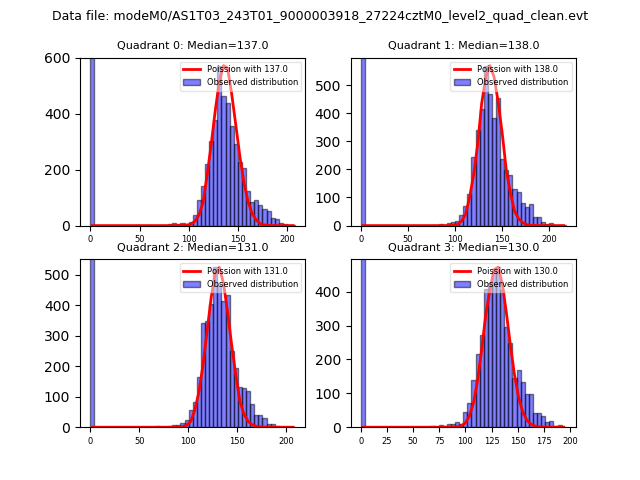 |
 |
| Quadrant-wise count rates Data is divided into 100 sec bins |
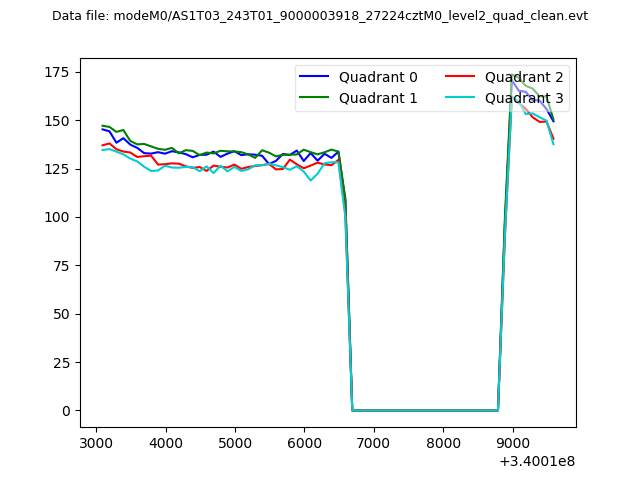 |
|
| Module-wise count rates for Quadrant A Data is divided into 100 sec bins |
 |
 |
| Module-wise count rates for Quadrant B Data is divided into 100 sec bins |
 |
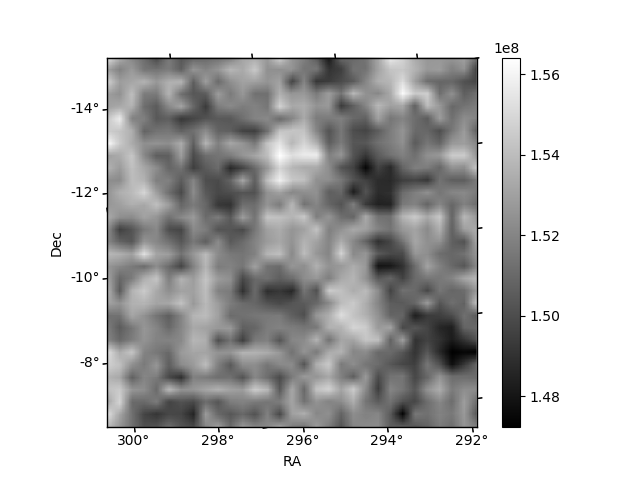 |
| Module-wise count rates for Quadrant C Data is divided into 100 sec bins |
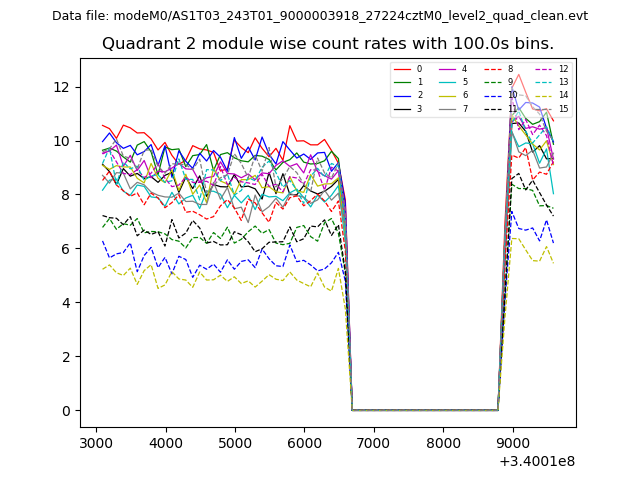 |
 |
| Module-wise count rates for Quadrant D Data is divided into 100 sec bins |
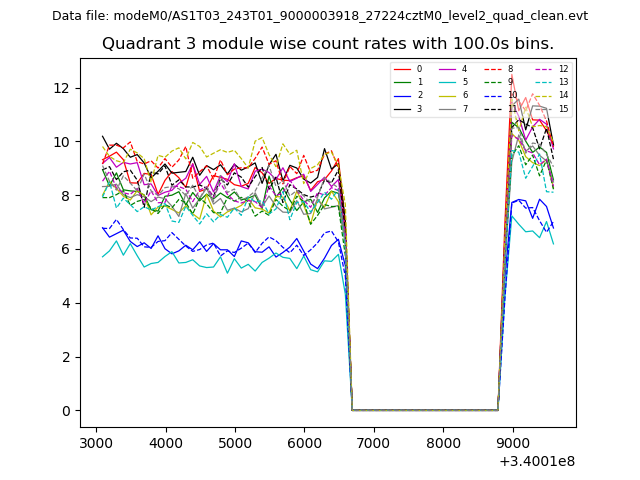 |
 |
| Parameter | Plot |
|---|---|
| CZT HV Monitor |  |
| D_VDD | 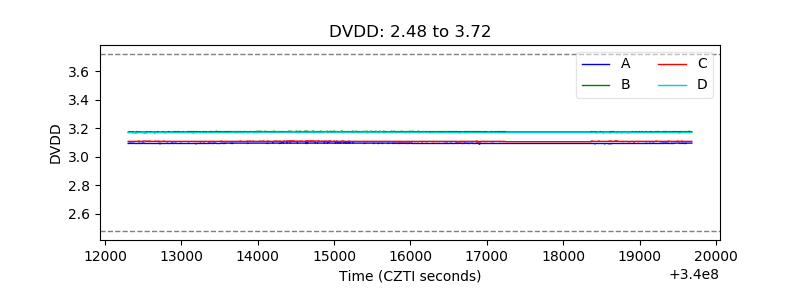 |
| Temperature 1 | 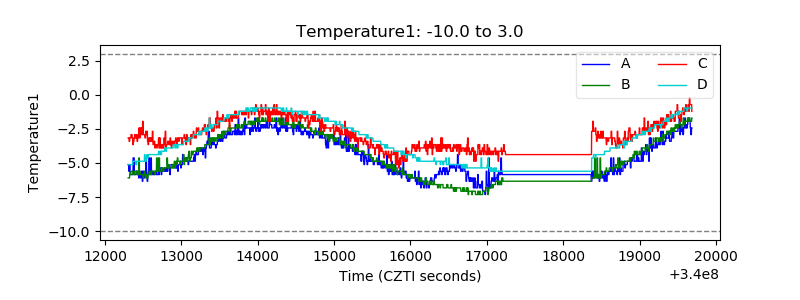 |
| Veto HV Monitor | 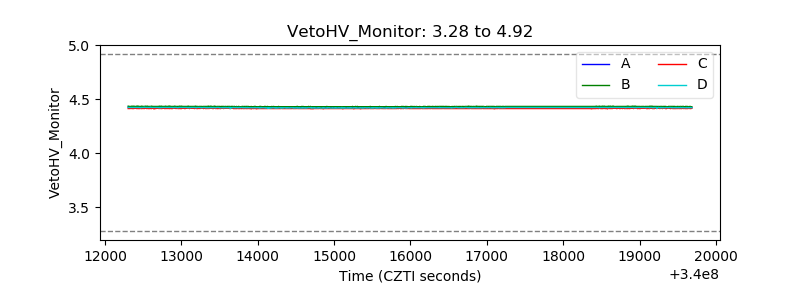 |
| Veto LLD | 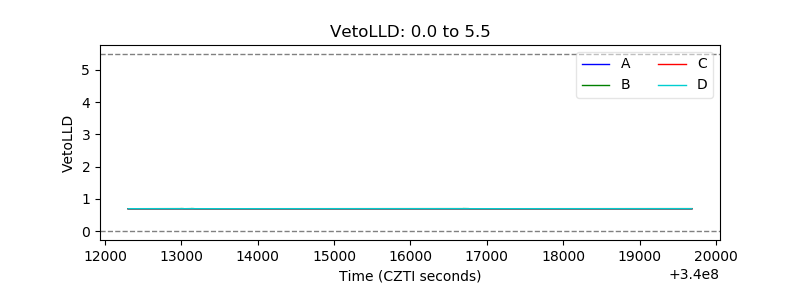 |
| Alpha Counter | 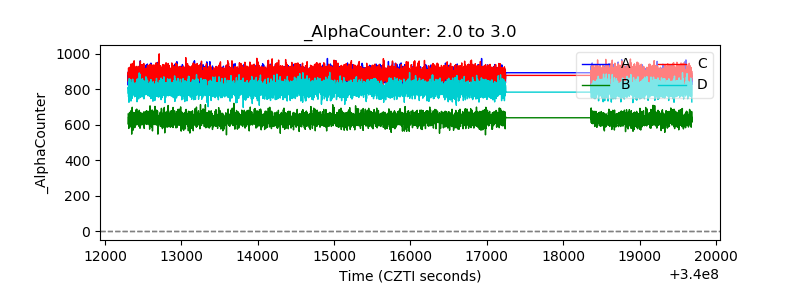 |
| _CPM_Rate | 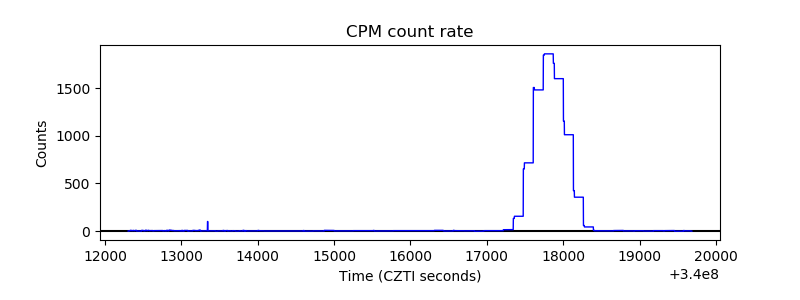 |
| CZT Counter | 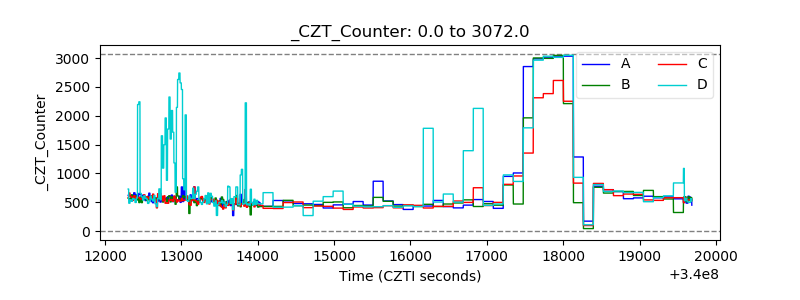 |
| +2.5 Volts monitor |  |
| +5 Volts monitor |  |
| _ROLL_ROT |  |
| _Roll_DEC | 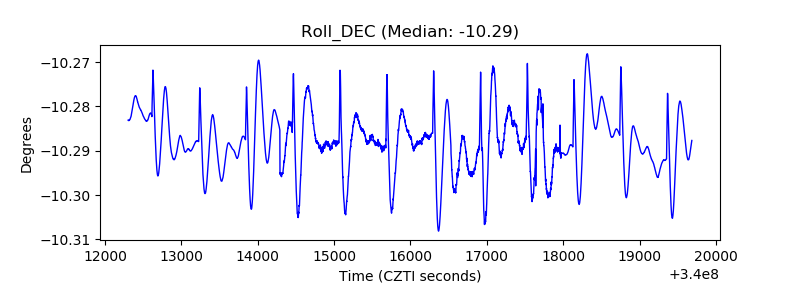 |
| _Roll_RA | 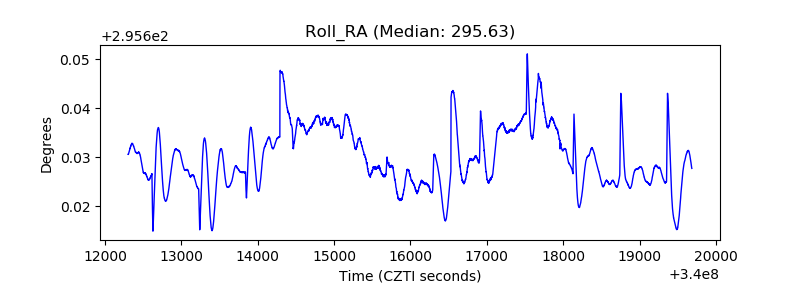 |
| Veto Counter | 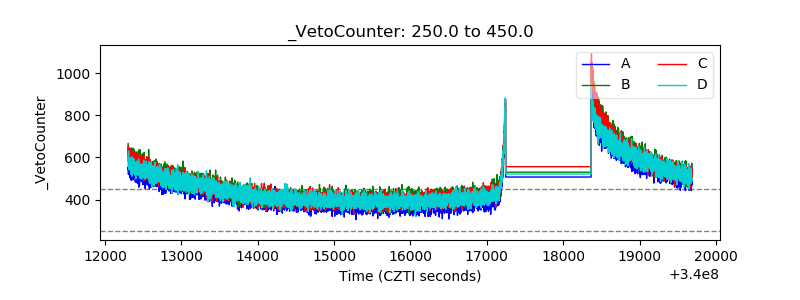 |