| Param | Original file | Final file |
|---|---|---|
| Filename | modeM0/AS1T03_243T01_9000003918_27225cztM0_level2.evt | modeM0/AS1T03_243T01_9000003918_27225cztM0_level2_quad_clean.evt |
| Size (bytes) | 548,498,880 | 109,460,160 |
| Size | 523.1 MB | 104.4 MB |
| Events in quadrant A | 3,490,863 | 740,866 |
| Events in quadrant B | 3,474,957 | 750,045 |
| Events in quadrant C | 3,387,112 | 697,588 |
| Events in quadrant D | 5,828,239 | 683,541 |
| Mode M9 | |||
|---|---|---|---|
| Quadrant | BADHDUFLAG | Total packets | Discarded packets |
| A | 0 | 12 | 0 |
| B | 0 | 13 | 0 |
| C | 0 | 13 | 0 |
| D | 0 | 13 | 0 |
| Mode M0 | |||
|---|---|---|---|
| Quadrant | BADHDUFLAG | Total packets | Discarded packets |
| A | 0 | 14601 | 0 |
| B | 0 | 14512 | 0 |
| C | 0 | 14273 | 0 |
| D | 0 | 21759 | 0 |
| Quadrant | Total seconds | Saturated seconds | Saturation percentage |
|---|---|---|---|
| A | 6345 | 59 | 0.929866% |
| B | 6345 | 58 | 0.914106% |
| C | 6345 | 105 | 1.654846% |
| D | 6344 | 704 | 11.097100% |
Noise dominated data is calculated using 1-second bins in cleaned event files. If a bin has >2000 counts, and if more than 50% of those come from <1% of pixels, then it is considered to be noise-dominated and hence unusable.
| Quadrant | # 1 sec bins | Bins with >0 counts | Bins with >2000 counts | High rate bins dominated by noise | Noise dominated (total time) | Noise dominated (detector-on time) | Marked lightcurve |
|---|---|---|---|---|---|---|---|
| A | 7595 | 6346 | 1 | 1 | 0.01% | 0.02% | 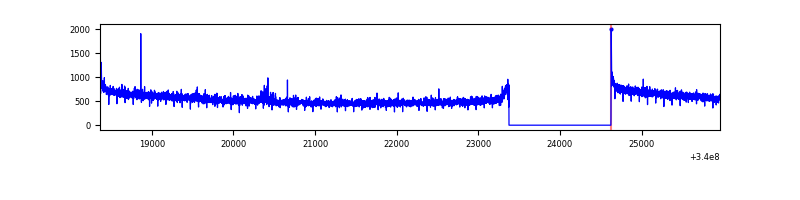 |
| B | 7595 | 6346 | 0 | 0 | 0.00% | 0.00% | 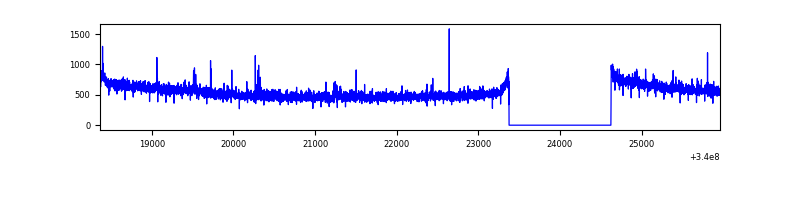 |
| C | 7595 | 6346 | 2 | 2 | 0.03% | 0.03% | 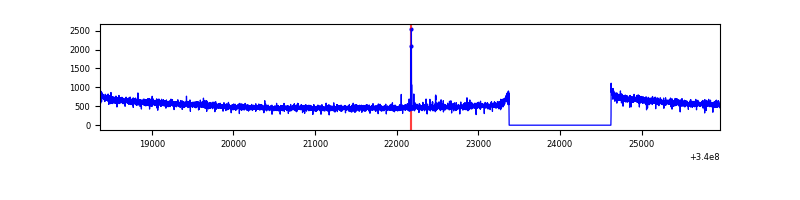 |
| D | 7594 | 6344 | 609 | 609 | 8.02% | 9.60% | 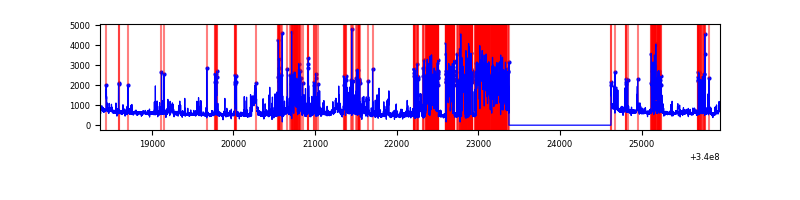 |
Top three noisy pixels from each quadrant. If the there are fewer than three noisy pixels in the level2.evt file, extra rows are filled as -1
| Pixel properties | Quadrant properties | ||||||
|---|---|---|---|---|---|---|---|
| Quadrant | DetID | PixID | Counts | Sigma | Mean | Median | Sigma |
| A | 0 | 13 | 34309 | 189.41 | 891 | 877 | 176.5 |
| A | 8 | 192 | 11576 | 60.62 | 891 | 877 | 176.5 |
| A | 13 | 254 | 8948 | 45.73 | 891 | 877 | 176.5 |
| B | 0 | 190 | 20176 | 117.35 | 874 | 856 | 164.6 |
| B | 4 | 171 | 19808 | 115.11 | 874 | 856 | 164.6 |
| B | 12 | 111 | 19227 | 111.59 | 874 | 856 | 164.6 |
| C | 14 | 238 | 137805 | 711.15 | 830 | 837 | 192.6 |
| C | 15 | 208 | 14314 | 69.97 | 830 | 837 | 192.6 |
| C | 13 | 61 | 5705 | 25.28 | 830 | 837 | 192.6 |
| D | 1 | 52 | 2122209 | 10981.58 | 820 | 803 | 193.2 |
| D | 2 | 250 | 231656 | 1195.02 | 820 | 803 | 193.2 |
| D | 7 | 38 | 140179 | 721.49 | 820 | 803 | 193.2 |
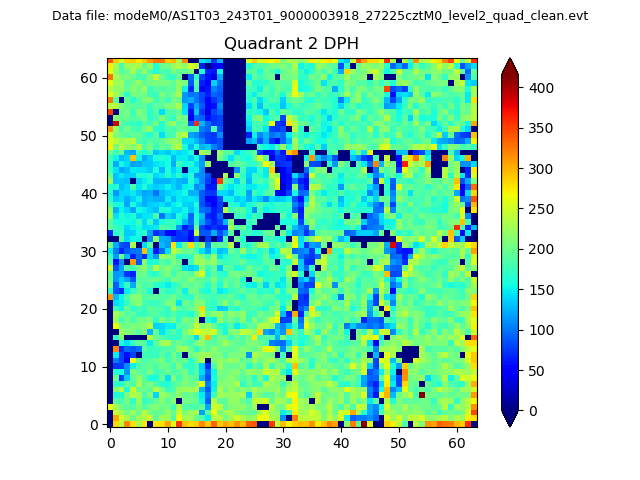
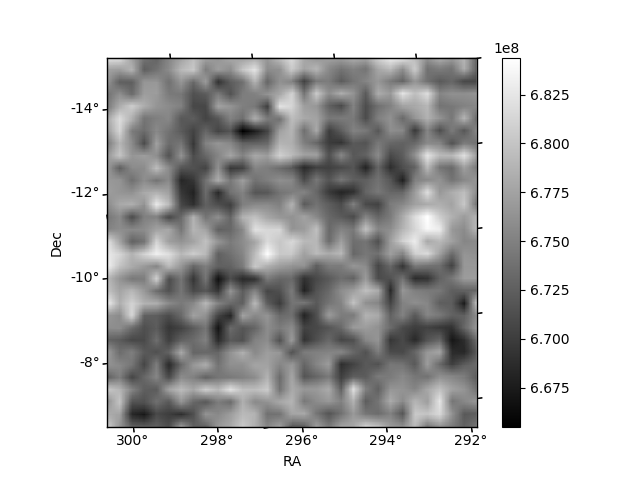
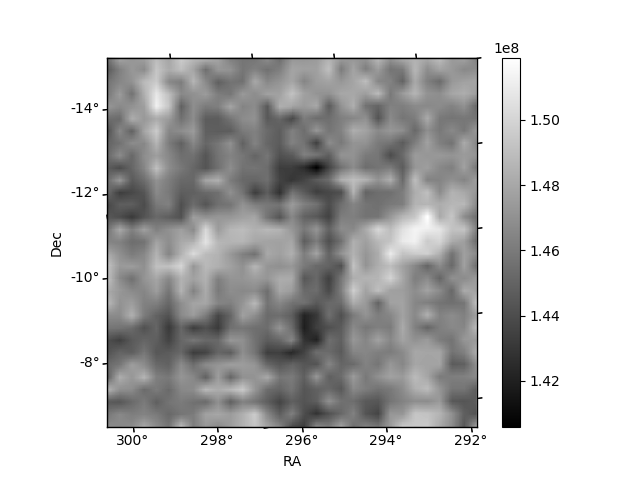
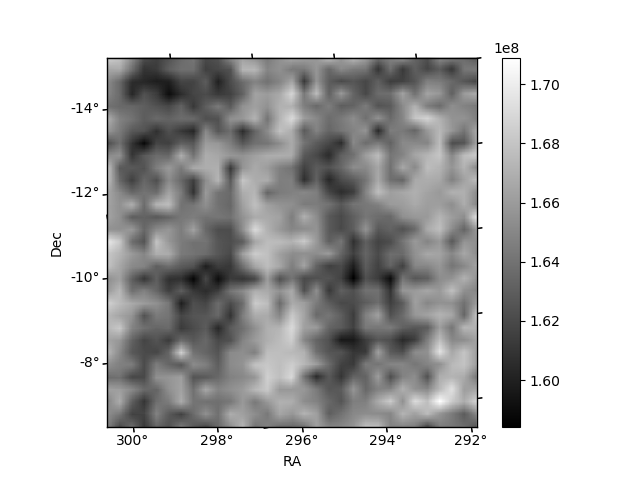
Histogram calculated using DETX and DETY for each event in the final _common_clean file
| Quadrant A | 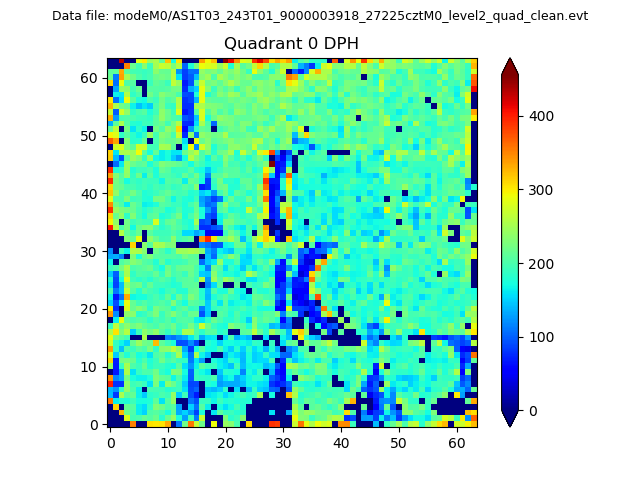 |
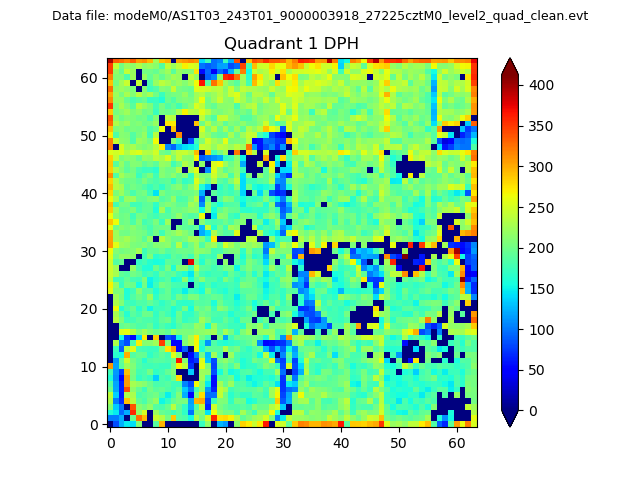 |
Quadrant B |
|---|---|---|---|
| Quadrant D | 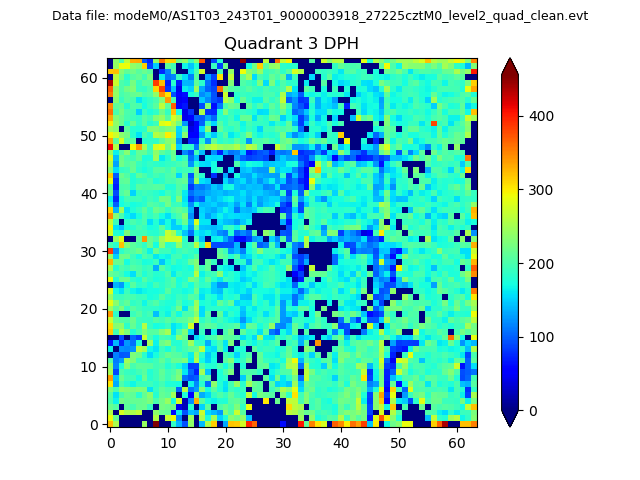 |
 |
Quadrant C |
| Plot type | Count rate plots | Images |
|---|---|---|
| Comparison with Poisson distribution Blue bars denote a histogram of data divided into 1 sec bins. Red curve is a Poisson curve with rate = median count rate of data. |
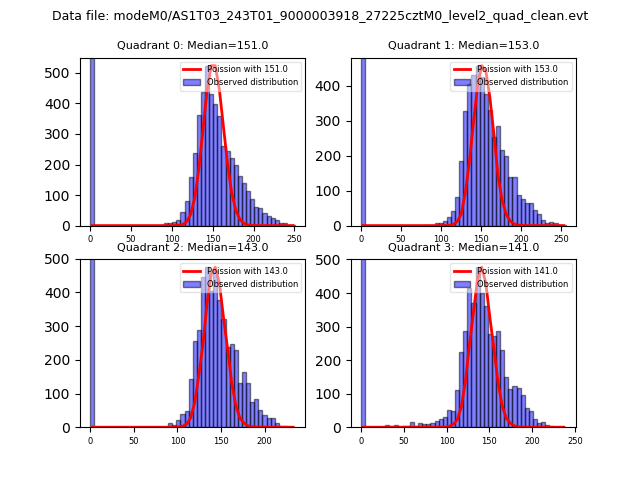 |
 |
| Quadrant-wise count rates Data is divided into 100 sec bins |
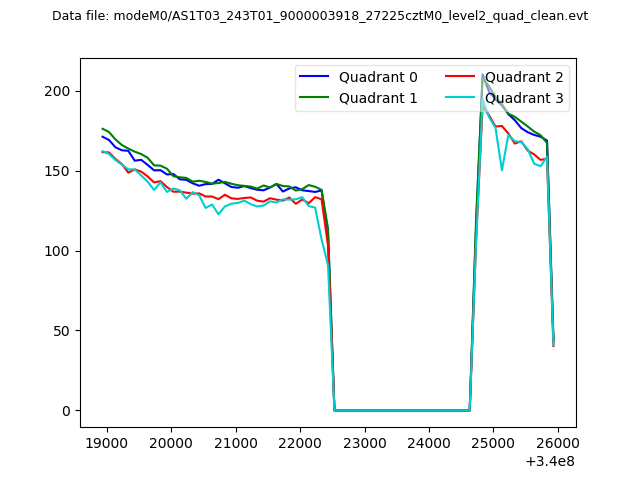 |
|
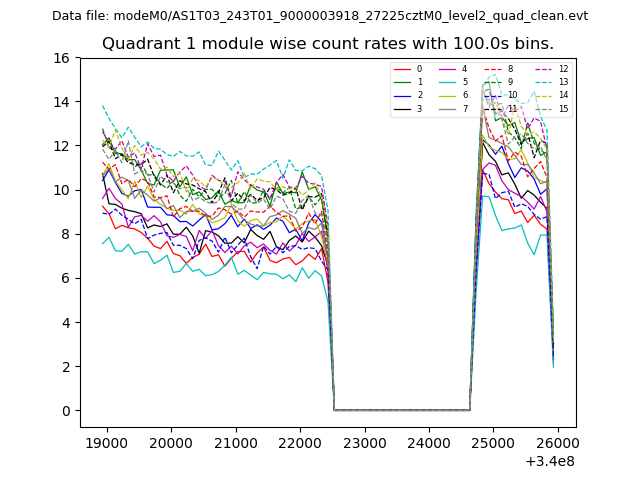
| Module-wise count rates for Quadrant A Data is divided into 100 sec bins |
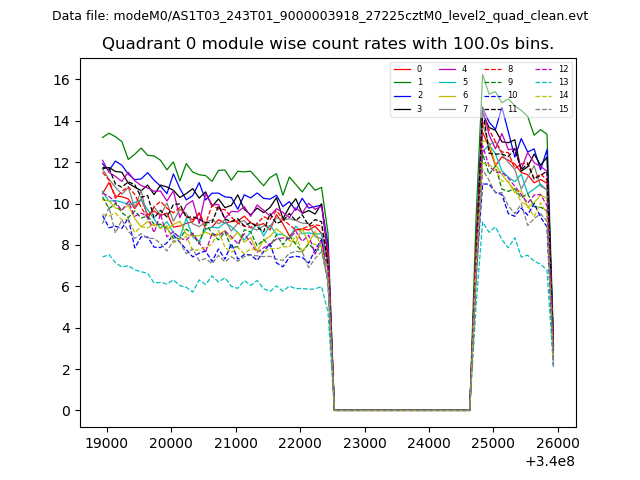 |
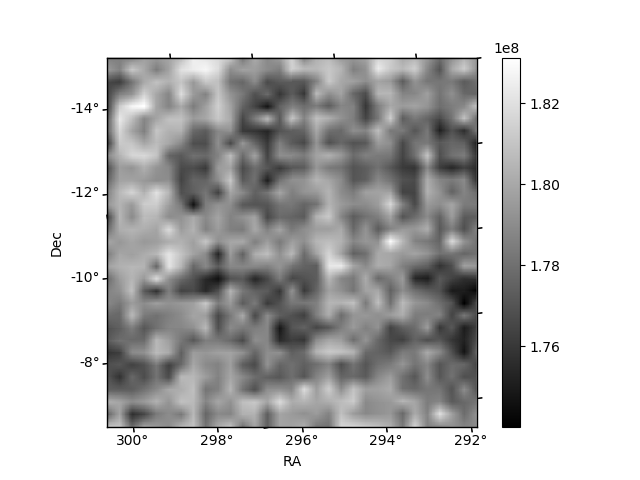 |
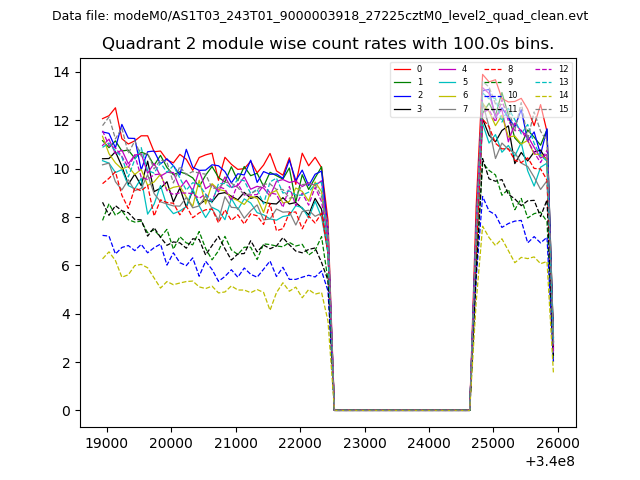
| Module-wise count rates for Quadrant B Data is divided into 100 sec bins |
 |
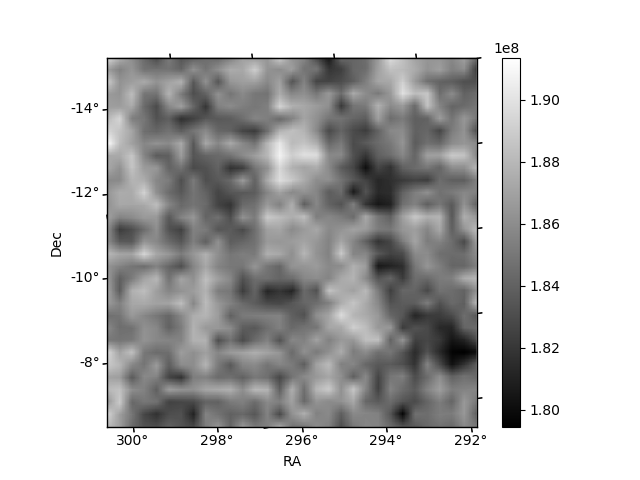 |
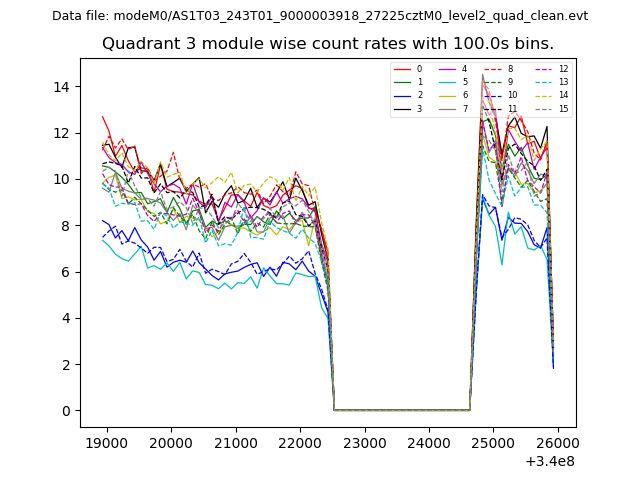
| Module-wise count rates for Quadrant C Data is divided into 100 sec bins |
 |
 |
| Module-wise count rates for Quadrant D Data is divided into 100 sec bins |
 |
 |
| Parameter | Plot |
|---|---|
| CZT HV Monitor | 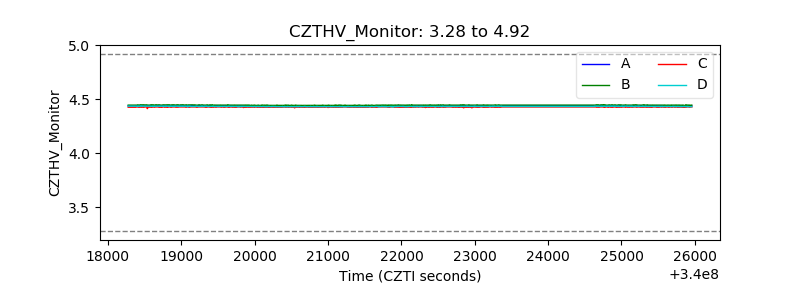 |
| D_VDD | 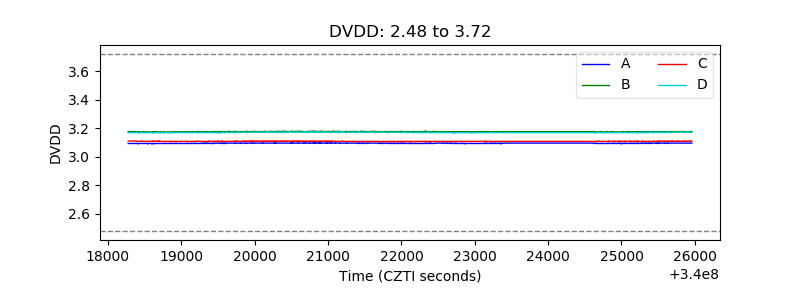 |
| Temperature 1 | 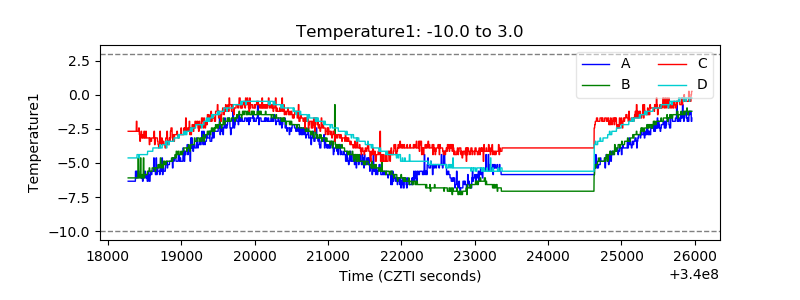 |
| Veto HV Monitor | 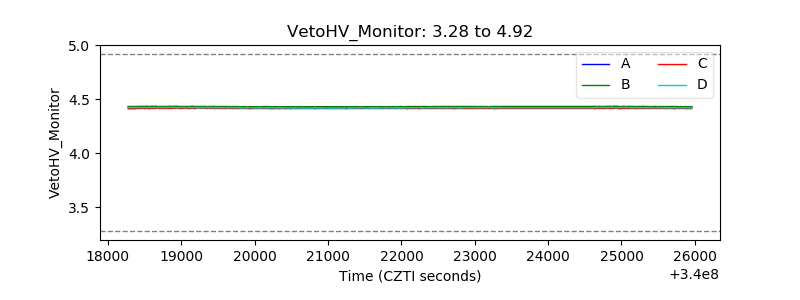 |
| Veto LLD | 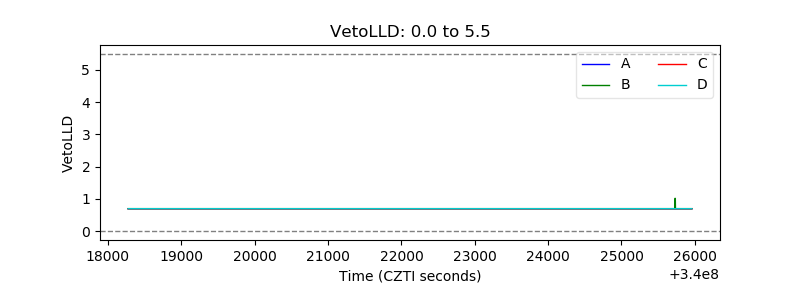 |
| Alpha Counter | 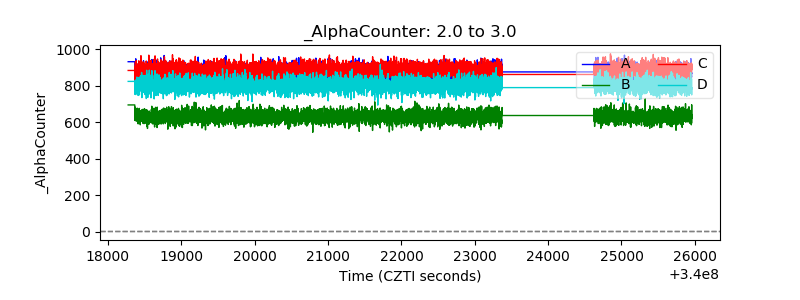 |
| _CPM_Rate | 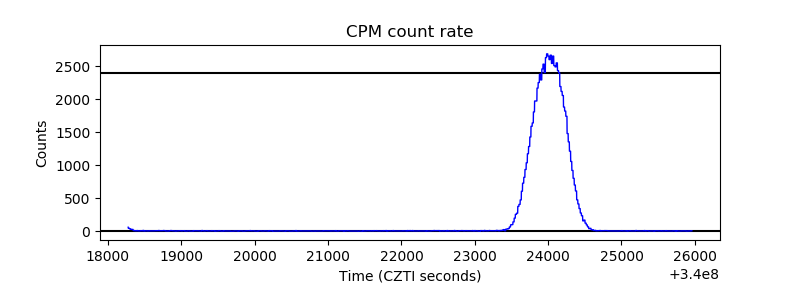 |
| CZT Counter | 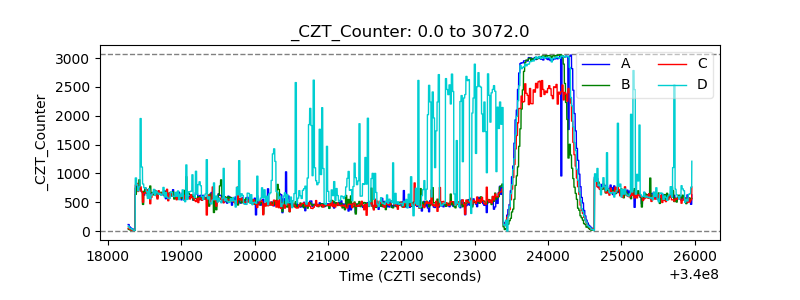 |
| +2.5 Volts monitor |  |
| +5 Volts monitor |  |
| _ROLL_ROT | 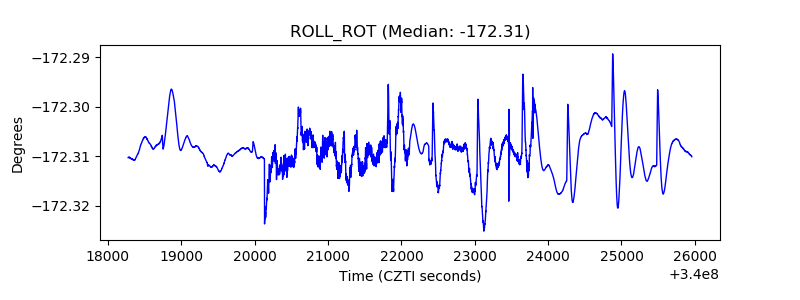 |
| _Roll_DEC | 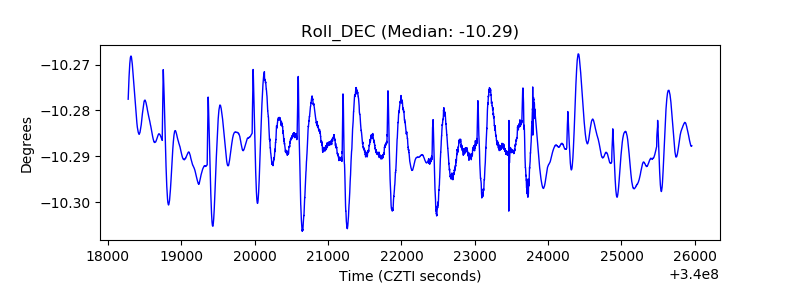 |
| _Roll_RA | 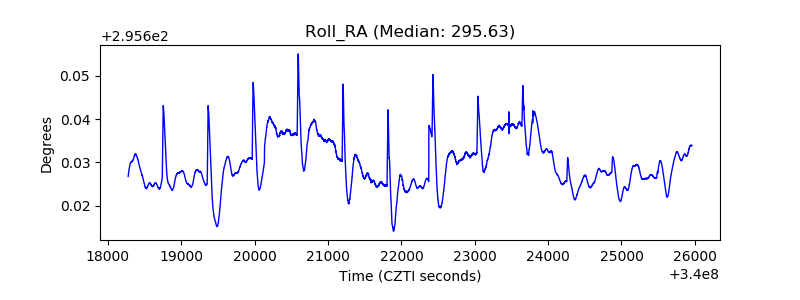 |
| Veto Counter | 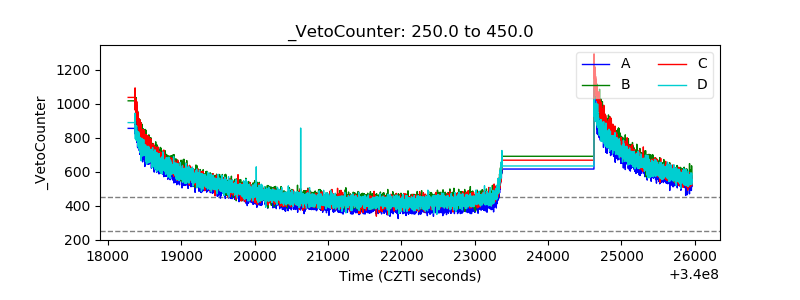 |