| Param | Original file | Final file |
|---|---|---|
| Filename | modeM0/AS1T03_243T01_9000003918_27226cztM0_level2.evt | modeM0/AS1T03_243T01_9000003918_27226cztM0_level2_quad_clean.evt |
| Size (bytes) | 532,756,800 | 114,874,560 |
| Size | 508.1 MB | 109.6 MB |
| Events in quadrant A | 3,319,763 | 799,105 |
| Events in quadrant B | 3,292,650 | 804,449 |
| Events in quadrant C | 3,209,116 | 745,760 |
| Events in quadrant D | 5,904,800 | 708,947 |
| Mode M9 | |||
|---|---|---|---|
| Quadrant | BADHDUFLAG | Total packets | Discarded packets |
| A | 0 | 13 | 0 |
| B | 0 | 13 | 0 |
| C | 0 | 13 | 0 |
| D | 0 | 13 | 0 |
| Mode M0 | |||
|---|---|---|---|
| Quadrant | BADHDUFLAG | Total packets | Discarded packets |
| A | 0 | 13711 | 0 |
| B | 0 | 13534 | 0 |
| C | 0 | 13272 | 0 |
| D | 0 | 21675 | 0 |
| Quadrant | Total seconds | Saturated seconds | Saturation percentage |
|---|---|---|---|
| A | 6018 | 85 | 1.412429% |
| B | 6019 | 85 | 1.412195% |
| C | 6019 | 110 | 1.827546% |
| D | 6019 | 763 | 12.676524% |
Noise dominated data is calculated using 1-second bins in cleaned event files. If a bin has >2000 counts, and if more than 50% of those come from <1% of pixels, then it is considered to be noise-dominated and hence unusable.
| Quadrant | # 1 sec bins | Bins with >0 counts | Bins with >2000 counts | High rate bins dominated by noise | Noise dominated (total time) | Noise dominated (detector-on time) | Marked lightcurve |
|---|---|---|---|---|---|---|---|
| A | 7323 | 6019 | 1 | 1 | 0.01% | 0.02% | 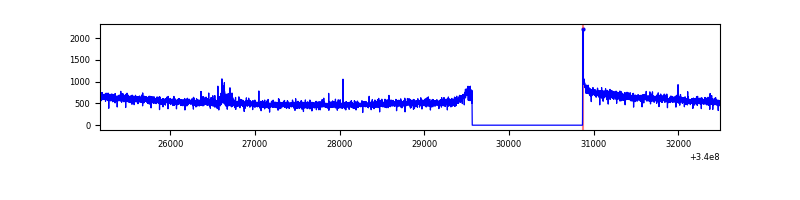 |
| B | 7324 | 6020 | 0 | 0 | 0.00% | 0.00% | 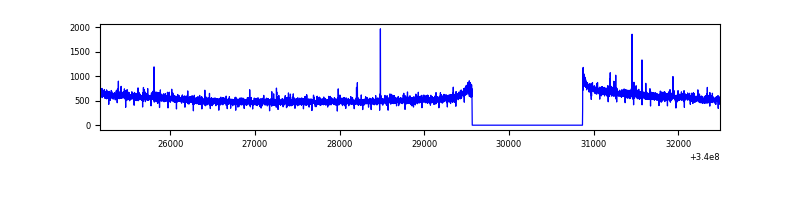 |
| C | 7324 | 6020 | 0 | 0 | 0.00% | 0.00% | 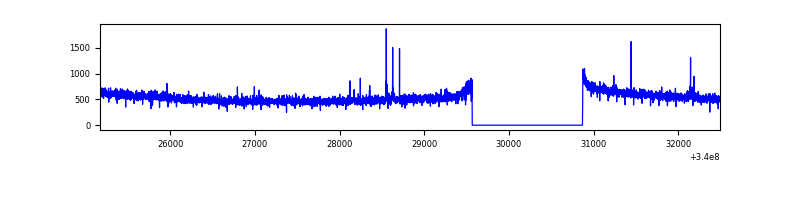 |
| D | 7324 | 6020 | 679 | 679 | 9.27% | 11.28% | 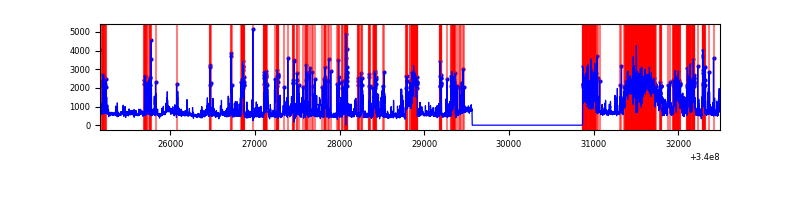 |
Top three noisy pixels from each quadrant. If the there are fewer than three noisy pixels in the level2.evt file, extra rows are filled as -1
| Pixel properties | Quadrant properties | ||||||
|---|---|---|---|---|---|---|---|
| Quadrant | DetID | PixID | Counts | Sigma | Mean | Median | Sigma |
| A | 0 | 13 | 45394 | 264.77 | 847 | 834 | 168.3 |
| A | 13 | 254 | 9081 | 49.0 | 847 | 834 | 168.3 |
| A | 0 | 226 | 7642 | 40.45 | 847 | 834 | 168.3 |
| B | 4 | 171 | 29618 | 184.96 | 828 | 812 | 155.7 |
| B | 0 | 190 | 18364 | 112.7 | 828 | 812 | 155.7 |
| B | 12 | 111 | 17686 | 108.35 | 828 | 812 | 155.7 |
| C | 14 | 238 | 131210 | 720.26 | 784 | 791 | 181.1 |
| C | 15 | 208 | 19913 | 105.6 | 784 | 791 | 181.1 |
| C | 13 | 61 | 5622 | 26.68 | 784 | 791 | 181.1 |
| D | 1 | 52 | 2457990 | 12807.44 | 778 | 762 | 191.9 |
| D | 2 | 250 | 225631 | 1172.05 | 778 | 762 | 191.9 |
| D | 5 | 222 | 136721 | 708.64 | 778 | 762 | 191.9 |
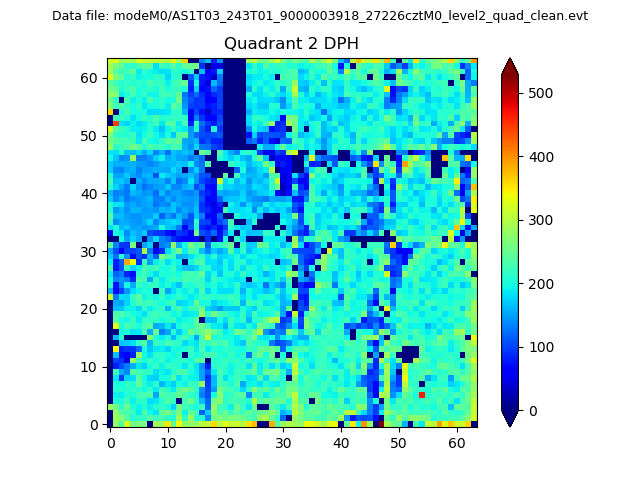
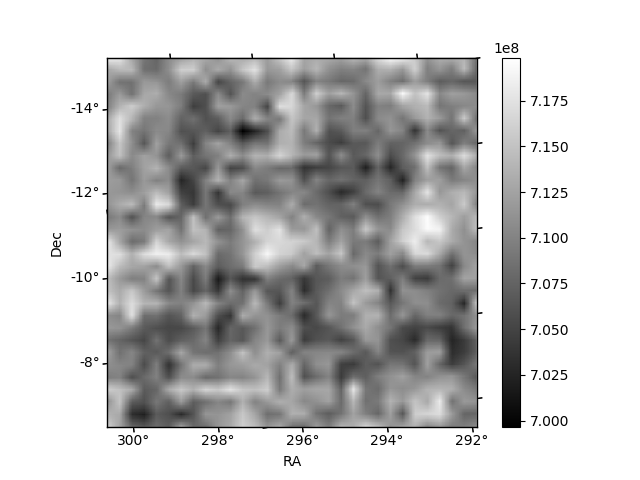
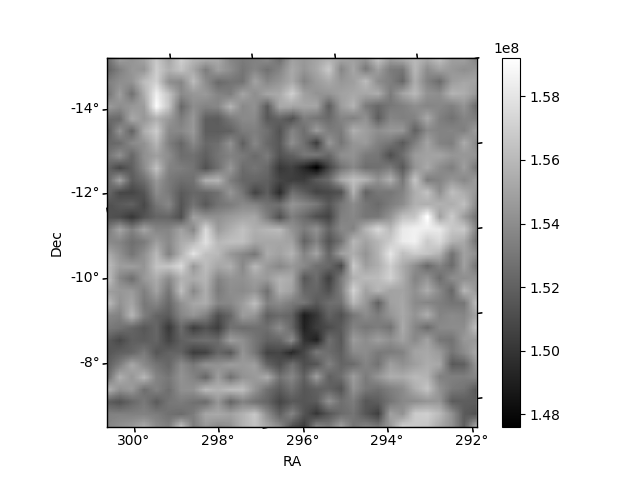
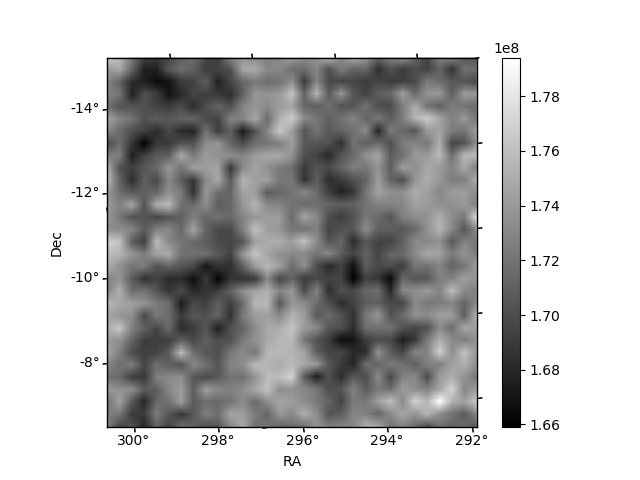
Histogram calculated using DETX and DETY for each event in the final _common_clean file
| Quadrant A | 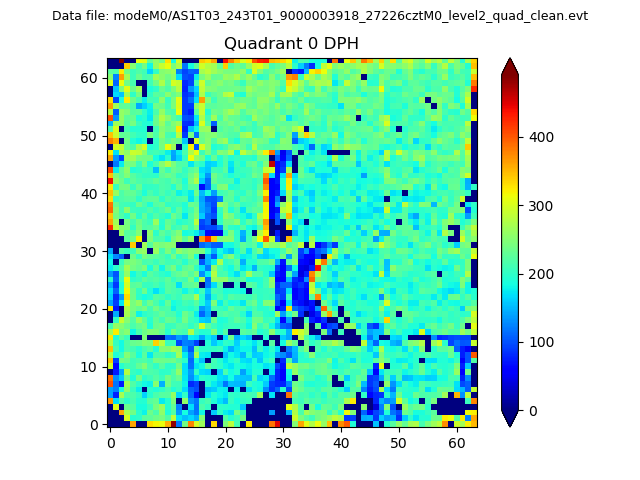 |
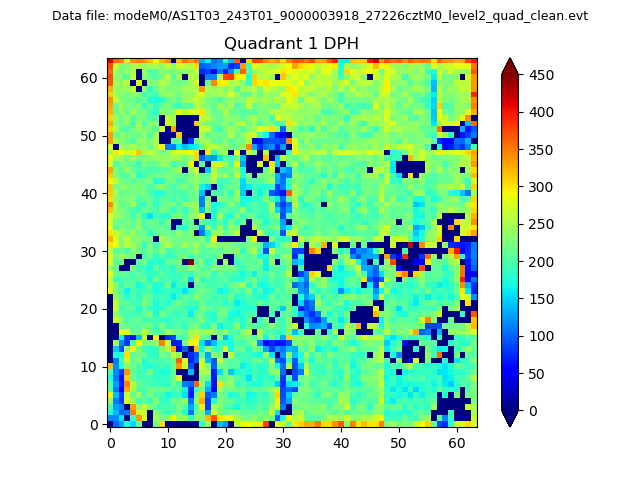 |
Quadrant B |
|---|---|---|---|
| Quadrant D | 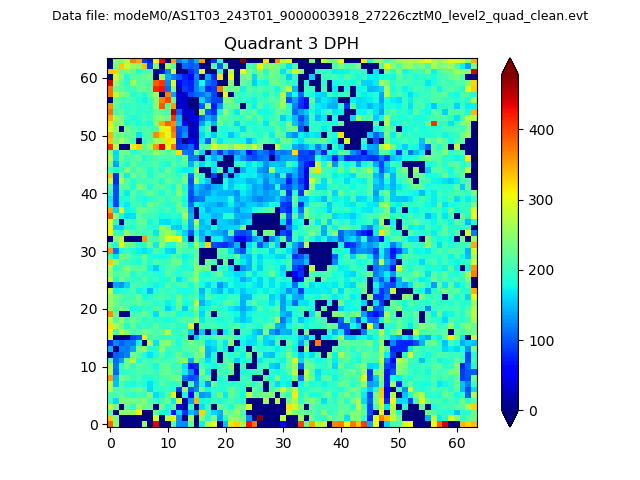 |
 |
Quadrant C |
| Plot type | Count rate plots | Images |
|---|---|---|
| Comparison with Poisson distribution Blue bars denote a histogram of data divided into 1 sec bins. Red curve is a Poisson curve with rate = median count rate of data. |
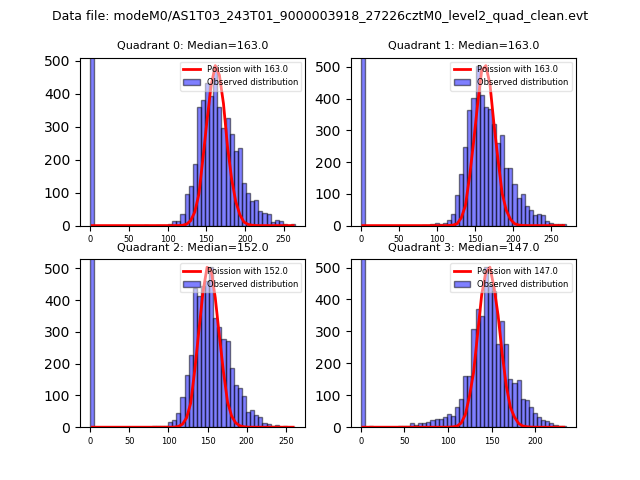 |
 |
| Quadrant-wise count rates Data is divided into 100 sec bins |
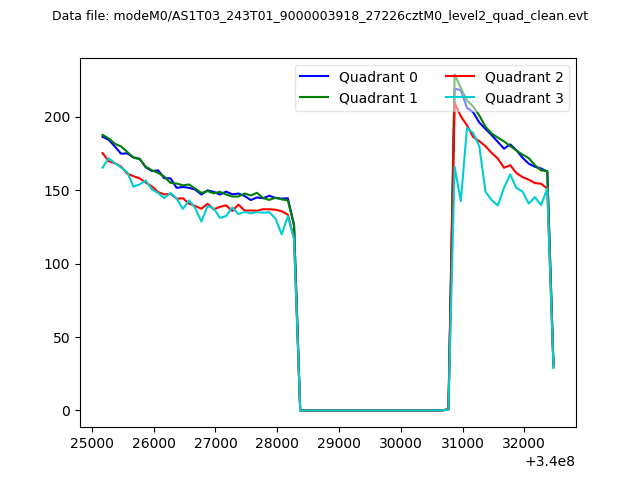 |
|
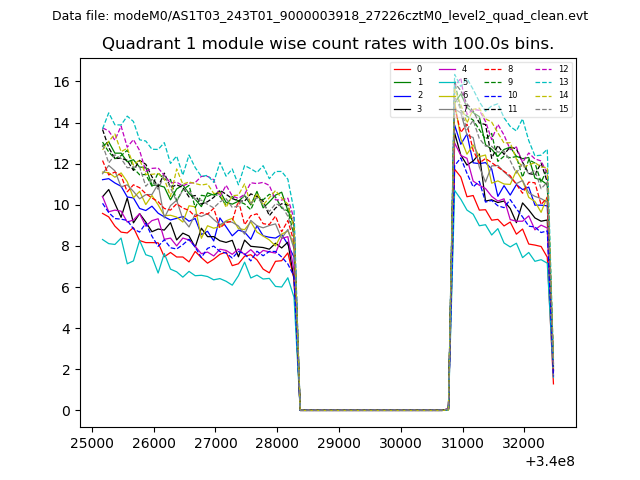
| Module-wise count rates for Quadrant A Data is divided into 100 sec bins |
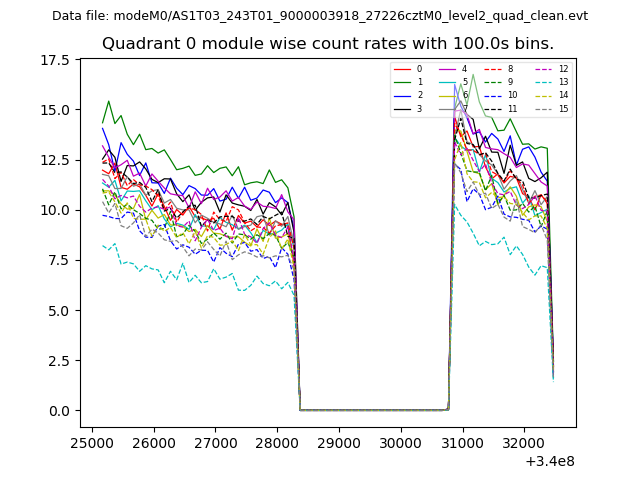 |
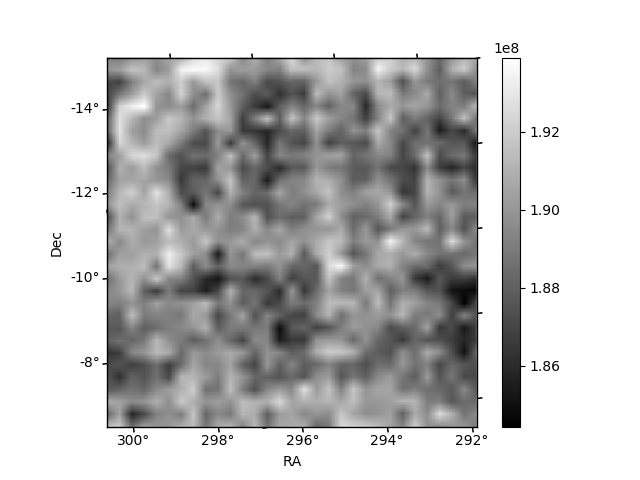 |
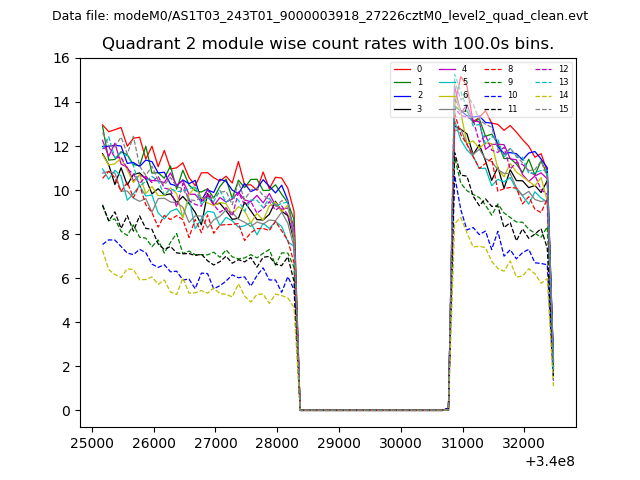
| Module-wise count rates for Quadrant B Data is divided into 100 sec bins |
 |
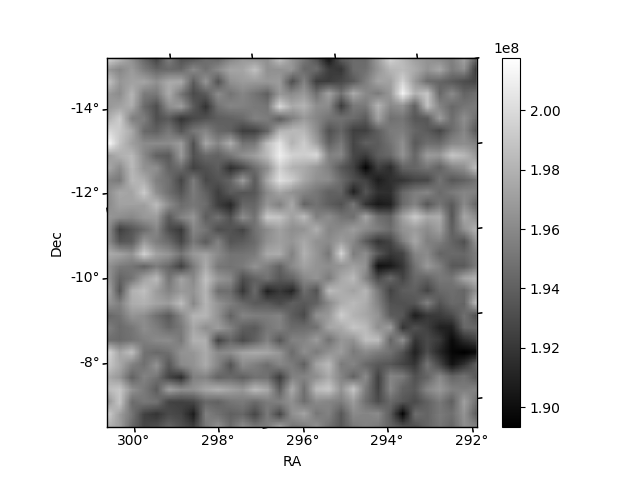 |
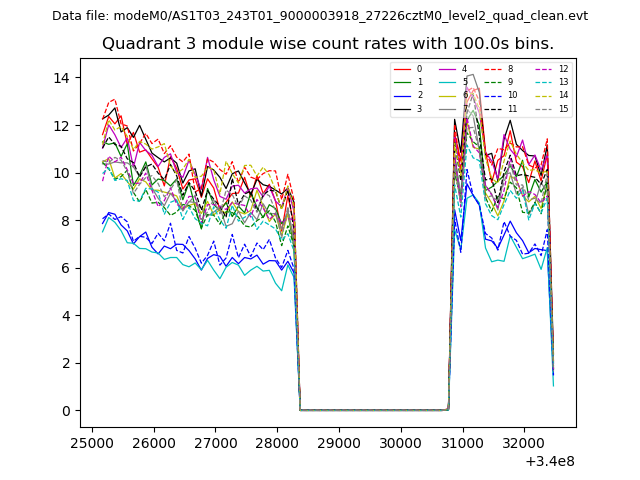
| Module-wise count rates for Quadrant C Data is divided into 100 sec bins |
 |
 |
| Module-wise count rates for Quadrant D Data is divided into 100 sec bins |
 |
 |
| Parameter | Plot |
|---|---|
| CZT HV Monitor | 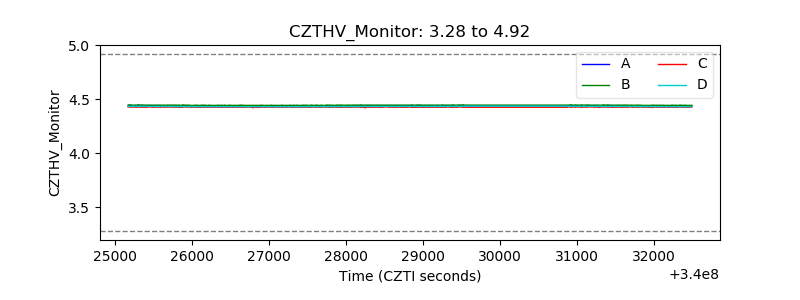 |
| D_VDD | 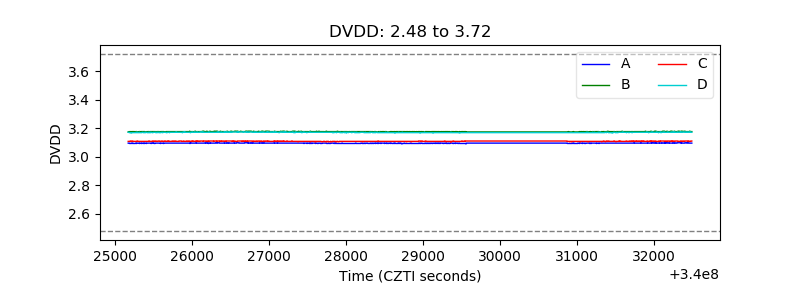 |
| Temperature 1 | 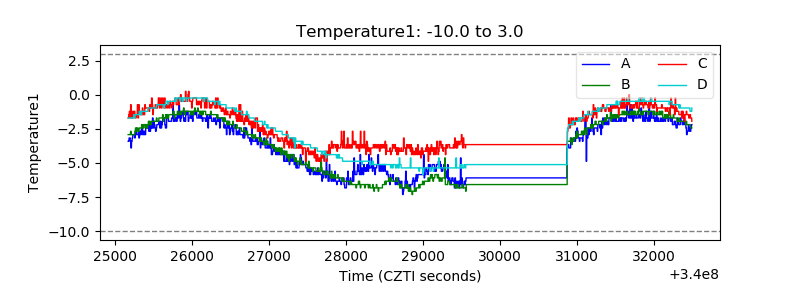 |
| Veto HV Monitor | 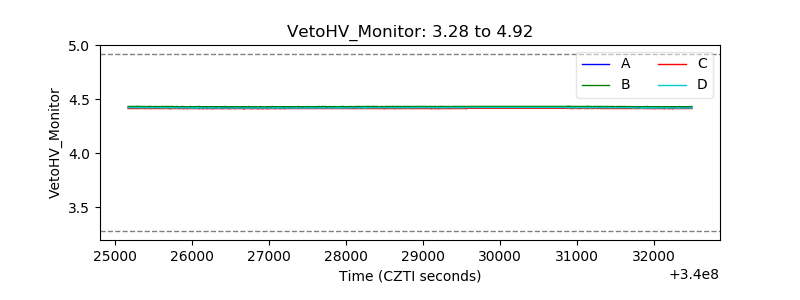 |
| Veto LLD | 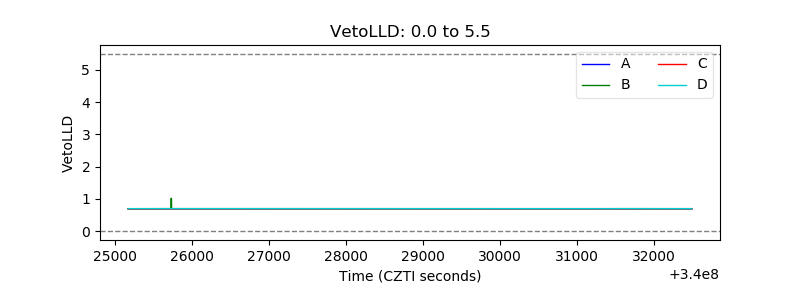 |
| Alpha Counter | 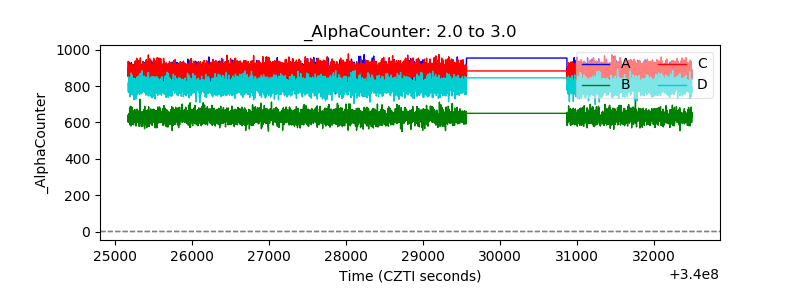 |
| _CPM_Rate | 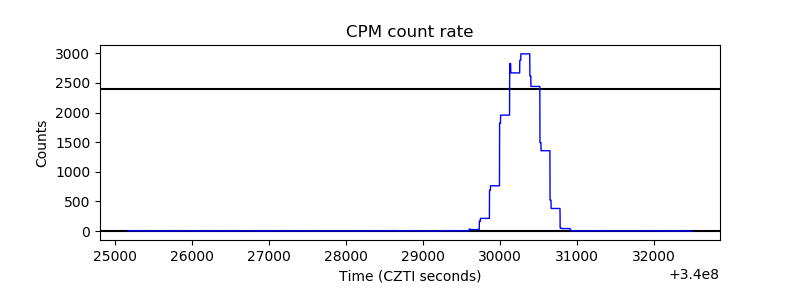 |
| CZT Counter | 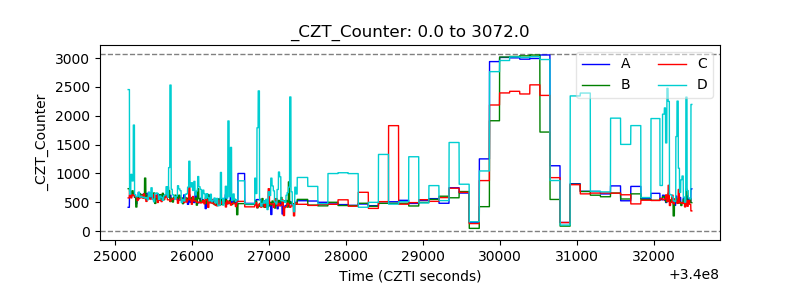 |
| +2.5 Volts monitor |  |
| +5 Volts monitor |  |
| _ROLL_ROT | 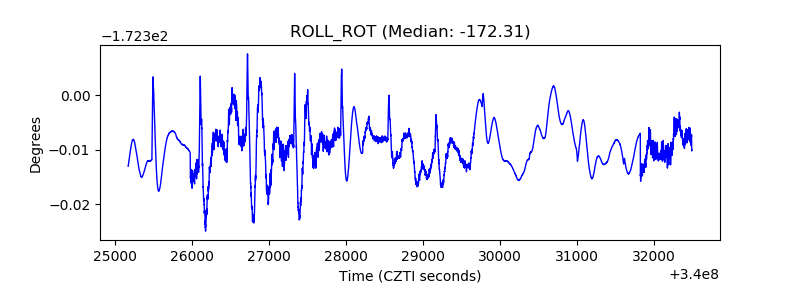 |
| _Roll_DEC | 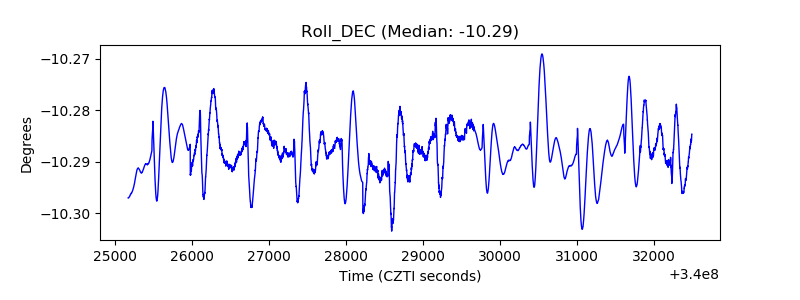 |
| _Roll_RA | 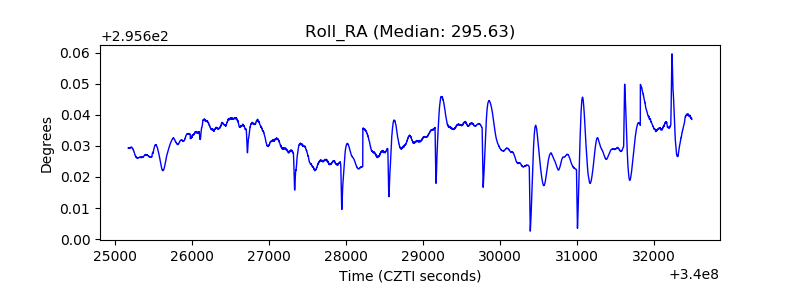 |
| Veto Counter | 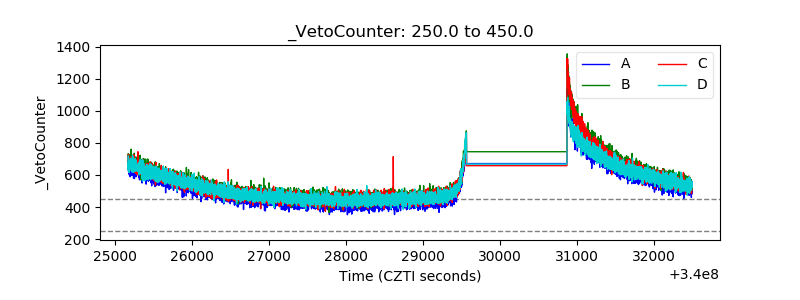 |