| Param | Original file | Final file |
|---|---|---|
| Filename | modeM0/AS1T03_243T01_9000003918_27227cztM0_level2.evt | modeM0/AS1T03_243T01_9000003918_27227cztM0_level2_quad_clean.evt |
| Size (bytes) | 556,640,640 | 111,398,400 |
| Size | 530.9 MB | 106.2 MB |
| Events in quadrant A | 3,725,523 | 770,655 |
| Events in quadrant B | 3,397,024 | 780,989 |
| Events in quadrant C | 3,324,672 | 719,284 |
| Events in quadrant D | 5,993,684 | 672,969 |
| Mode M9 | |||
|---|---|---|---|
| Quadrant | BADHDUFLAG | Total packets | Discarded packets |
| A | 0 | 14 | 0 |
| B | 0 | 14 | 0 |
| C | 0 | 14 | 0 |
| D | 0 | 14 | 0 |
| Mode M0 | |||
|---|---|---|---|
| Quadrant | BADHDUFLAG | Total packets | Discarded packets |
| A | 0 | 15131 | 0 |
| B | 0 | 13946 | 0 |
| C | 0 | 13662 | 0 |
| D | 0 | 22050 | 0 |
| Quadrant | Total seconds | Saturated seconds | Saturation percentage |
|---|---|---|---|
| A | 6160 | 153 | 2.483766% |
| B | 6161 | 94 | 1.525726% |
| C | 6161 | 111 | 1.801656% |
| D | 6160 | 698 | 11.331169% |
Noise dominated data is calculated using 1-second bins in cleaned event files. If a bin has >2000 counts, and if more than 50% of those come from <1% of pixels, then it is considered to be noise-dominated and hence unusable.
| Quadrant | # 1 sec bins | Bins with >0 counts | Bins with >2000 counts | High rate bins dominated by noise | Noise dominated (total time) | Noise dominated (detector-on time) | Marked lightcurve |
|---|---|---|---|---|---|---|---|
| A | 7510 | 6161 | 41 | 41 | 0.55% | 0.67% | 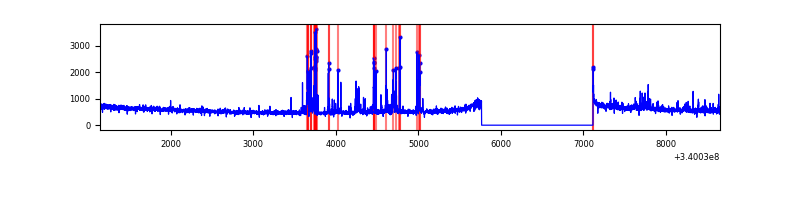 |
| B | 7511 | 6162 | 0 | 0 | 0.00% | 0.00% | 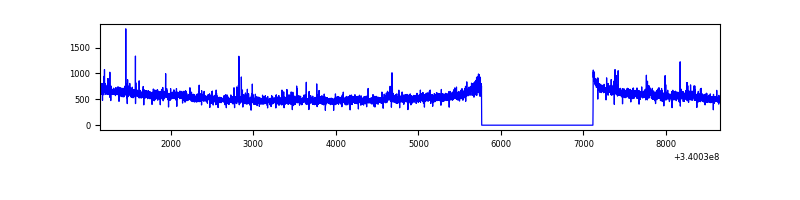 |
| C | 7511 | 6162 | 8 | 8 | 0.11% | 0.13% | 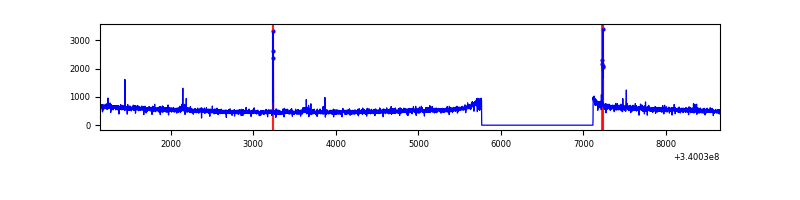 |
| D | 7509 | 6160 | 609 | 609 | 8.11% | 9.89% | 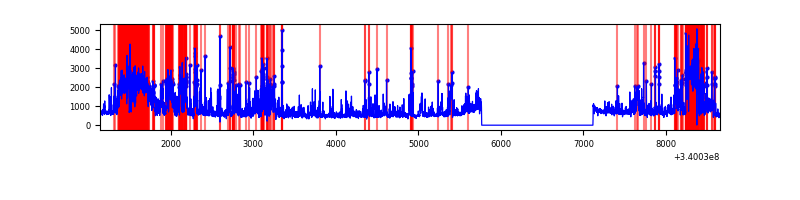 |
Top three noisy pixels from each quadrant. If the there are fewer than three noisy pixels in the level2.evt file, extra rows are filled as -1
| Pixel properties | Quadrant properties | ||||||
|---|---|---|---|---|---|---|---|
| Quadrant | DetID | PixID | Counts | Sigma | Mean | Median | Sigma |
| A | 14 | 235 | 284575 | 1640.26 | 868 | 855 | 173.0 |
| A | 0 | 13 | 86193 | 493.36 | 868 | 855 | 173.0 |
| A | 13 | 254 | 9486 | 49.9 | 868 | 855 | 173.0 |
| B | 4 | 171 | 32143 | 196.75 | 852 | 834 | 159.1 |
| B | 0 | 190 | 20180 | 121.57 | 852 | 834 | 159.1 |
| B | 12 | 111 | 18153 | 108.83 | 852 | 834 | 159.1 |
| C | 14 | 238 | 133915 | 719.26 | 804 | 813 | 185.1 |
| C | 15 | 208 | 34058 | 179.65 | 804 | 813 | 185.1 |
| C | 2 | 16 | 14336 | 73.08 | 804 | 813 | 185.1 |
| D | 1 | 52 | 2621610 | 13928.83 | 794 | 780 | 188.2 |
| D | 2 | 250 | 216497 | 1146.46 | 794 | 780 | 188.2 |
| D | 12 | 233 | 46303 | 241.94 | 794 | 780 | 188.2 |
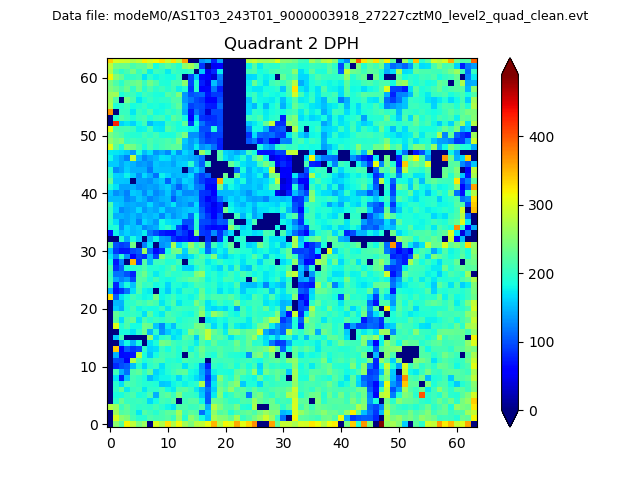
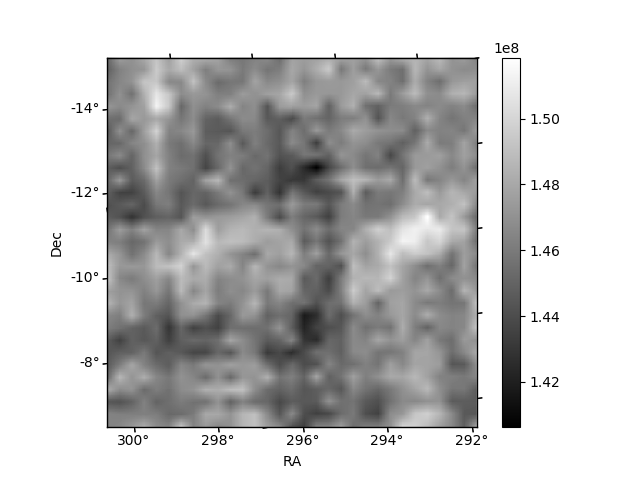
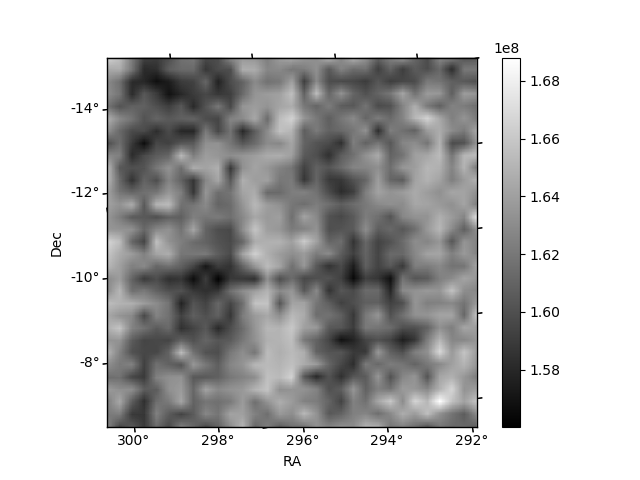
Histogram calculated using DETX and DETY for each event in the final _common_clean file
| Quadrant A | 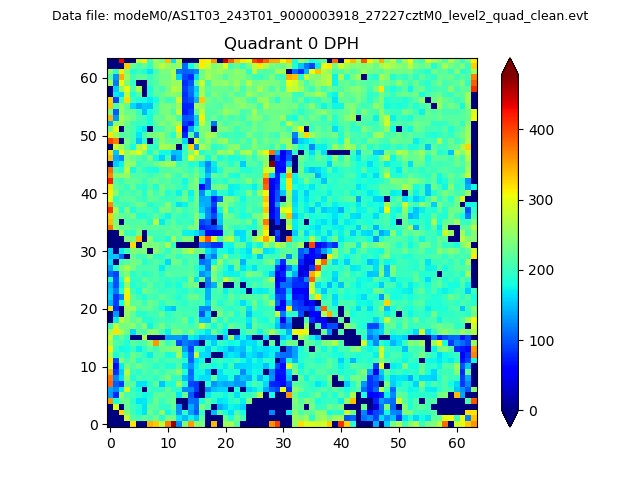 |
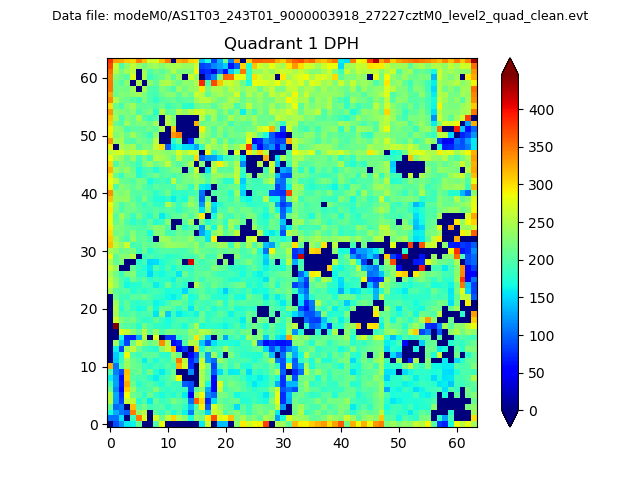 |
Quadrant B |
|---|---|---|---|
| Quadrant D | 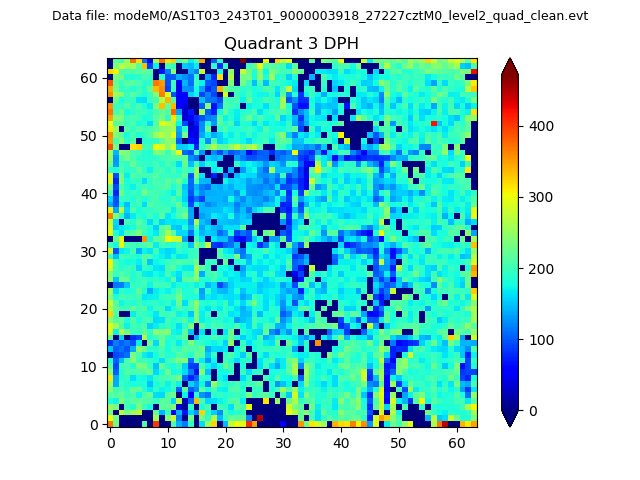 |
 |
Quadrant C |
| Plot type | Count rate plots | Images |
|---|---|---|
| Comparison with Poisson distribution Blue bars denote a histogram of data divided into 1 sec bins. Red curve is a Poisson curve with rate = median count rate of data. |
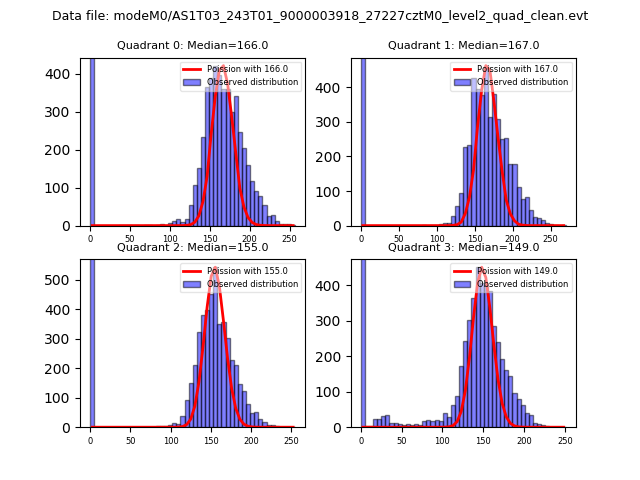 |
 |
| Quadrant-wise count rates Data is divided into 100 sec bins |
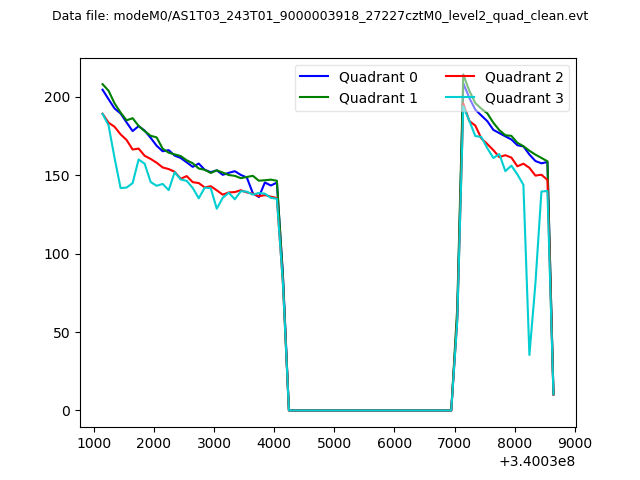 |
|
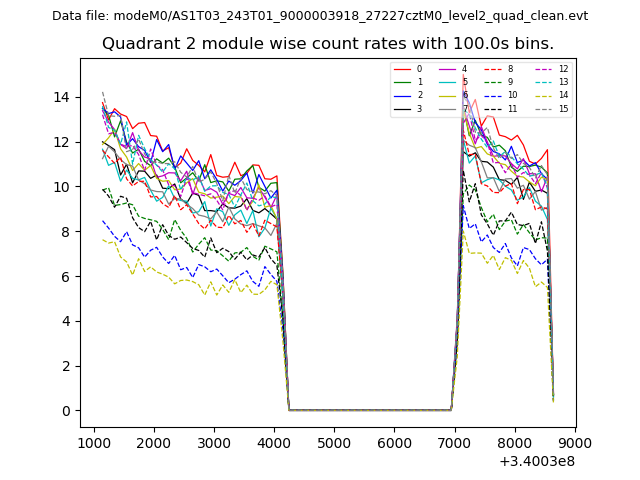
| Module-wise count rates for Quadrant A Data is divided into 100 sec bins |
 |
 |
| Module-wise count rates for Quadrant B Data is divided into 100 sec bins |
 |
 |
| Module-wise count rates for Quadrant C Data is divided into 100 sec bins |
 |
 |
| Module-wise count rates for Quadrant D Data is divided into 100 sec bins |
 |
 |
| Parameter | Plot |
|---|---|
| CZT HV Monitor | 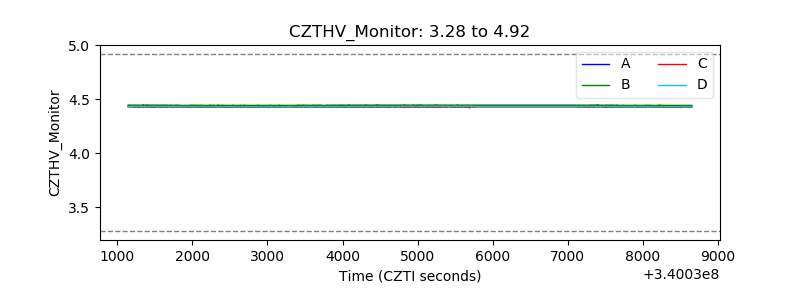 |
| D_VDD | 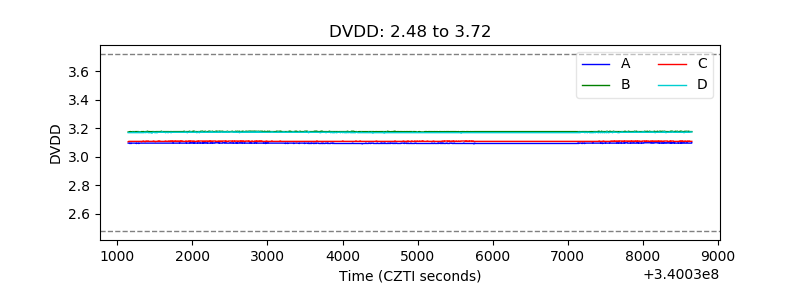 |
| Temperature 1 | 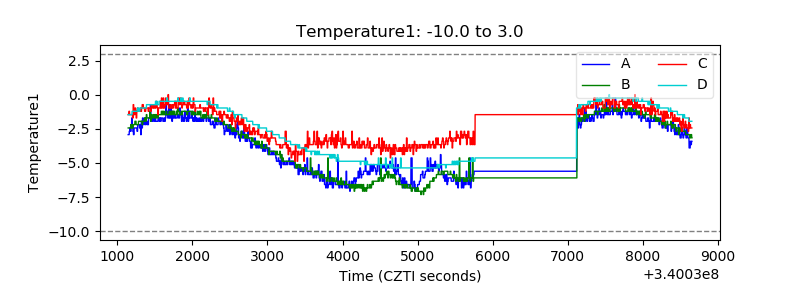 |
| Veto HV Monitor |  |
| Veto LLD | 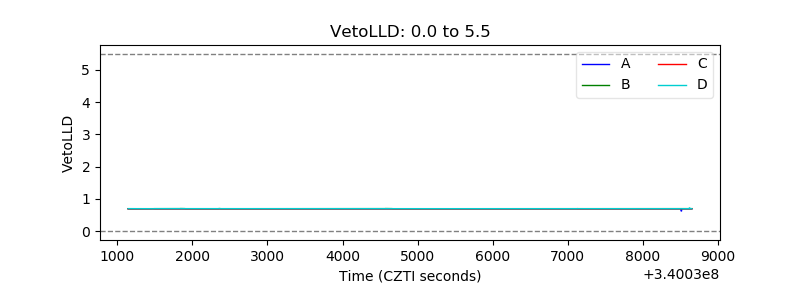 |
| Alpha Counter | 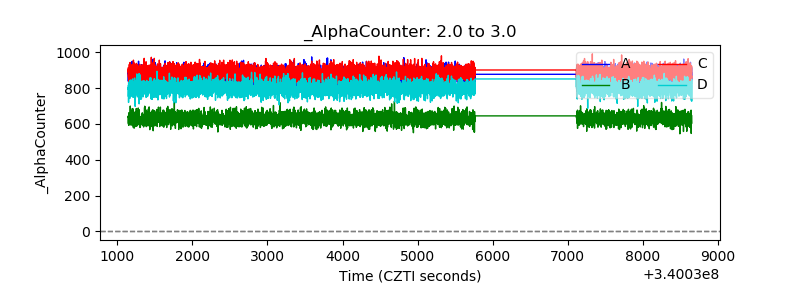 |
| _CPM_Rate | 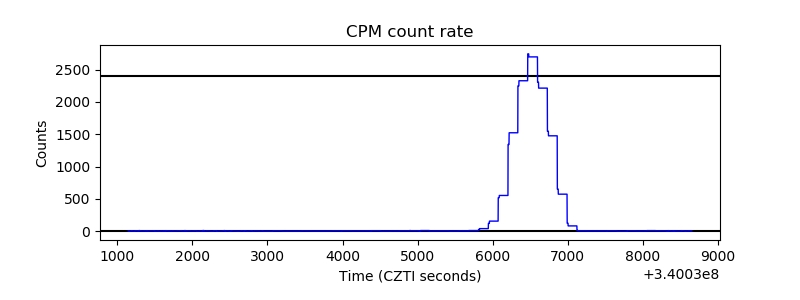 |
| CZT Counter |  |
| +2.5 Volts monitor |  |
| +5 Volts monitor |  |
| _ROLL_ROT | 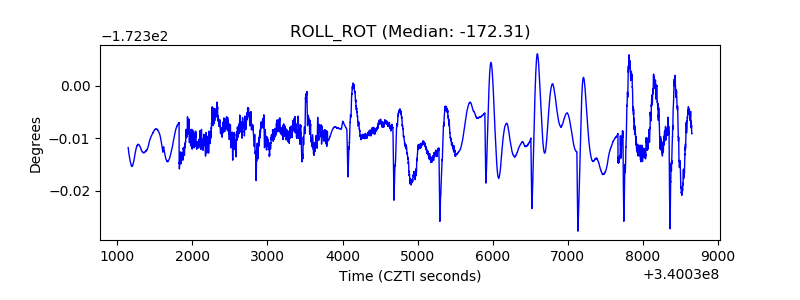 |
| _Roll_DEC |  |
| _Roll_RA |  |
| Veto Counter |  |