| Param | Original file | Final file |
|---|---|---|
| Filename | modeM0/AS1T03_243T01_9000003918_27228cztM0_level2.evt | modeM0/AS1T03_243T01_9000003918_27228cztM0_level2_quad_clean.evt |
| Size (bytes) | 515,724,480 | 101,174,400 |
| Size | 491.8 MB | 96.5 MB |
| Events in quadrant A | 3,548,878 | 684,788 |
| Events in quadrant B | 3,449,277 | 697,413 |
| Events in quadrant C | 3,300,081 | 645,858 |
| Events in quadrant D | 4,895,867 | 598,855 |
| Mode M9 | |||
|---|---|---|---|
| Quadrant | BADHDUFLAG | Total packets | Discarded packets |
| A | 0 | 13 | 0 |
| B | 0 | 13 | 0 |
| C | 0 | 13 | 0 |
| D | 0 | 13 | 0 |
| Mode M0 | |||
|---|---|---|---|
| Quadrant | BADHDUFLAG | Total packets | Discarded packets |
| A | 0 | 14486 | 0 |
| B | 0 | 14194 | 0 |
| C | 0 | 13615 | 0 |
| D | 0 | 18722 | 0 |
| Quadrant | Total seconds | Saturated seconds | Saturation percentage |
|---|---|---|---|
| A | 6258 | 96 | 1.534036% |
| B | 6258 | 106 | 1.693832% |
| C | 6259 | 125 | 1.997124% |
| D | 6259 | 443 | 7.077808% |
Noise dominated data is calculated using 1-second bins in cleaned event files. If a bin has >2000 counts, and if more than 50% of those come from <1% of pixels, then it is considered to be noise-dominated and hence unusable.
| Quadrant | # 1 sec bins | Bins with >0 counts | Bins with >2000 counts | High rate bins dominated by noise | Noise dominated (total time) | Noise dominated (detector-on time) | Marked lightcurve |
|---|---|---|---|---|---|---|---|
| A | 7593 | 6259 | 3 | 3 | 0.04% | 0.05% | 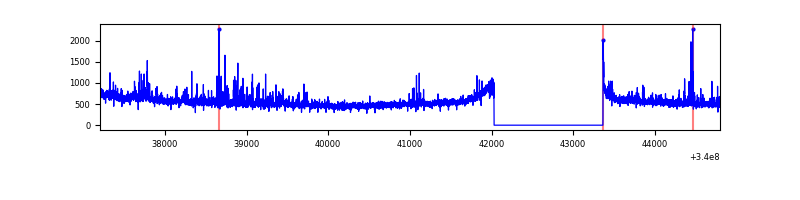 |
| B | 7593 | 6259 | 4 | 4 | 0.05% | 0.06% | 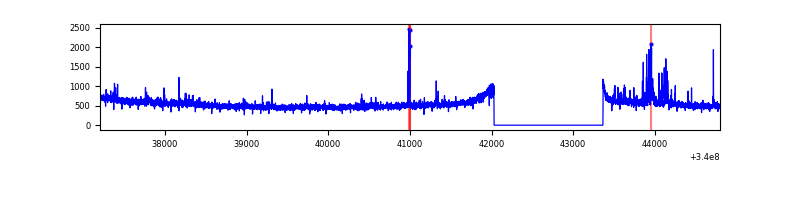 |
| C | 7594 | 6260 | 7 | 7 | 0.09% | 0.11% | 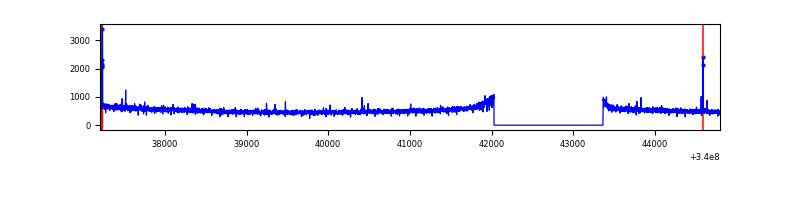 |
| D | 7594 | 6260 | 351 | 351 | 4.62% | 5.61% | 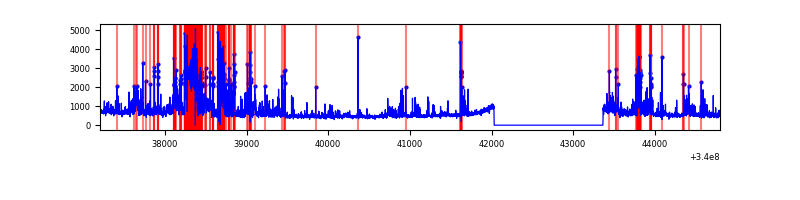 |
Top three noisy pixels from each quadrant. If the there are fewer than three noisy pixels in the level2.evt file, extra rows are filled as -1
| Pixel properties | Quadrant properties | ||||||
|---|---|---|---|---|---|---|---|
| Quadrant | DetID | PixID | Counts | Sigma | Mean | Median | Sigma |
| A | 0 | 13 | 181976 | 1063.99 | 856 | 842 | 170.2 |
| A | 13 | 248 | 34583 | 198.2 | 856 | 842 | 170.2 |
| A | 14 | 235 | 19265 | 108.22 | 856 | 842 | 170.2 |
| B | 15 | 33 | 45809 | 284.56 | 846 | 827 | 158.1 |
| B | 0 | 245 | 27419 | 168.22 | 846 | 827 | 158.1 |
| B | 5 | 172 | 26808 | 164.36 | 846 | 827 | 158.1 |
| C | 14 | 238 | 131371 | 702.09 | 800 | 807 | 186.0 |
| C | 15 | 208 | 37575 | 197.71 | 800 | 807 | 186.0 |
| C | 1 | 16 | 7620 | 36.64 | 800 | 807 | 186.0 |
| D | 1 | 52 | 1171503 | 6004.89 | 784 | 768 | 195.0 |
| D | 2 | 250 | 368287 | 1885.06 | 784 | 768 | 195.0 |
| D | 5 | 222 | 221476 | 1132.05 | 784 | 768 | 195.0 |
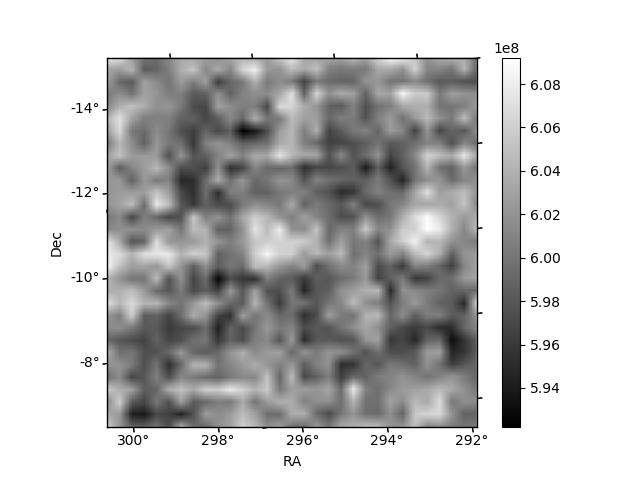
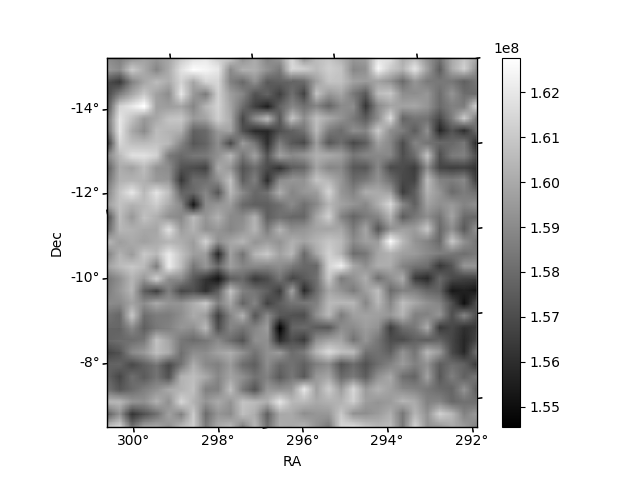
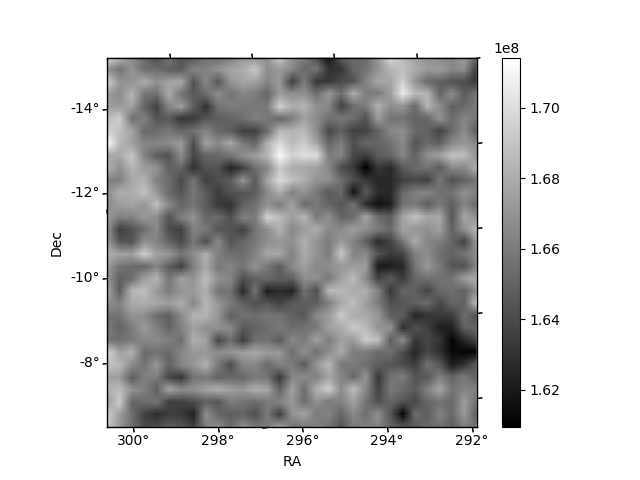
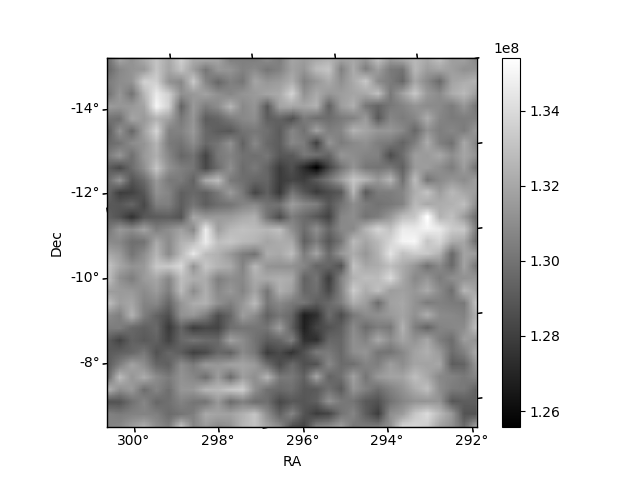
Histogram calculated using DETX and DETY for each event in the final _common_clean file
| Quadrant A | 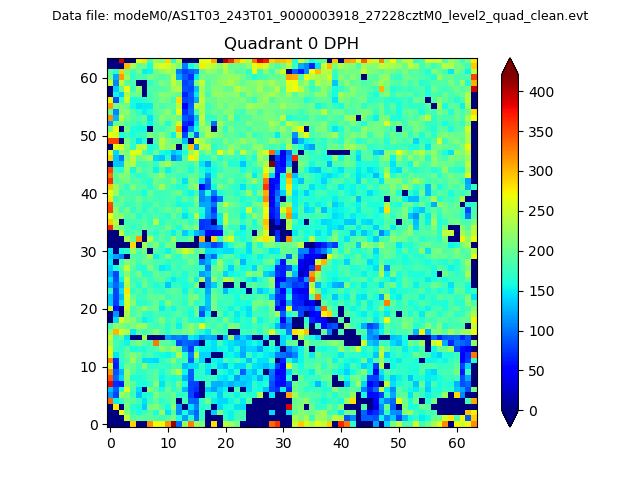 |
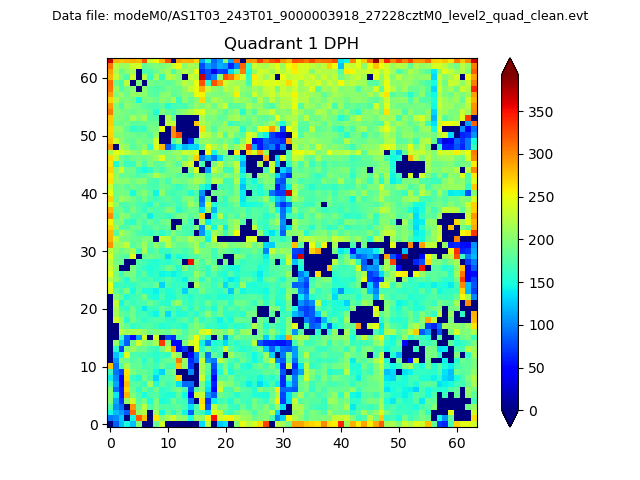 |
Quadrant B |
|---|---|---|---|
| Quadrant D |  |
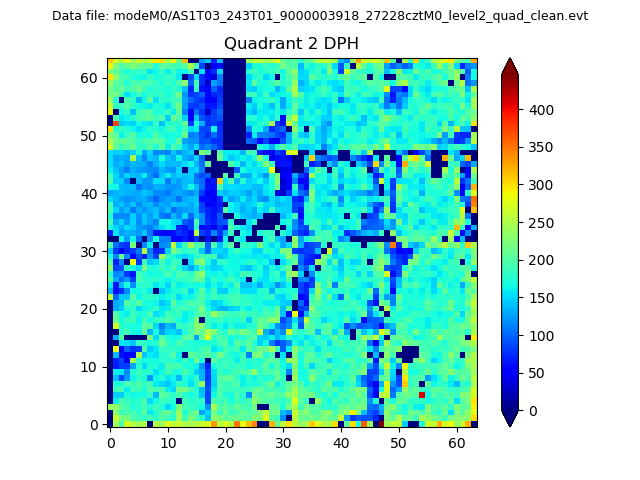 |
Quadrant C |
| Plot type | Count rate plots | Images |
|---|---|---|
| Comparison with Poisson distribution Blue bars denote a histogram of data divided into 1 sec bins. Red curve is a Poisson curve with rate = median count rate of data. |
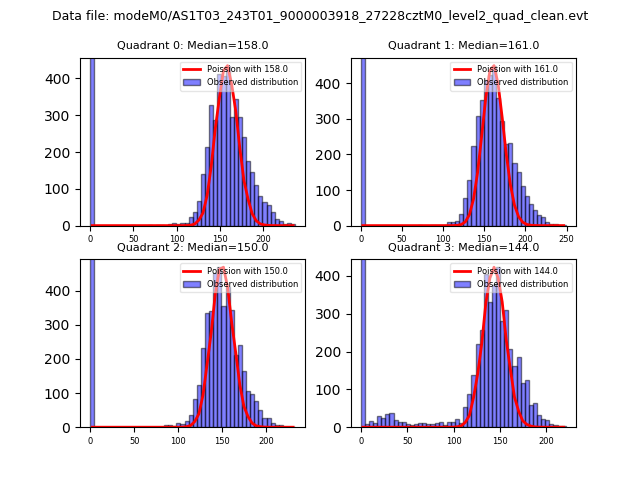 |
 |
| Quadrant-wise count rates Data is divided into 100 sec bins |
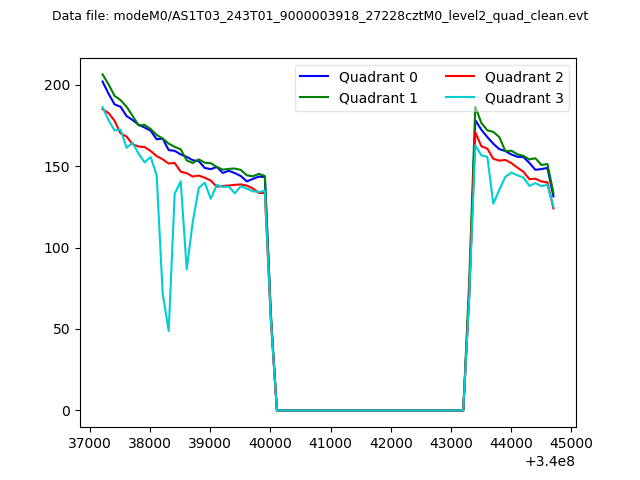 |
|
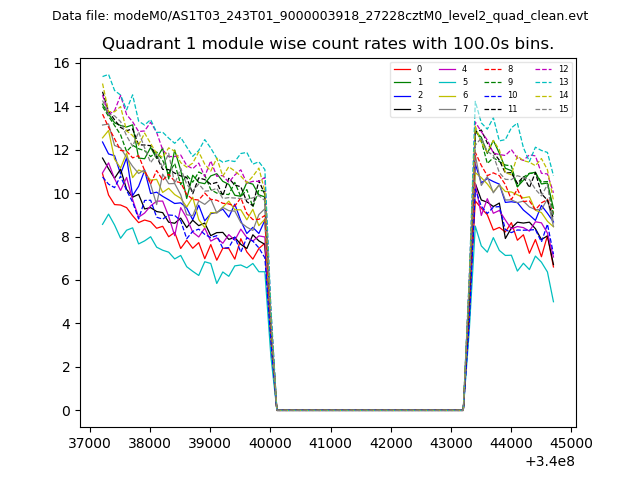
| Module-wise count rates for Quadrant A Data is divided into 100 sec bins |
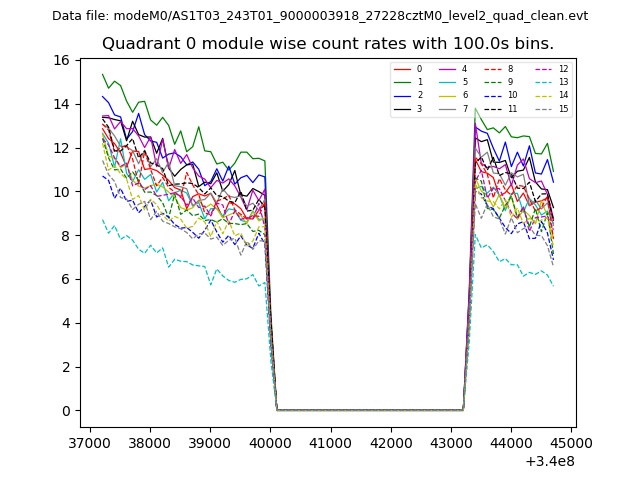 |
 |
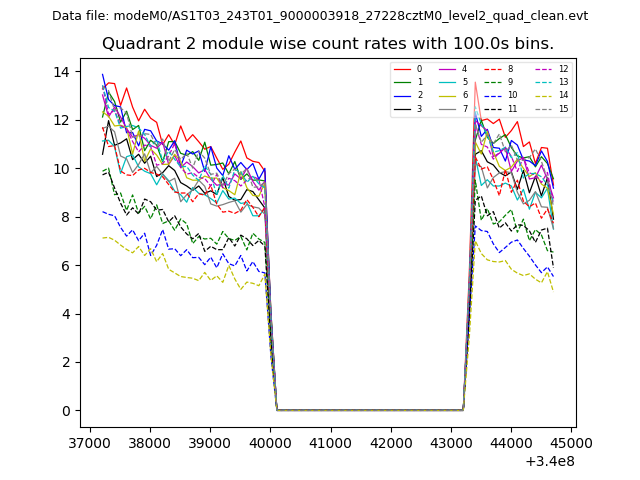
| Module-wise count rates for Quadrant B Data is divided into 100 sec bins |
 |
 |
| Module-wise count rates for Quadrant C Data is divided into 100 sec bins |
 |
 |
| Module-wise count rates for Quadrant D Data is divided into 100 sec bins |
 |
 |
| Parameter | Plot |
|---|---|
| CZT HV Monitor | 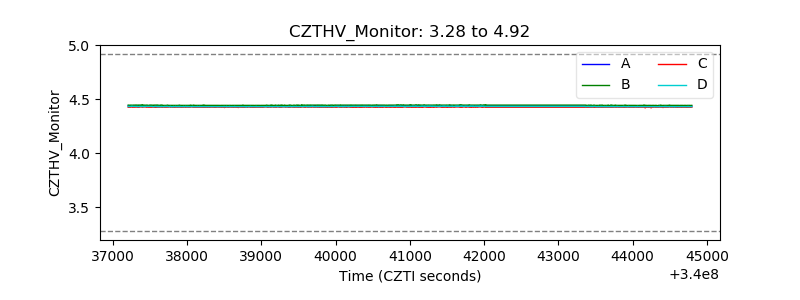 |
| D_VDD | 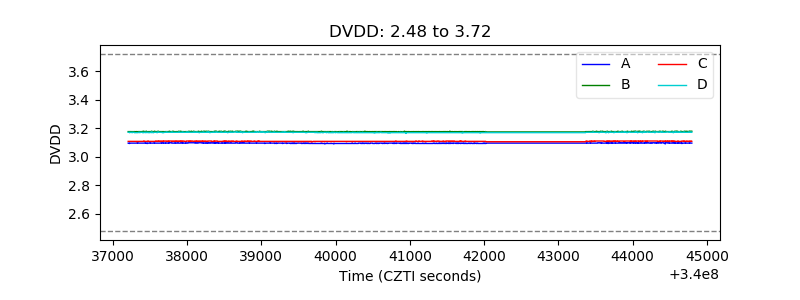 |
| Temperature 1 | 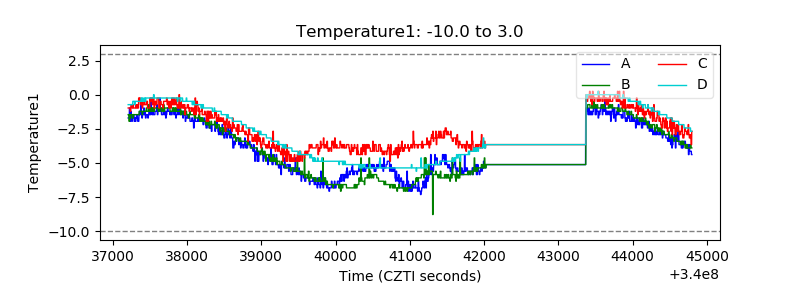 |
| Veto HV Monitor | 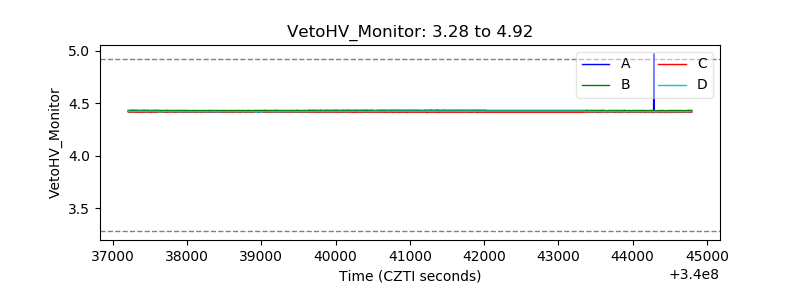 |
| Veto LLD | 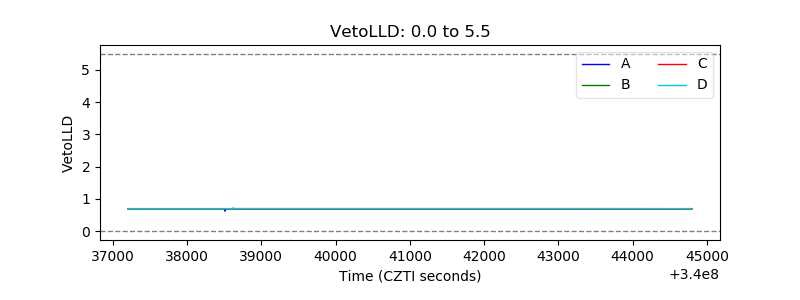 |
| Alpha Counter | 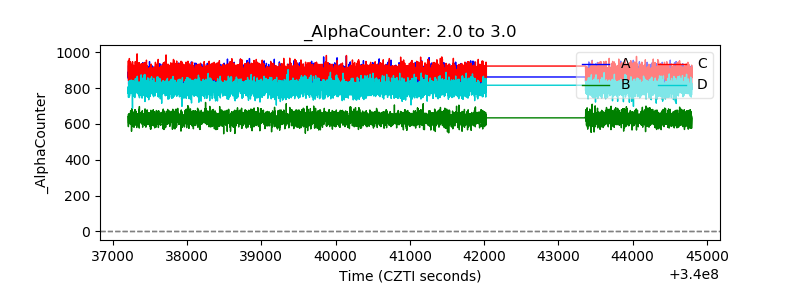 |
| _CPM_Rate | 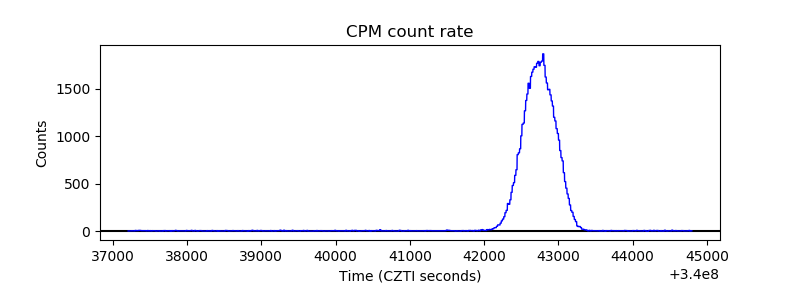 |
| CZT Counter | 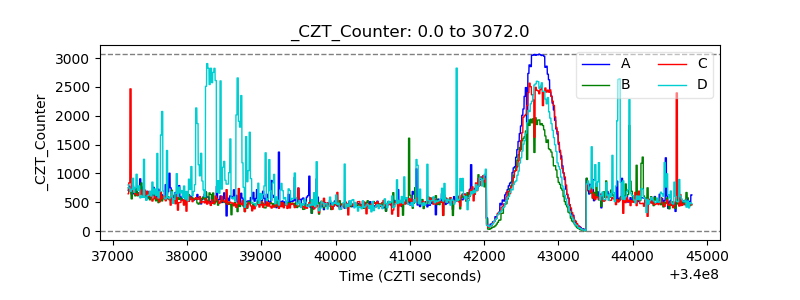 |
| +2.5 Volts monitor |  |
| +5 Volts monitor | 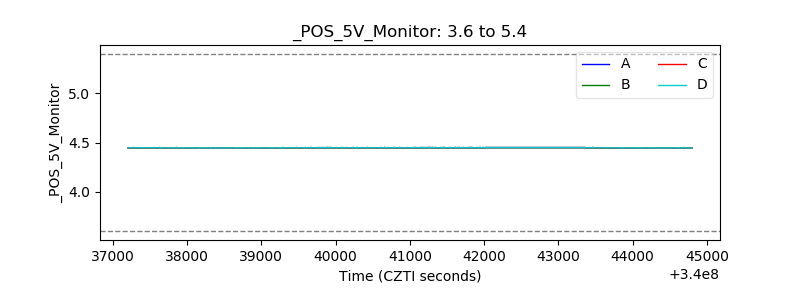 |
| _ROLL_ROT | 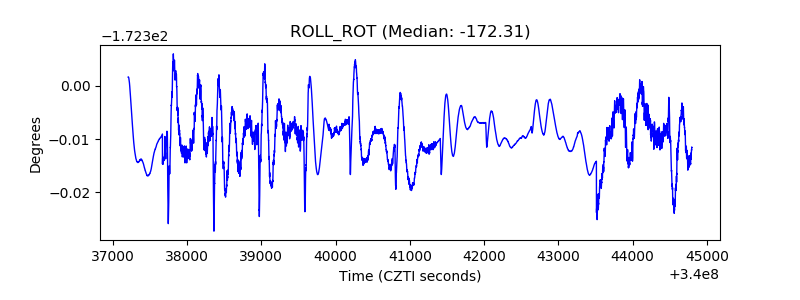 |
| _Roll_DEC | 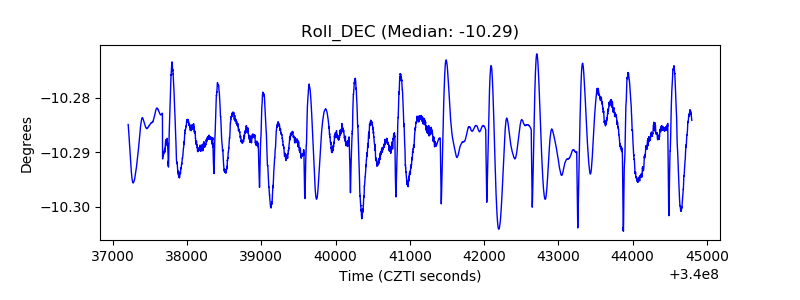 |
| _Roll_RA | 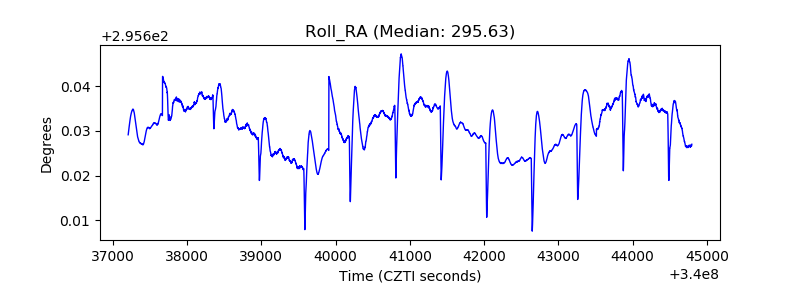 |
| Veto Counter | 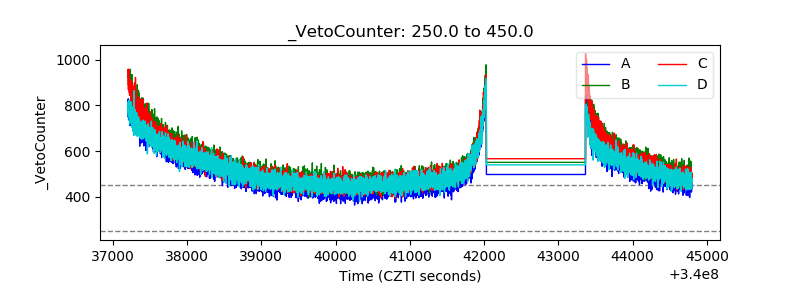 |