| Param | Original file | Final file |
|---|---|---|
| Filename | modeM0/AS1T03_243T01_9000003918_27229cztM0_level2.evt | modeM0/AS1T03_243T01_9000003918_27229cztM0_level2_quad_clean.evt |
| Size (bytes) | 500,904,000 | 94,633,920 |
| Size | 477.7 MB | 90.2 MB |
| Events in quadrant A | 3,373,162 | 621,057 |
| Events in quadrant B | 3,508,807 | 633,288 |
| Events in quadrant C | 3,257,032 | 593,070 |
| Events in quadrant D | 4,592,715 | 567,856 |
| Mode M9 | |||
|---|---|---|---|
| Quadrant | BADHDUFLAG | Total packets | Discarded packets |
| A | 0 | 12 | 0 |
| B | 0 | 12 | 0 |
| C | 0 | 12 | 0 |
| D | 0 | 12 | 0 |
| Mode M0 | |||
|---|---|---|---|
| Quadrant | BADHDUFLAG | Total packets | Discarded packets |
| A | 0 | 14101 | 0 |
| B | 0 | 14443 | 0 |
| C | 0 | 13733 | 0 |
| D | 0 | 17927 | 0 |
| Quadrant | Total seconds | Saturated seconds | Saturation percentage |
|---|---|---|---|
| A | 6455 | 74 | 1.146398% |
| B | 6456 | 88 | 1.363073% |
| C | 6456 | 88 | 1.363073% |
| D | 6456 | 242 | 3.748451% |
Noise dominated data is calculated using 1-second bins in cleaned event files. If a bin has >2000 counts, and if more than 50% of those come from <1% of pixels, then it is considered to be noise-dominated and hence unusable.
| Quadrant | # 1 sec bins | Bins with >0 counts | Bins with >2000 counts | High rate bins dominated by noise | Noise dominated (total time) | Noise dominated (detector-on time) | Marked lightcurve |
|---|---|---|---|---|---|---|---|
| A | 7630 | 6457 | 8 | 8 | 0.10% | 0.12% | 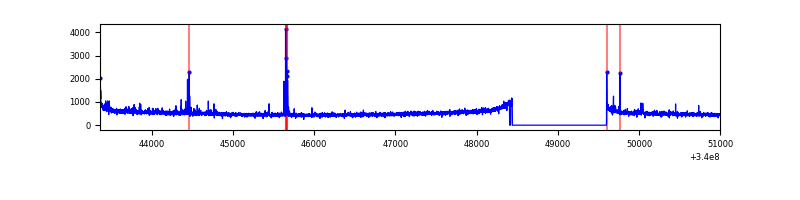 |
| B | 7631 | 6458 | 1 | 1 | 0.01% | 0.02% | 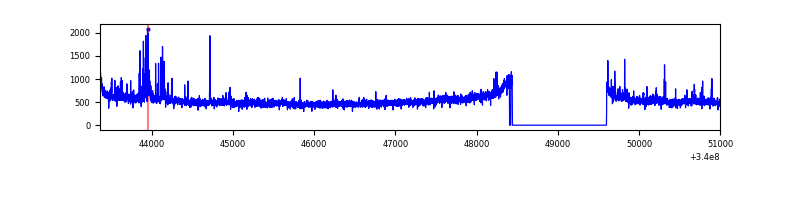 |
| C | 7631 | 6458 | 2 | 2 | 0.03% | 0.03% | 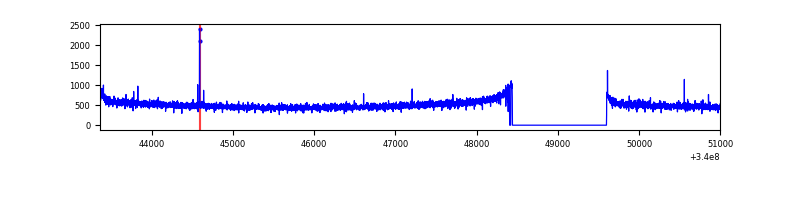 |
| D | 7631 | 6458 | 174 | 174 | 2.28% | 2.69% | 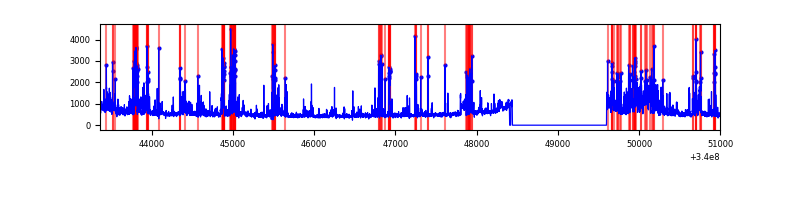 |
Top three noisy pixels from each quadrant. If the there are fewer than three noisy pixels in the level2.evt file, extra rows are filled as -1
| Pixel properties | Quadrant properties | ||||||
|---|---|---|---|---|---|---|---|
| Quadrant | DetID | PixID | Counts | Sigma | Mean | Median | Sigma |
| A | 0 | 13 | 35382 | 204.39 | 843 | 830 | 169.0 |
| A | 13 | 248 | 32584 | 187.84 | 843 | 830 | 169.0 |
| A | 15 | 174 | 32208 | 185.62 | 843 | 830 | 169.0 |
| B | 3 | 64 | 92796 | 580.93 | 839 | 819 | 158.3 |
| B | 5 | 172 | 38753 | 239.59 | 839 | 819 | 158.3 |
| B | 0 | 245 | 34247 | 211.13 | 839 | 819 | 158.3 |
| C | 14 | 238 | 128625 | 681.67 | 799 | 806 | 187.5 |
| C | 15 | 208 | 13645 | 68.47 | 799 | 806 | 187.5 |
| C | 13 | 61 | 5674 | 25.96 | 799 | 806 | 187.5 |
| D | 1 | 52 | 705584 | 3696.0 | 791 | 774 | 190.7 |
| D | 2 | 250 | 352012 | 1841.88 | 791 | 774 | 190.7 |
| D | 5 | 222 | 203175 | 1061.39 | 791 | 774 | 190.7 |
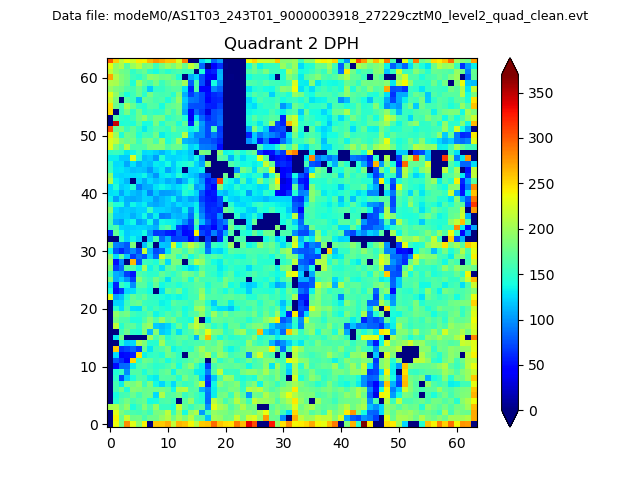
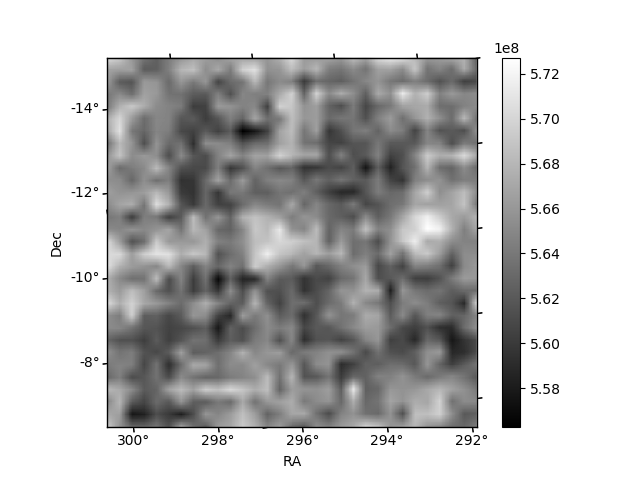
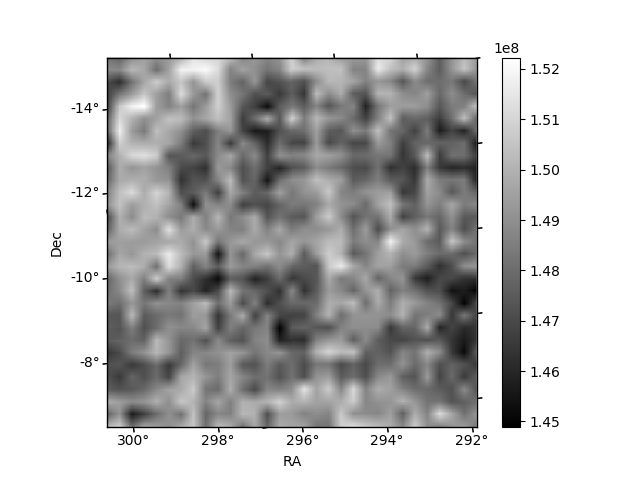
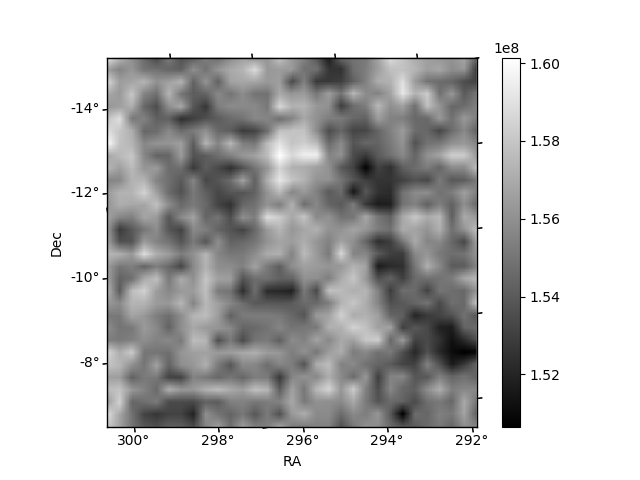
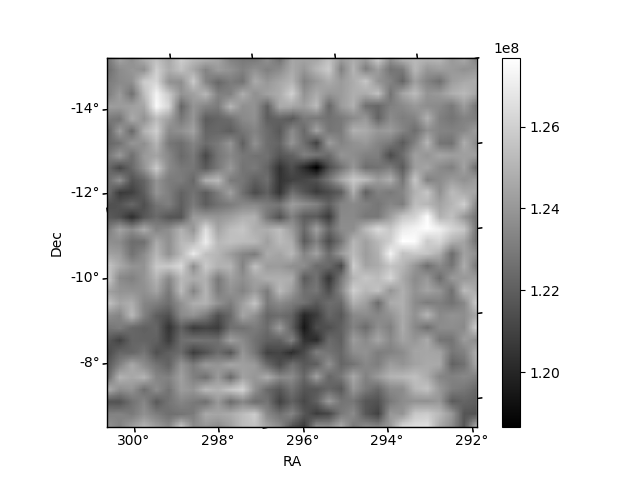
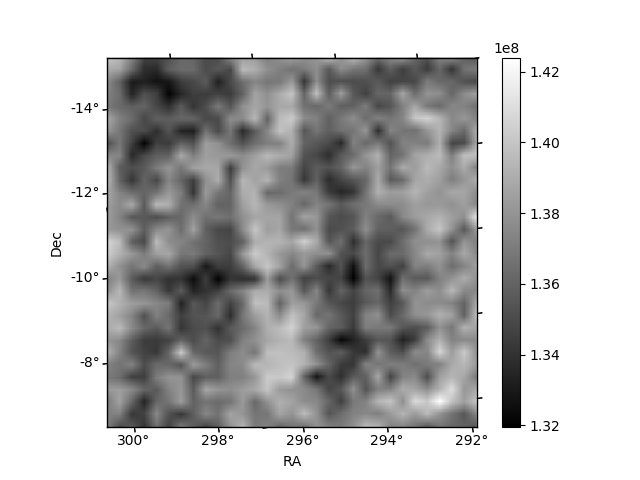
Histogram calculated using DETX and DETY for each event in the final _common_clean file
| Quadrant A | 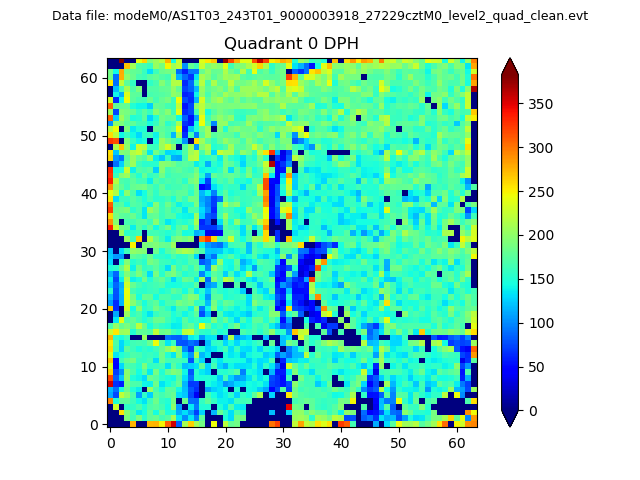 |
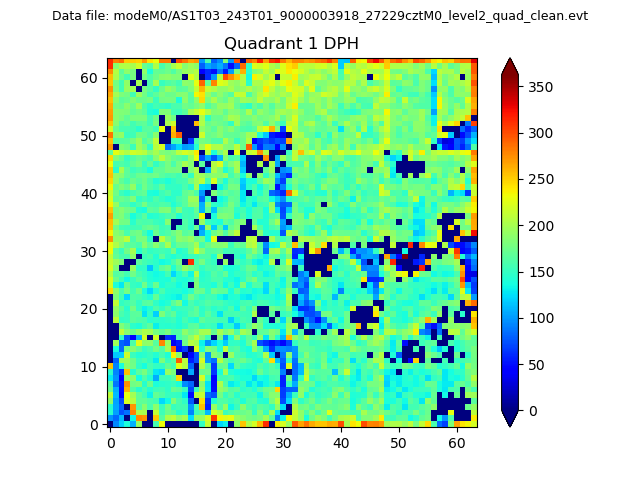 |
Quadrant B |
|---|---|---|---|
| Quadrant D | 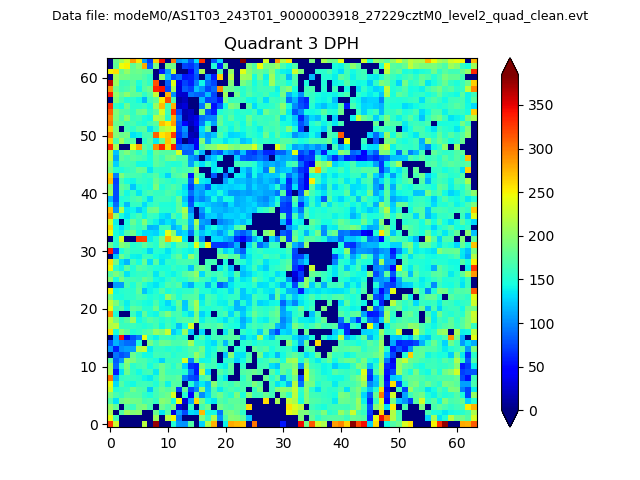 |
 |
Quadrant C |
| Plot type | Count rate plots | Images |
|---|---|---|
| Comparison with Poisson distribution Blue bars denote a histogram of data divided into 1 sec bins. Red curve is a Poisson curve with rate = median count rate of data. |
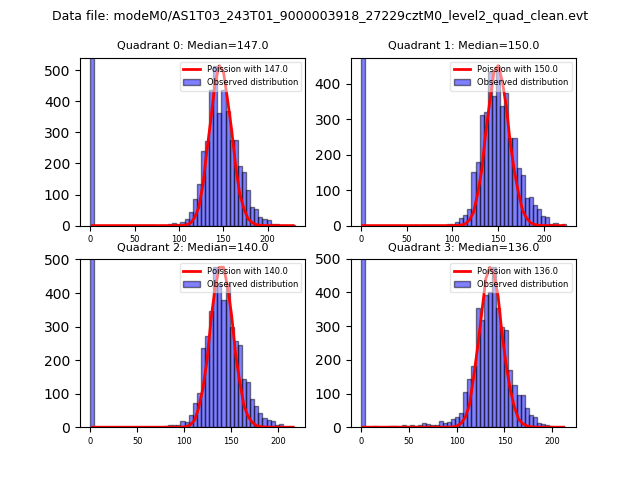 |
 |
| Quadrant-wise count rates Data is divided into 100 sec bins |
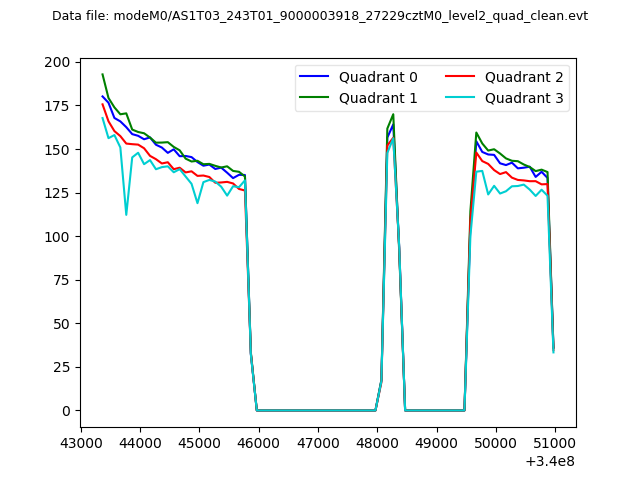 |
|
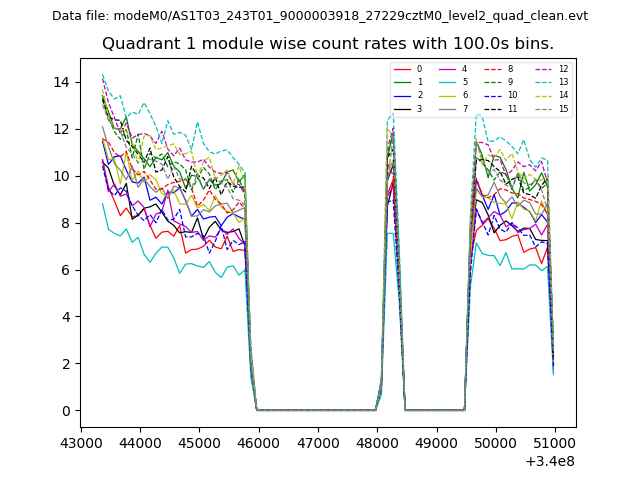
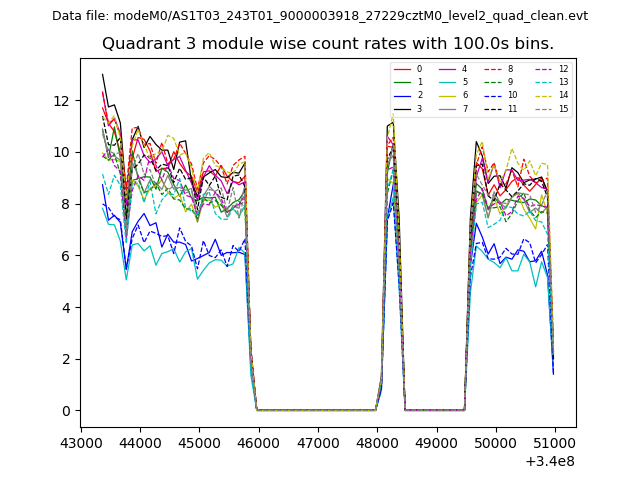
| Module-wise count rates for Quadrant A Data is divided into 100 sec bins |
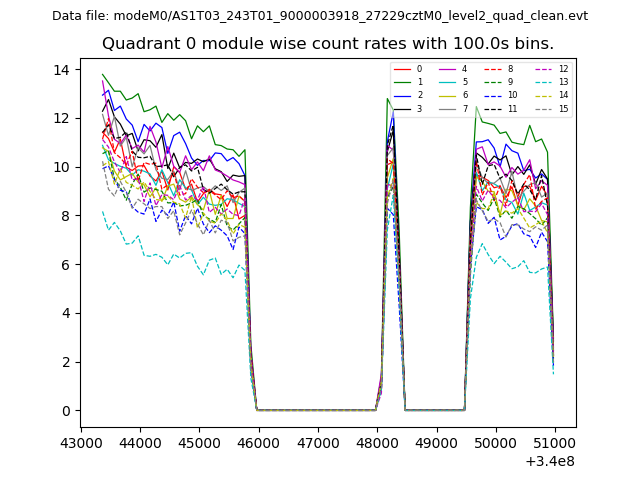 |
 |
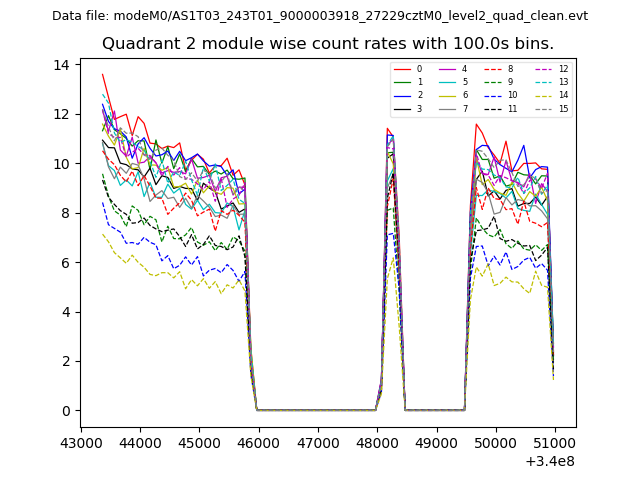
| Module-wise count rates for Quadrant B Data is divided into 100 sec bins |
 |
 |
| Module-wise count rates for Quadrant C Data is divided into 100 sec bins |
 |
 |
| Module-wise count rates for Quadrant D Data is divided into 100 sec bins |
 |
 |
| Parameter | Plot |
|---|---|
| CZT HV Monitor | 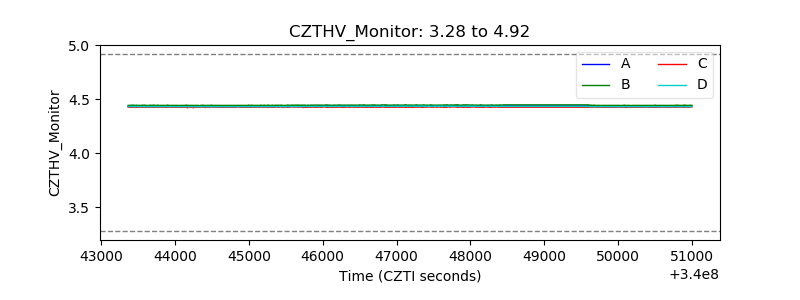 |
| D_VDD |  |
| Temperature 1 | 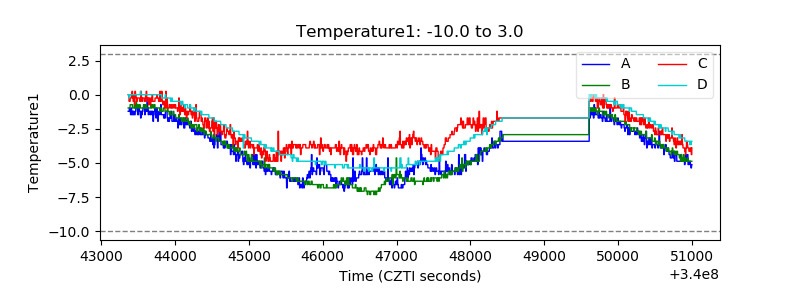 |
| Veto HV Monitor | 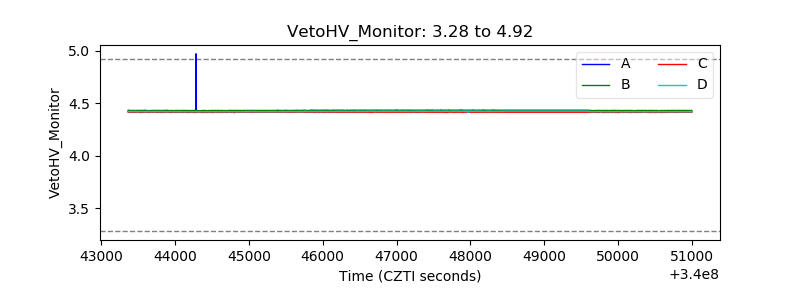 |
| Veto LLD | 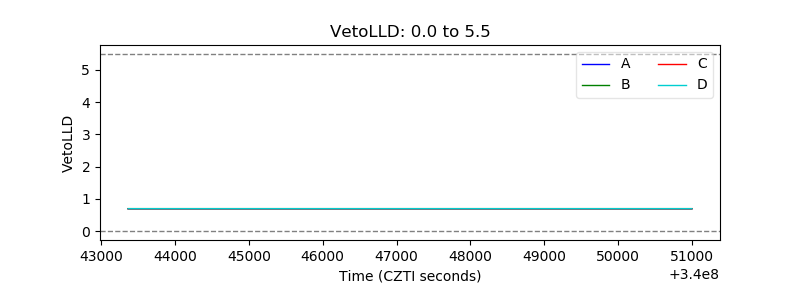 |
| Alpha Counter | 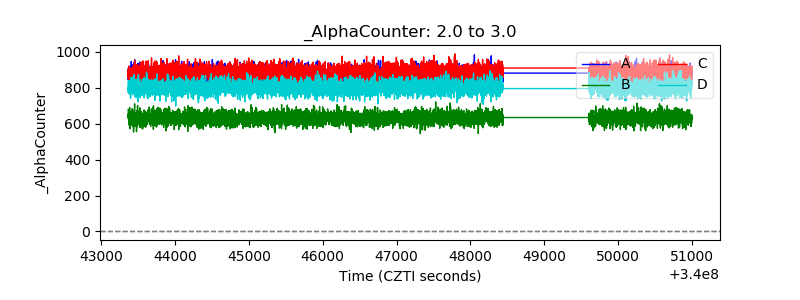 |
| _CPM_Rate | 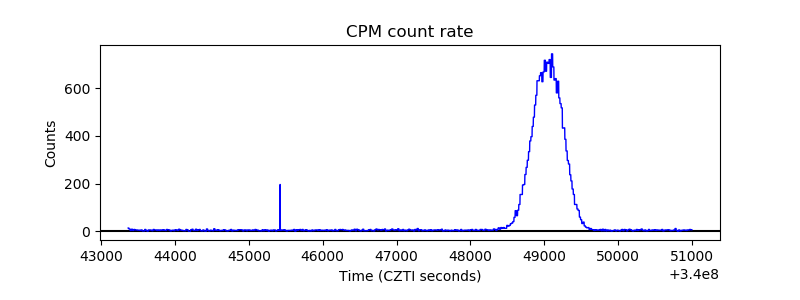 |
| CZT Counter | 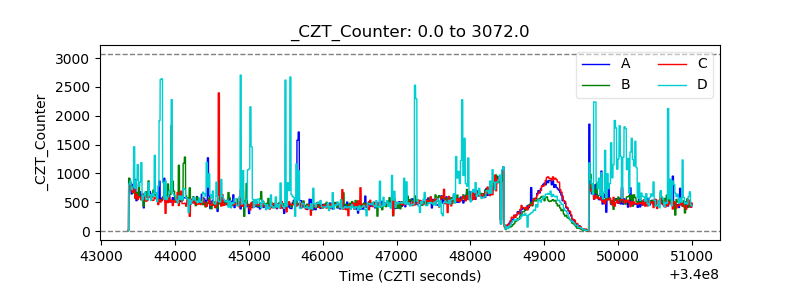 |
| +2.5 Volts monitor |  |
| +5 Volts monitor |  |
| _ROLL_ROT | 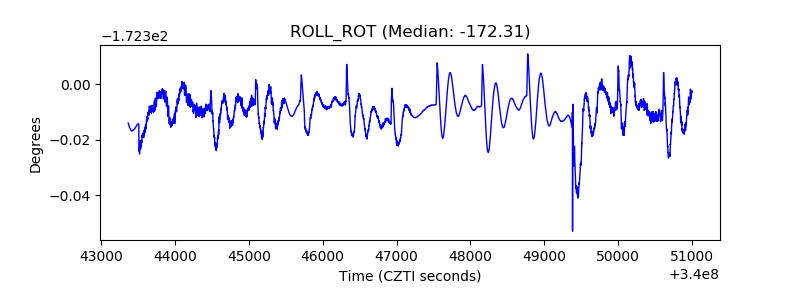 |
| _Roll_DEC | 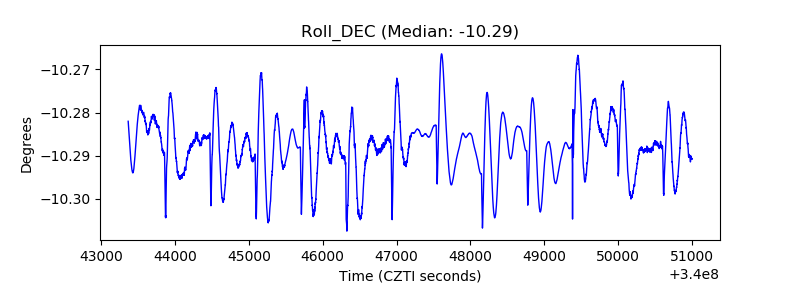 |
| _Roll_RA | 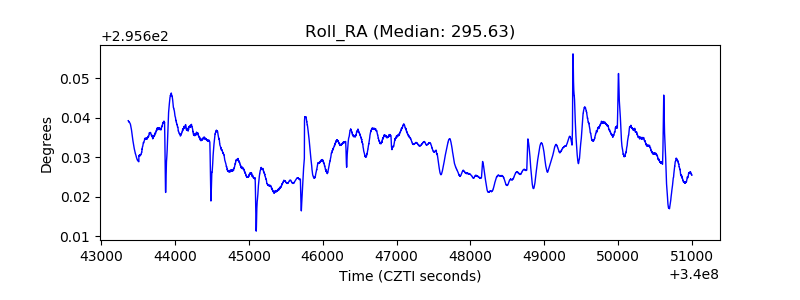 |
| Veto Counter | 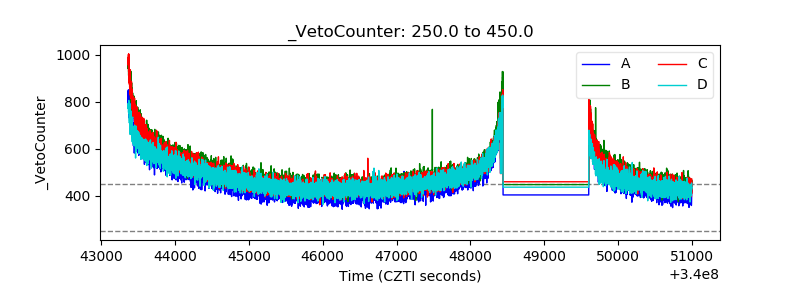 |