| Param | Original file | Final file |
|---|---|---|
| Filename | modeM0/AS1T03_243T01_9000003918_27230cztM0_level2.evt | modeM0/AS1T03_243T01_9000003918_27230cztM0_level2_quad_clean.evt |
| Size (bytes) | 526,089,600 | 97,850,880 |
| Size | 501.7 MB | 93.3 MB |
| Events in quadrant A | 3,382,318 | 636,417 |
| Events in quadrant B | 3,728,482 | 647,513 |
| Events in quadrant C | 3,383,688 | 613,186 |
| Events in quadrant D | 4,972,991 | 588,194 |
| Mode M9 | |||
|---|---|---|---|
| Quadrant | BADHDUFLAG | Total packets | Discarded packets |
| A | 0 | 11 | 0 |
| B | 0 | 12 | 0 |
| C | 0 | 12 | 0 |
| D | 0 | 12 | 0 |
| Mode M0 | |||
|---|---|---|---|
| Quadrant | BADHDUFLAG | Total packets | Discarded packets |
| A | 0 | 14418 | 0 |
| B | 0 | 15332 | 0 |
| C | 0 | 14410 | 0 |
| D | 0 | 19373 | 0 |
| Quadrant | Total seconds | Saturated seconds | Saturation percentage |
|---|---|---|---|
| A | 6863 | 53 | 0.772257% |
| B | 6863 | 106 | 1.544514% |
| C | 6863 | 90 | 1.311380% |
| D | 6863 | 213 | 3.103599% |
Noise dominated data is calculated using 1-second bins in cleaned event files. If a bin has >2000 counts, and if more than 50% of those come from <1% of pixels, then it is considered to be noise-dominated and hence unusable.
| Quadrant | # 1 sec bins | Bins with >0 counts | Bins with >2000 counts | High rate bins dominated by noise | Noise dominated (total time) | Noise dominated (detector-on time) | Marked lightcurve |
|---|---|---|---|---|---|---|---|
| A | 7613 | 6864 | 4 | 4 | 0.05% | 0.06% | 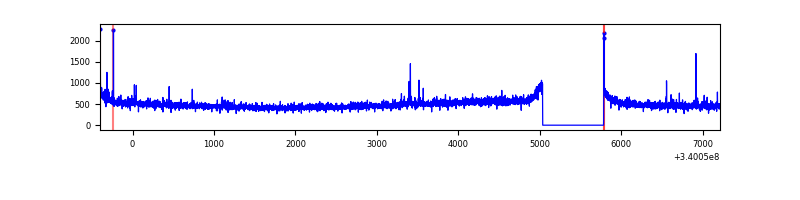 |
| B | 7613 | 6864 | 13 | 13 | 0.17% | 0.19% | 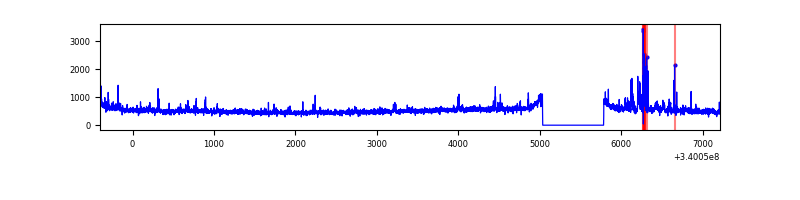 |
| C | 7613 | 6864 | 1 | 1 | 0.01% | 0.01% | 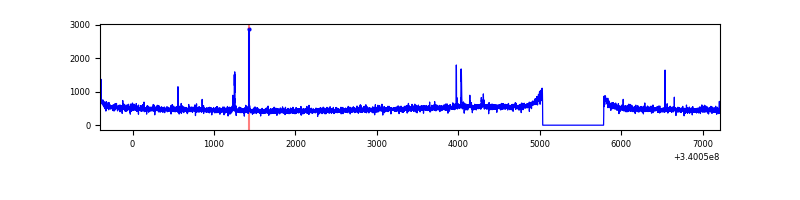 |
| D | 7613 | 6864 | 136 | 136 | 1.79% | 1.98% | 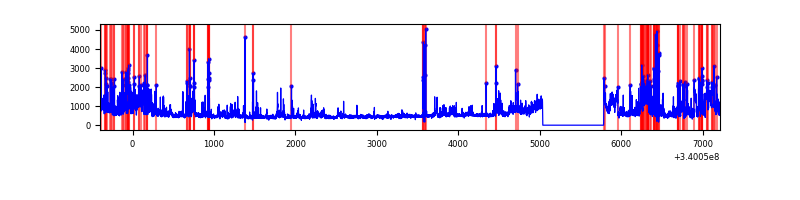 |
Top three noisy pixels from each quadrant. If the there are fewer than three noisy pixels in the level2.evt file, extra rows are filled as -1
| Pixel properties | Quadrant properties | ||||||
|---|---|---|---|---|---|---|---|
| Quadrant | DetID | PixID | Counts | Sigma | Mean | Median | Sigma |
| A | 12 | 96 | 19692 | 109.25 | 862 | 843 | 172.5 |
| A | 8 | 192 | 15909 | 87.32 | 862 | 843 | 172.5 |
| A | 13 | 248 | 15101 | 82.64 | 862 | 843 | 172.5 |
| B | 3 | 64 | 222192 | 1332.26 | 861 | 840 | 166.1 |
| B | 5 | 172 | 60618 | 359.79 | 861 | 840 | 166.1 |
| B | 0 | 190 | 22056 | 127.69 | 861 | 840 | 166.1 |
| C | 14 | 238 | 132206 | 673.72 | 822 | 827 | 195.0 |
| C | 15 | 208 | 47985 | 241.83 | 822 | 827 | 195.0 |
| C | 2 | 16 | 5832 | 25.67 | 822 | 827 | 195.0 |
| D | 1 | 52 | 1244291 | 5996.6 | 817 | 800 | 207.4 |
| D | 5 | 222 | 255333 | 1227.46 | 817 | 800 | 207.4 |
| D | 2 | 250 | 122492 | 586.85 | 817 | 800 | 207.4 |
Histogram calculated using DETX and DETY for each event in the final _common_clean file
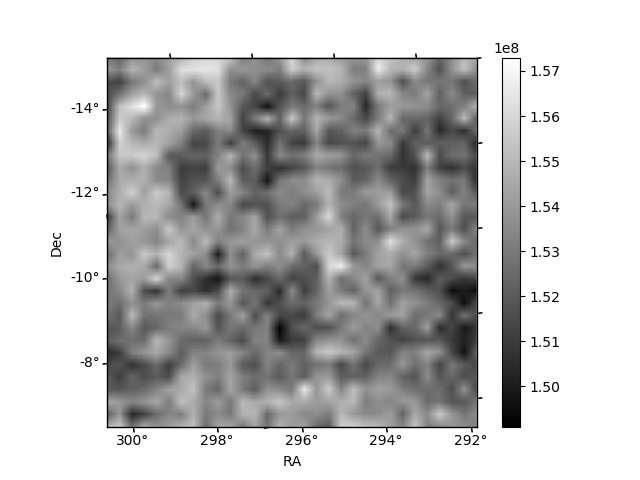
| Quadrant A |  |
 |
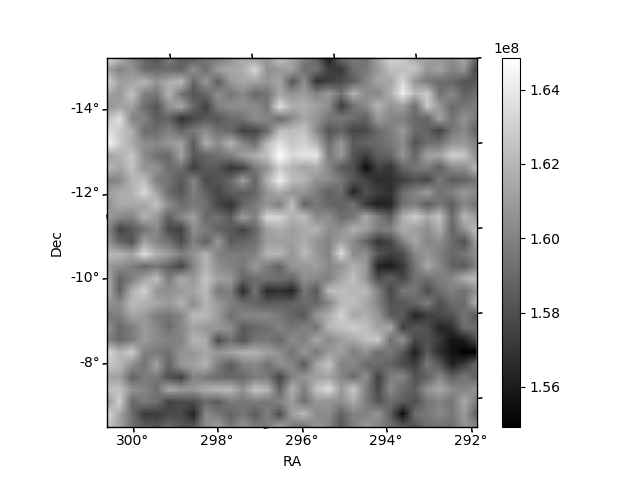
Quadrant B |
|---|---|---|---|
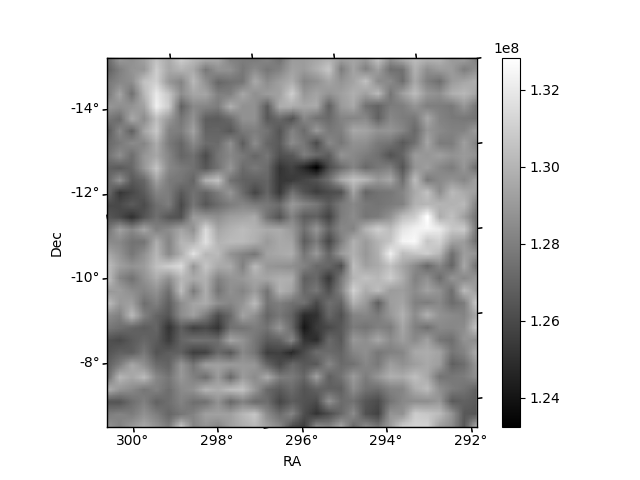
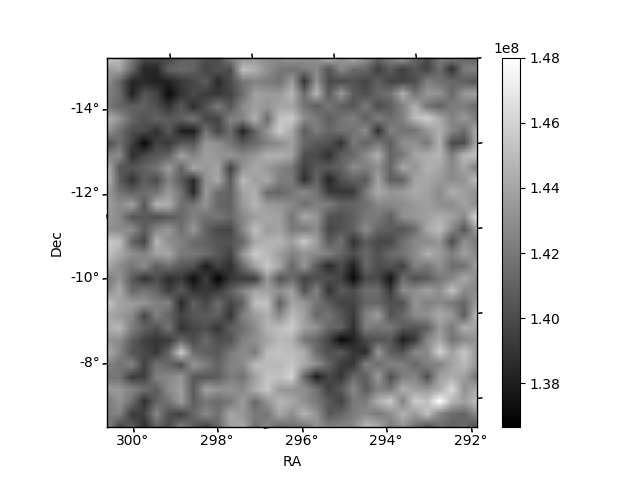
| Quadrant D |  |
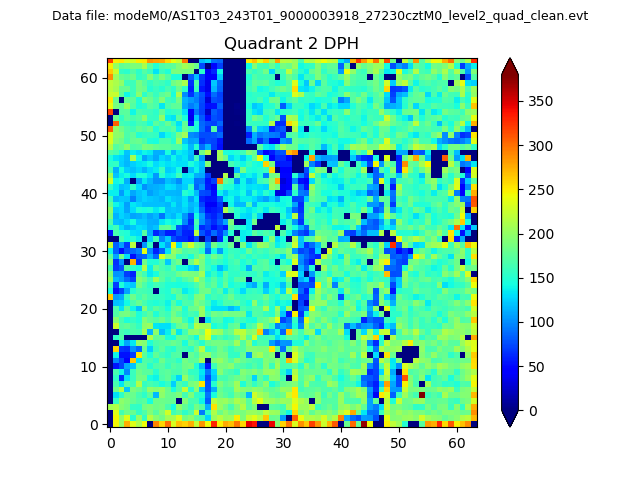 |
Quadrant C |
| Plot type | Count rate plots | Images |
|---|---|---|
| Comparison with Poisson distribution Blue bars denote a histogram of data divided into 1 sec bins. Red curve is a Poisson curve with rate = median count rate of data. |
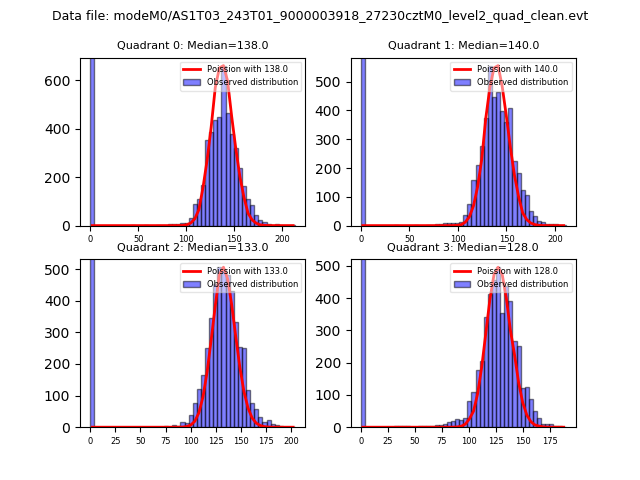 |
 |
| Quadrant-wise count rates Data is divided into 100 sec bins |
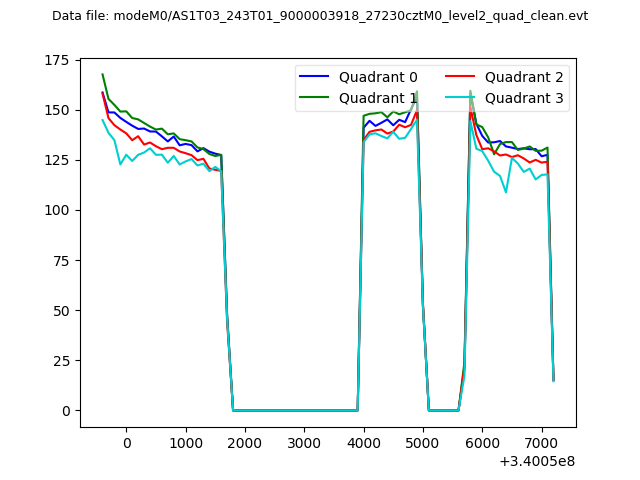 |
|
| Module-wise count rates for Quadrant A Data is divided into 100 sec bins |
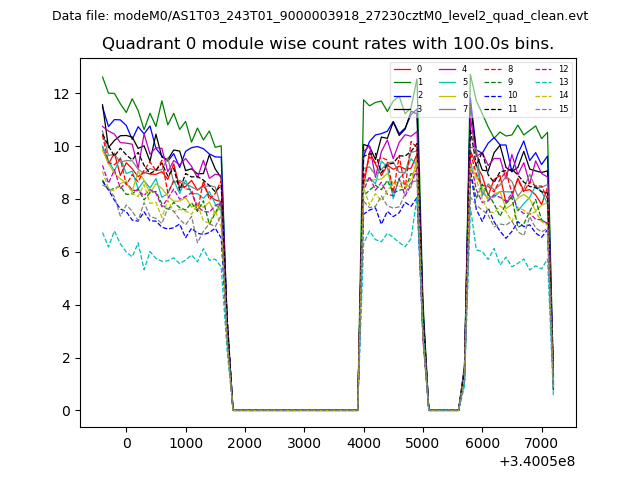 |
 |
| Module-wise count rates for Quadrant B Data is divided into 100 sec bins |
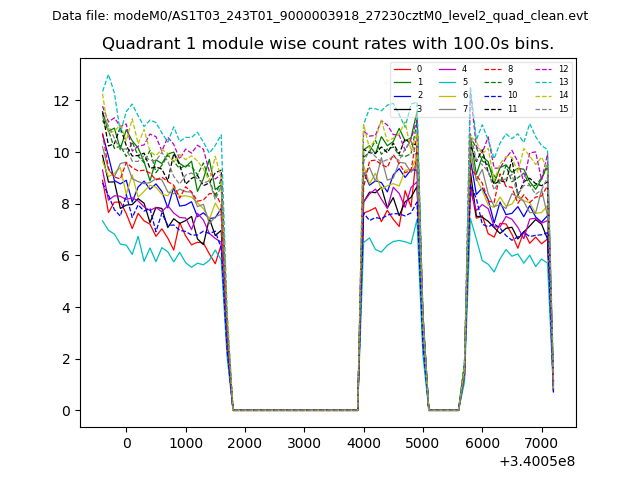 |
 |
| Module-wise count rates for Quadrant C Data is divided into 100 sec bins |
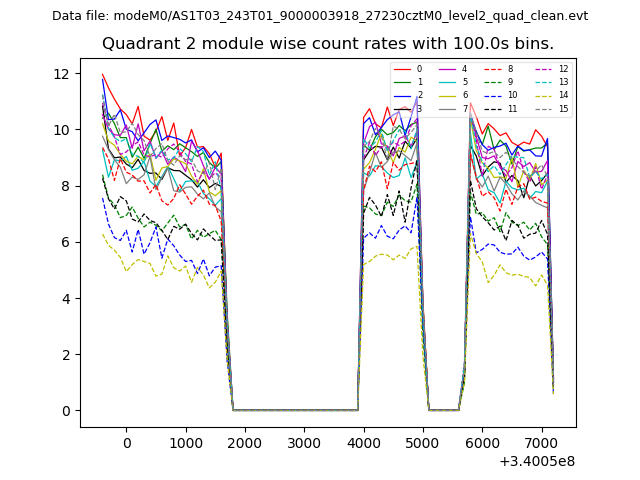 |
 |
| Module-wise count rates for Quadrant D Data is divided into 100 sec bins |
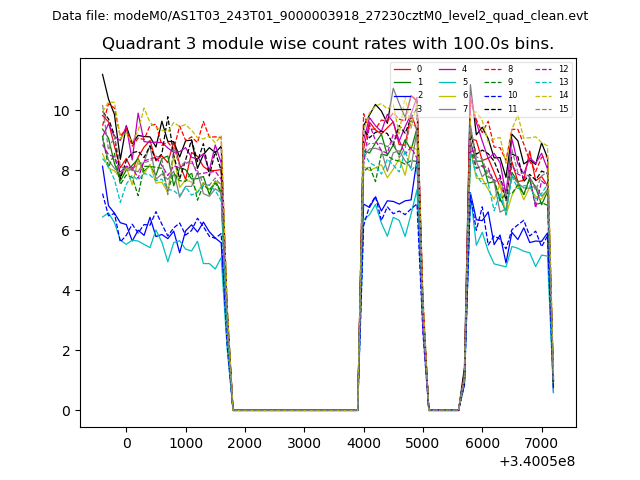 |
 |
| Parameter | Plot |
|---|---|
| CZT HV Monitor | 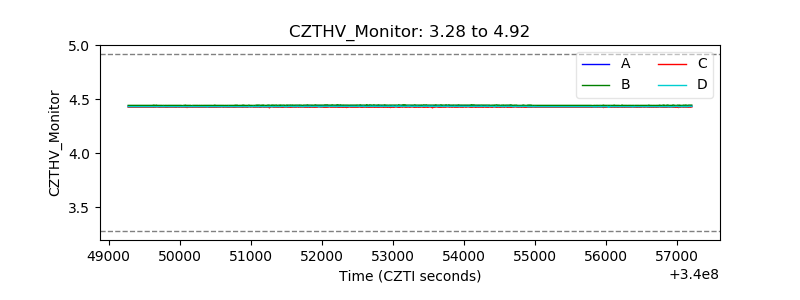 |
| D_VDD | 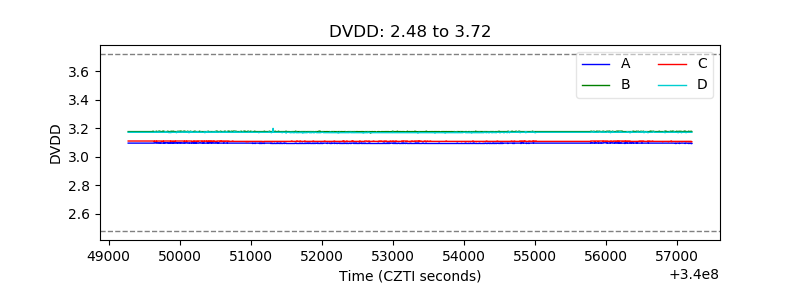 |
| Temperature 1 | 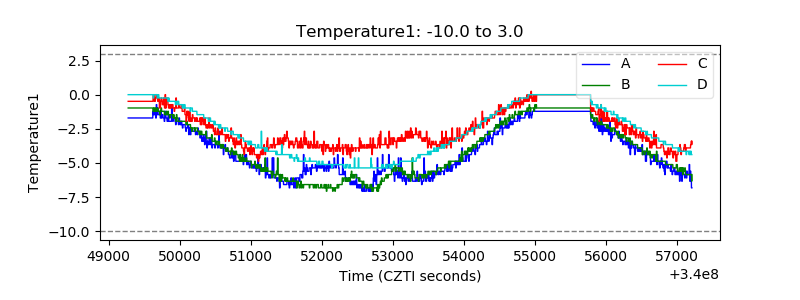 |
| Veto HV Monitor | 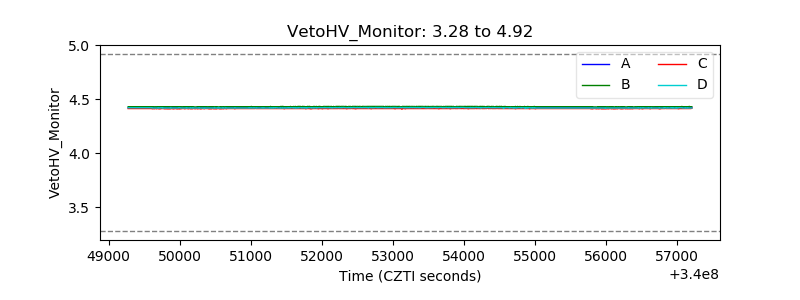 |
| Veto LLD | 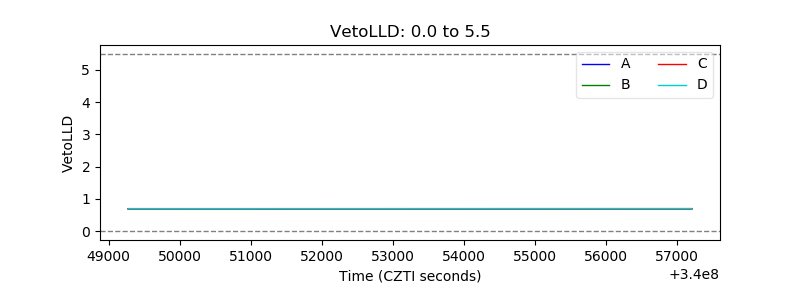 |
| Alpha Counter | 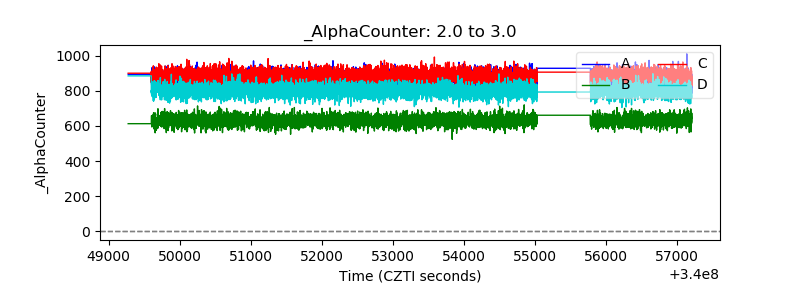 |
| _CPM_Rate |  |
| CZT Counter | 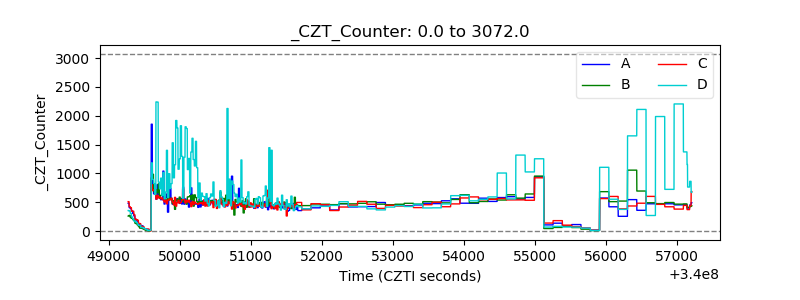 |
| +2.5 Volts monitor | 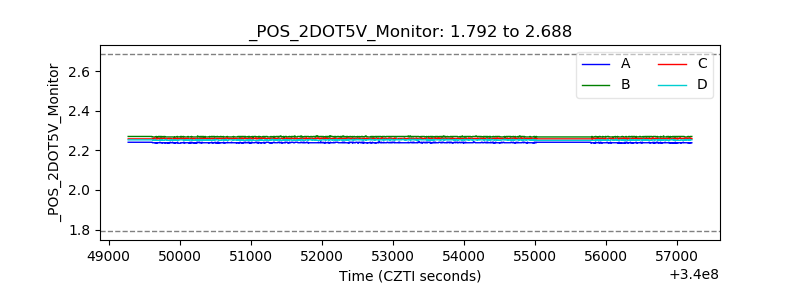 |
| +5 Volts monitor |  |
| _ROLL_ROT | 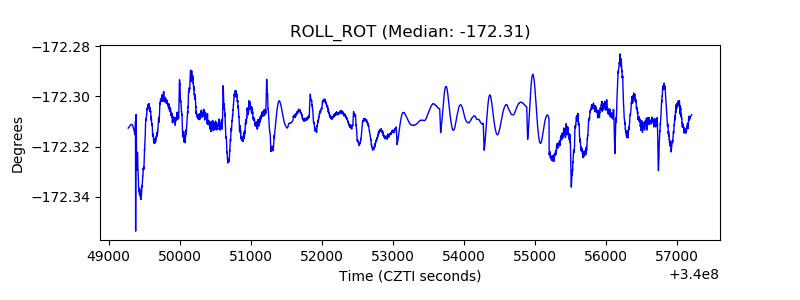 |
| _Roll_DEC | 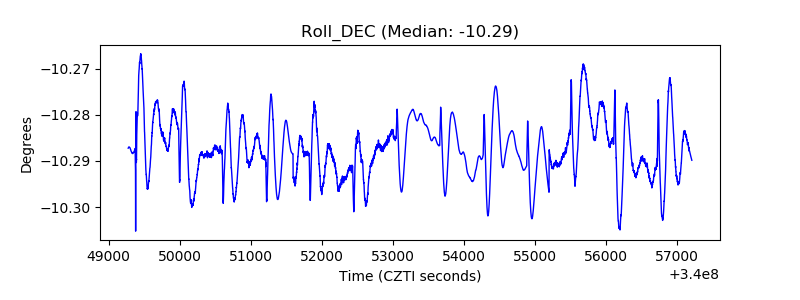 |
| _Roll_RA | 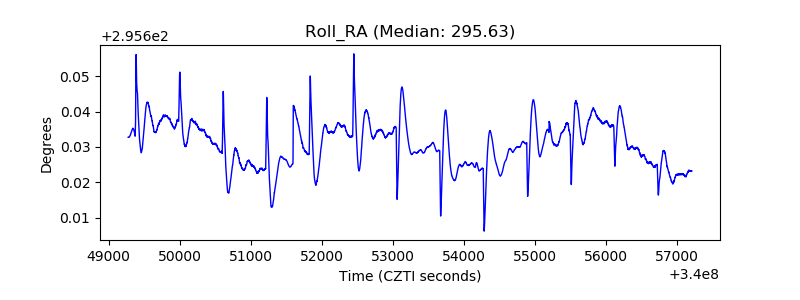 |
| Veto Counter | 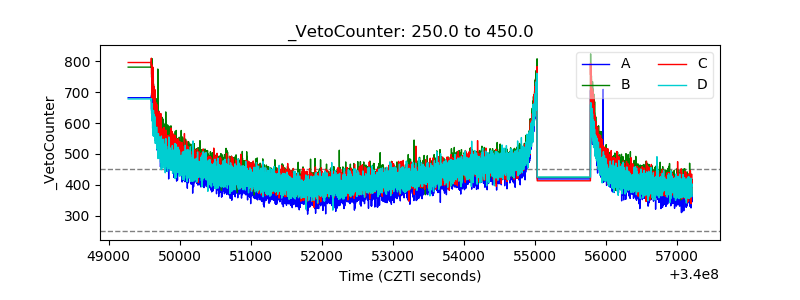 |