| Param | Original file | Final file |
|---|---|---|
| Filename | modeM0/AS1T03_243T01_9000003918_27231cztM0_level2.evt | modeM0/AS1T03_243T01_9000003918_27231cztM0_level2_quad_clean.evt |
| Size (bytes) | 595,923,840 | 104,544,000 |
| Size | 568.3 MB | 99.7 MB |
| Events in quadrant A | 3,658,188 | 680,182 |
| Events in quadrant B | 4,317,044 | 681,092 |
| Events in quadrant C | 3,593,026 | 656,336 |
| Events in quadrant D | 5,973,370 | 628,785 |
| Mode M9 | |||
|---|---|---|---|
| Quadrant | BADHDUFLAG | Total packets | Discarded packets |
| A | 0 | 11 | 0 |
| B | 0 | 11 | 0 |
| C | 0 | 11 | 0 |
| D | 0 | 11 | 0 |
| Mode M0 | |||
|---|---|---|---|
| Quadrant | BADHDUFLAG | Total packets | Discarded packets |
| A | 0 | 15687 | 0 |
| B | 0 | 17522 | 0 |
| C | 0 | 15437 | 0 |
| D | 0 | 22846 | 0 |
| Quadrant | Total seconds | Saturated seconds | Saturation percentage |
|---|---|---|---|
| A | 7469 | 73 | 0.977373% |
| B | 7469 | 333 | 4.458428% |
| C | 7470 | 134 | 1.793842% |
| D | 7470 | 322 | 4.310576% |
Noise dominated data is calculated using 1-second bins in cleaned event files. If a bin has >2000 counts, and if more than 50% of those come from <1% of pixels, then it is considered to be noise-dominated and hence unusable.
| Quadrant | # 1 sec bins | Bins with >0 counts | Bins with >2000 counts | High rate bins dominated by noise | Noise dominated (total time) | Noise dominated (detector-on time) | Marked lightcurve |
|---|---|---|---|---|---|---|---|
| A | 8554 | 7472 | 3 | 3 | 0.04% | 0.04% | 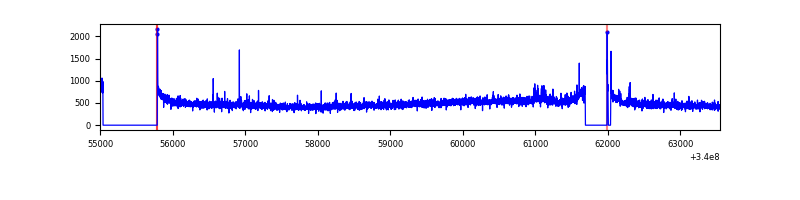 |
| B | 8554 | 7472 | 73 | 73 | 0.85% | 0.98% | 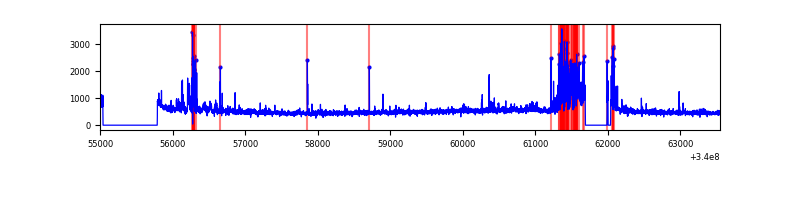 |
| C | 8555 | 7473 | 0 | 0 | 0.00% | 0.00% | 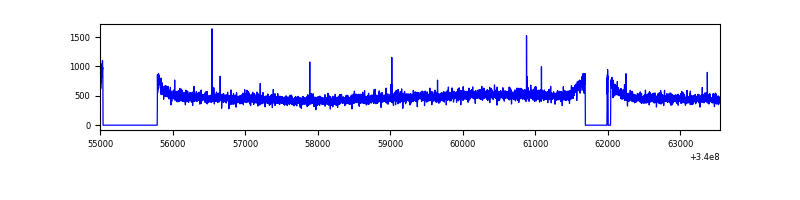 |
| D | 8555 | 7473 | 250 | 250 | 2.92% | 3.35% | 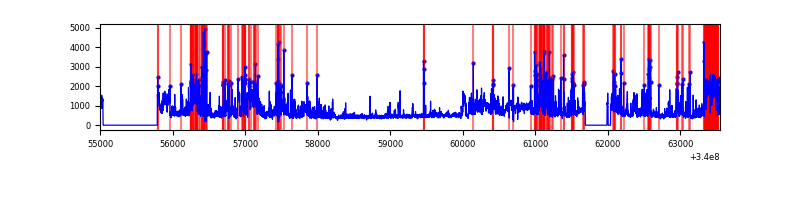 |
Top three noisy pixels from each quadrant. If the there are fewer than three noisy pixels in the level2.evt file, extra rows are filled as -1
| Pixel properties | Quadrant properties | ||||||
|---|---|---|---|---|---|---|---|
| Quadrant | DetID | PixID | Counts | Sigma | Mean | Median | Sigma |
| A | 0 | 13 | 55454 | 292.51 | 923 | 903 | 186.5 |
| A | 8 | 192 | 17633 | 89.71 | 923 | 903 | 186.5 |
| A | 13 | 254 | 12049 | 59.77 | 923 | 903 | 186.5 |
| B | 15 | 33 | 348001 | 1977.31 | 912 | 888 | 175.5 |
| B | 3 | 64 | 210468 | 1193.86 | 912 | 888 | 175.5 |
| B | 5 | 172 | 120888 | 683.57 | 912 | 888 | 175.5 |
| C | 14 | 238 | 140642 | 668.76 | 881 | 886 | 209.0 |
| C | 2 | 16 | 9277 | 40.15 | 881 | 886 | 209.0 |
| C | 15 | 208 | 7616 | 32.2 | 881 | 886 | 209.0 |
| D | 1 | 52 | 2086630 | 9339.36 | 875 | 856 | 223.3 |
| D | 2 | 250 | 157061 | 699.43 | 875 | 856 | 223.3 |
| D | 7 | 38 | 121499 | 540.2 | 875 | 856 | 223.3 |
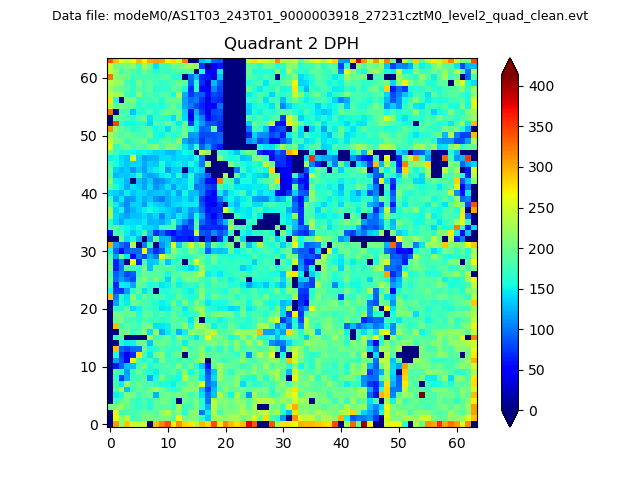
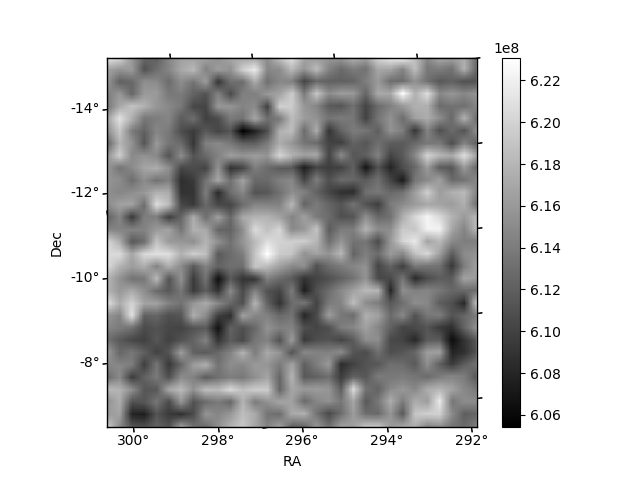
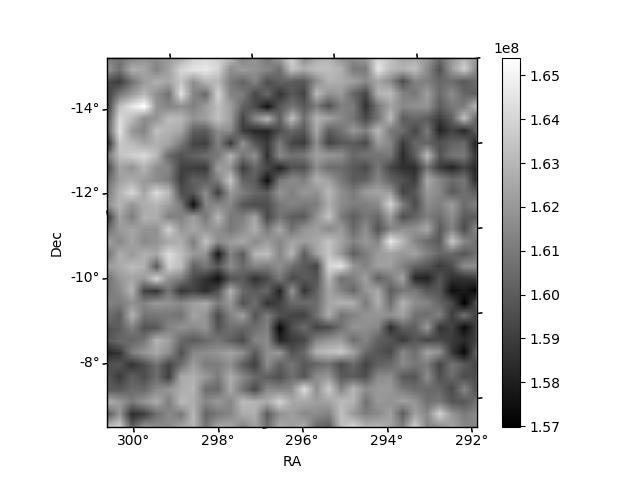
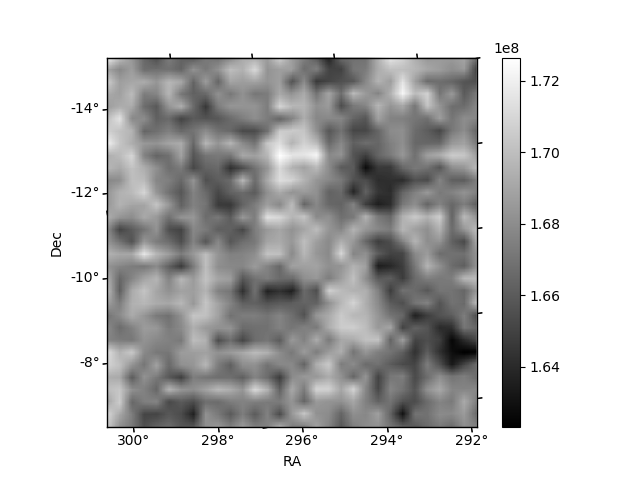
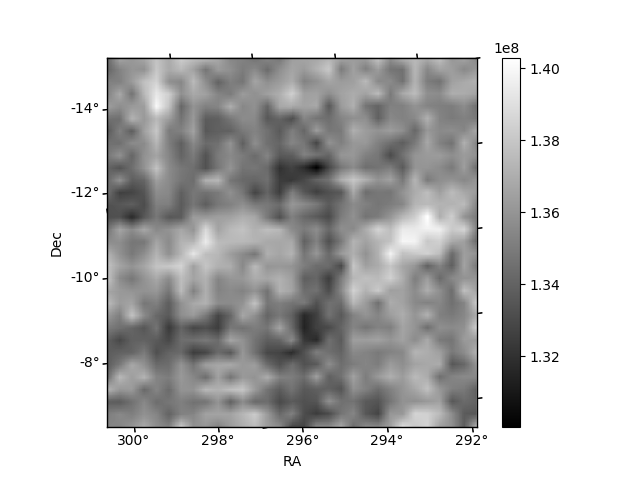
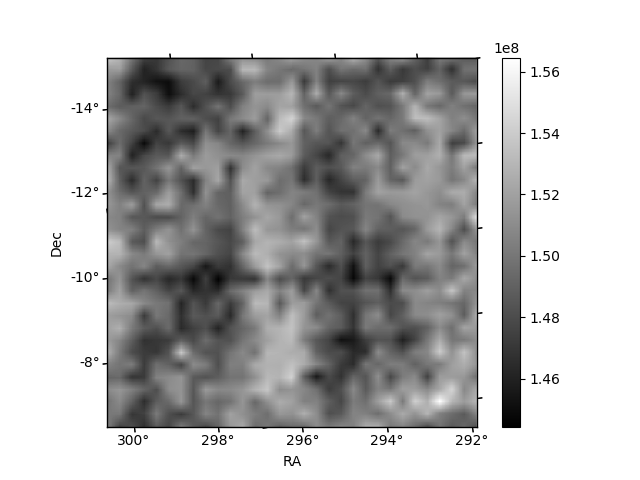
Histogram calculated using DETX and DETY for each event in the final _common_clean file
| Quadrant A | 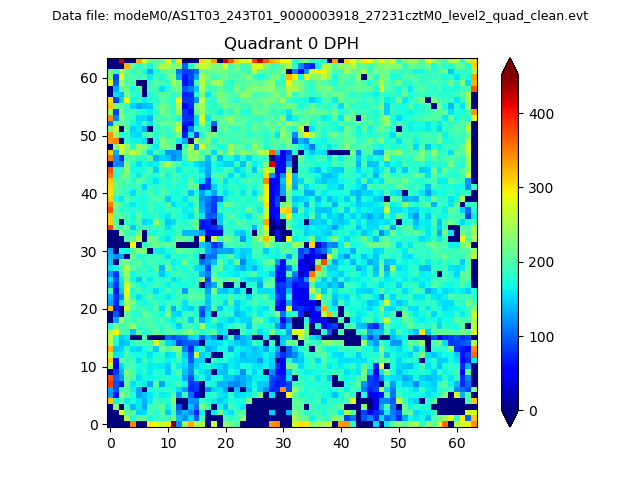 |
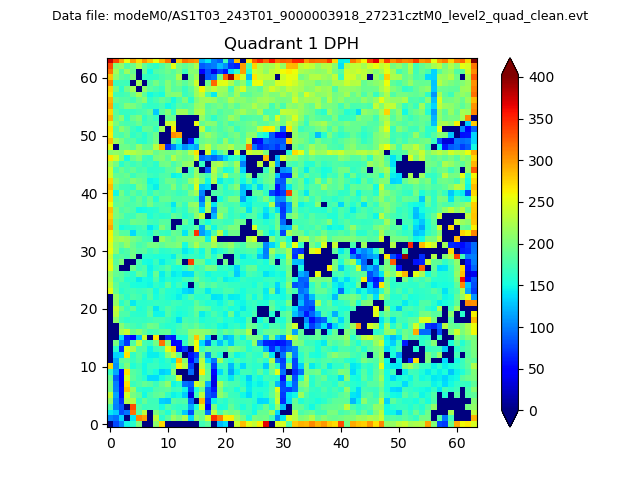 |
Quadrant B |
|---|---|---|---|
| Quadrant D | 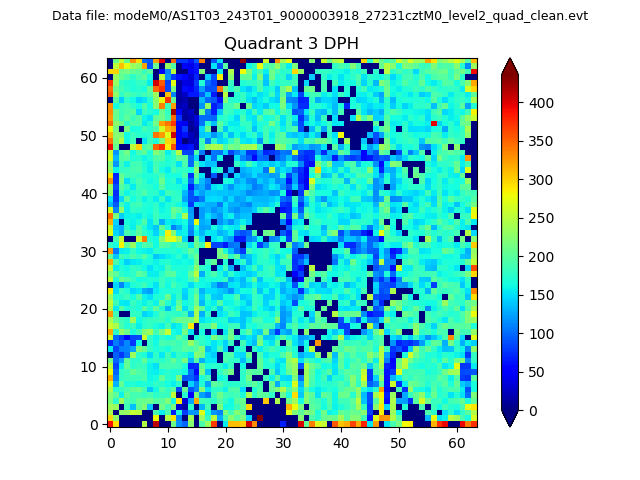 |
 |
Quadrant C |
| Plot type | Count rate plots | Images |
|---|---|---|
| Comparison with Poisson distribution Blue bars denote a histogram of data divided into 1 sec bins. Red curve is a Poisson curve with rate = median count rate of data. |
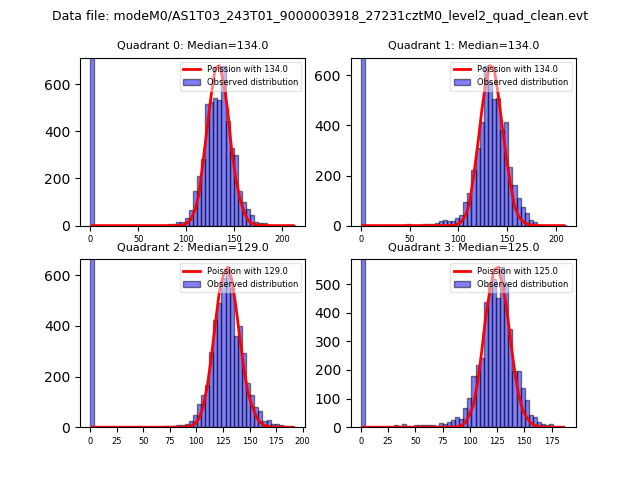 |
 |
| Quadrant-wise count rates Data is divided into 100 sec bins |
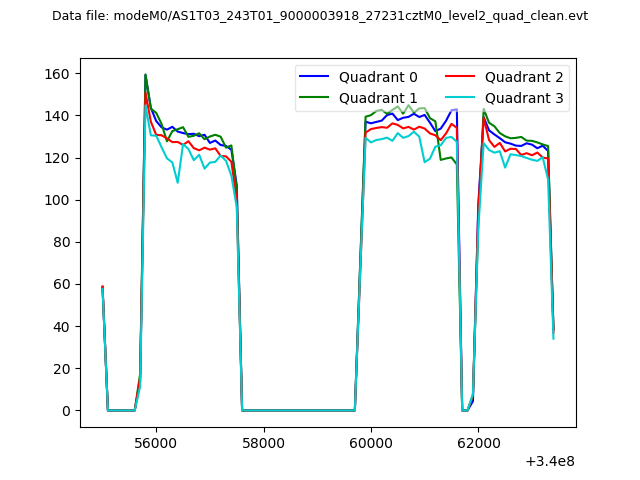 |
|
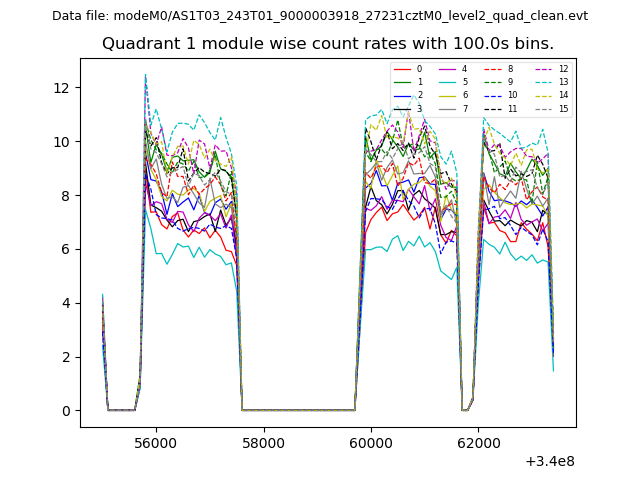
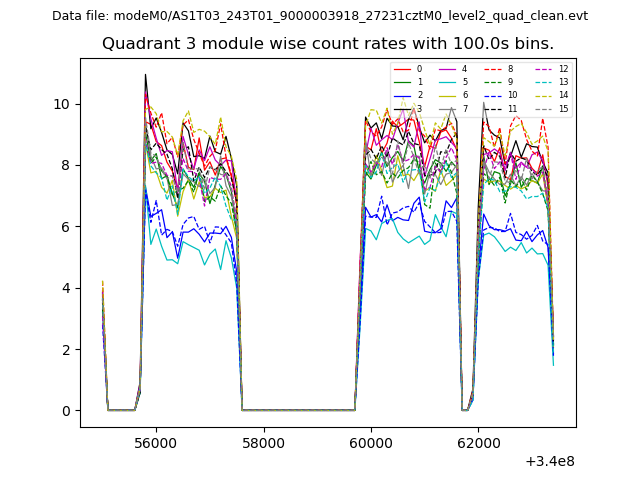
| Module-wise count rates for Quadrant A Data is divided into 100 sec bins |
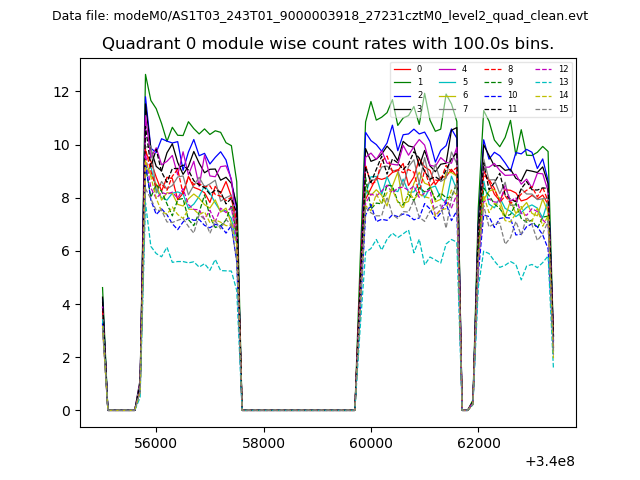 |
 |
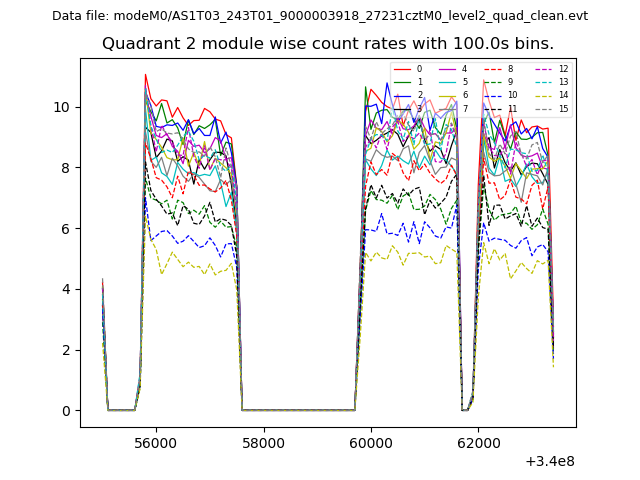
| Module-wise count rates for Quadrant B Data is divided into 100 sec bins |
 |
 |
| Module-wise count rates for Quadrant C Data is divided into 100 sec bins |
 |
 |
| Module-wise count rates for Quadrant D Data is divided into 100 sec bins |
 |
 |
| Parameter | Plot |
|---|---|
| CZT HV Monitor | 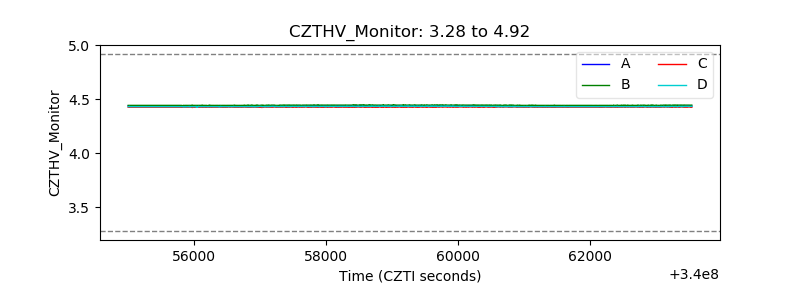 |
| D_VDD | 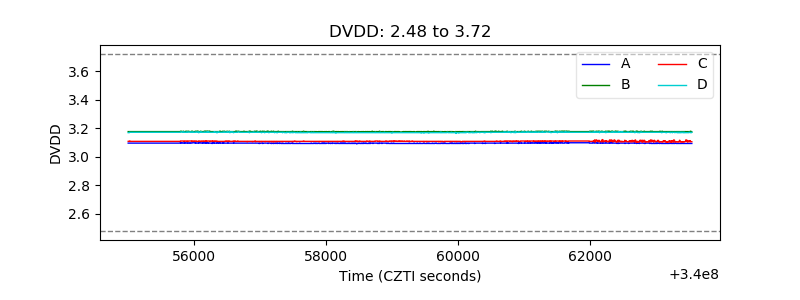 |
| Temperature 1 | 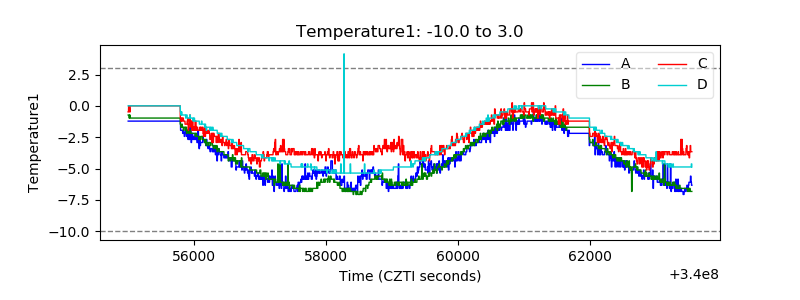 |
| Veto HV Monitor | 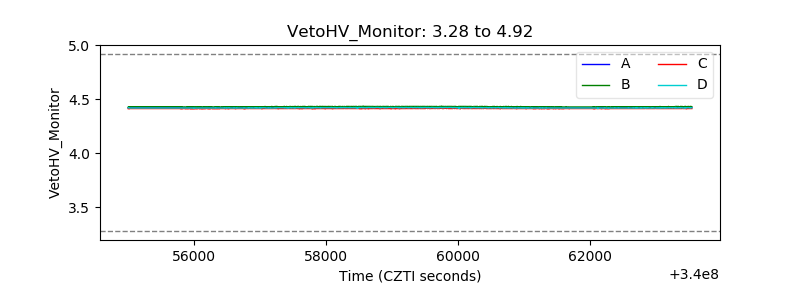 |
| Veto LLD | 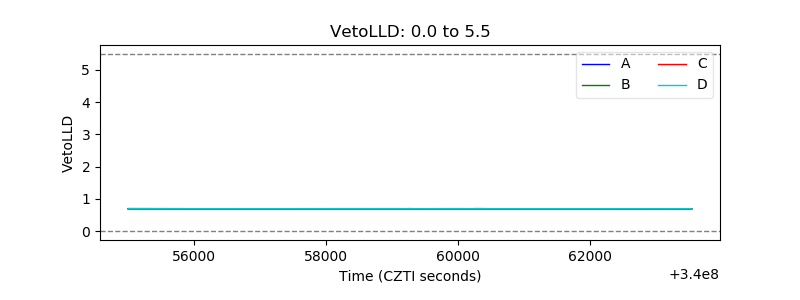 |
| Alpha Counter | 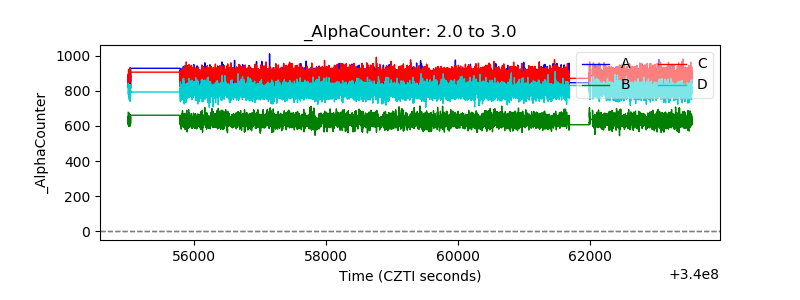 |
| _CPM_Rate | 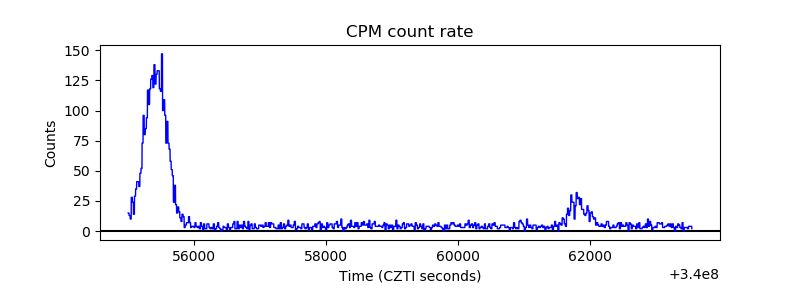 |
| CZT Counter | 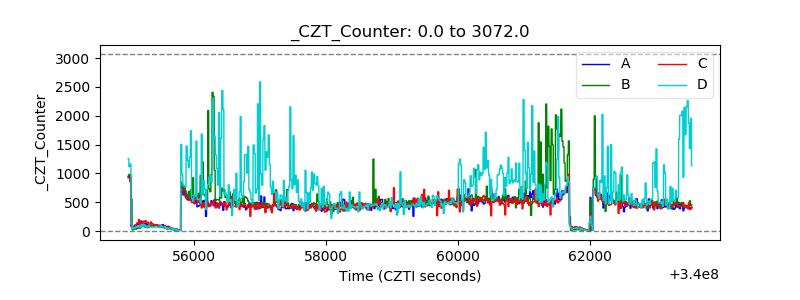 |
| +2.5 Volts monitor |  |
| +5 Volts monitor |  |
| _ROLL_ROT | 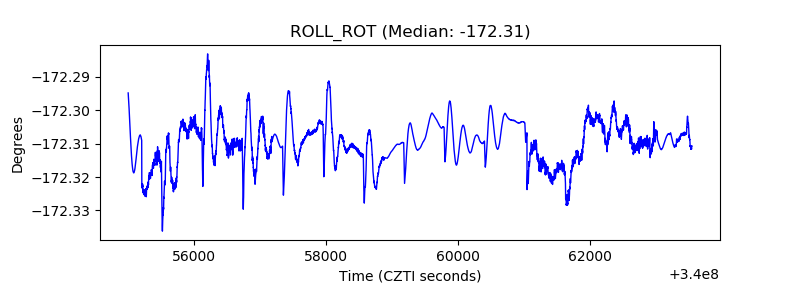 |
| _Roll_DEC | 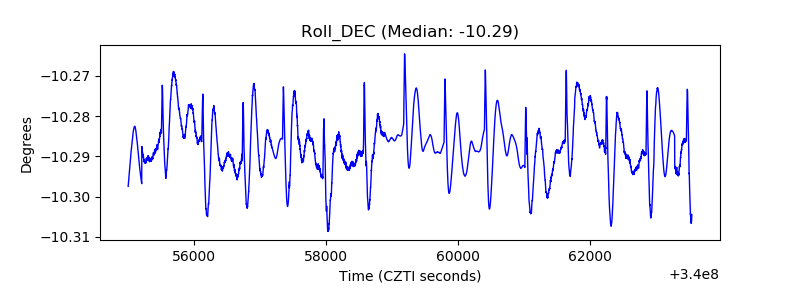 |
| _Roll_RA | 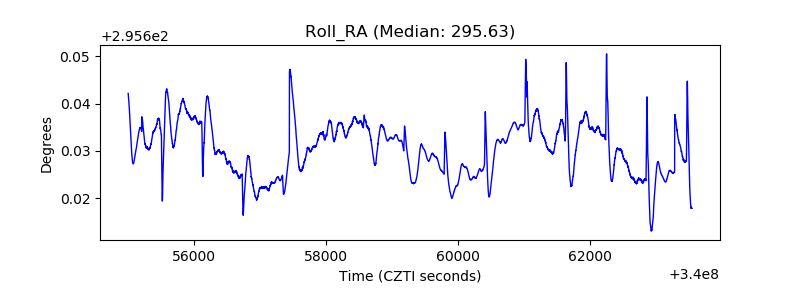 |
| Veto Counter | 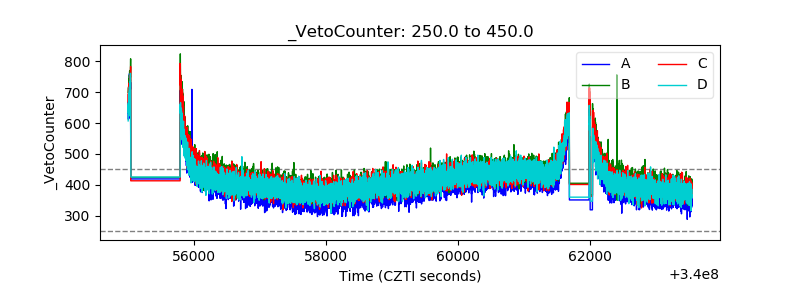 |