| Param | Original file | Final file |
|---|---|---|
| Filename | modeM0/AS1T03_243T01_9000003918_27232cztM0_level2.evt | modeM0/AS1T03_243T01_9000003918_27232cztM0_level2_quad_clean.evt |
| Size (bytes) | 601,845,120 | 98,804,160 |
| Size | 574.0 MB | 94.2 MB |
| Events in quadrant A | 3,784,897 | 630,299 |
| Events in quadrant B | 4,482,495 | 630,689 |
| Events in quadrant C | 3,655,383 | 612,094 |
| Events in quadrant D | 5,787,400 | 588,392 |
| Mode M9 | |||
|---|---|---|---|
| Quadrant | BADHDUFLAG | Total packets | Discarded packets |
| A | 0 | 4 | 0 |
| B | 0 | 5 | 0 |
| C | 0 | 5 | 0 |
| D | 0 | 5 | 0 |
| Mode M0 | |||
|---|---|---|---|
| Quadrant | BADHDUFLAG | Total packets | Discarded packets |
| A | 0 | 16236 | 0 |
| B | 0 | 18117 | 0 |
| C | 0 | 15733 | 0 |
| D | 0 | 22347 | 0 |
| Quadrant | Total seconds | Saturated seconds | Saturation percentage |
|---|---|---|---|
| A | 7629 | 92 | 1.205925% |
| B | 7628 | 338 | 4.431044% |
| C | 7628 | 101 | 1.324069% |
| D | 7628 | 382 | 5.007866% |
Noise dominated data is calculated using 1-second bins in cleaned event files. If a bin has >2000 counts, and if more than 50% of those come from <1% of pixels, then it is considered to be noise-dominated and hence unusable.
| Quadrant | # 1 sec bins | Bins with >0 counts | Bins with >2000 counts | High rate bins dominated by noise | Noise dominated (total time) | Noise dominated (detector-on time) | Marked lightcurve |
|---|---|---|---|---|---|---|---|
| A | 7854 | 7631 | 24 | 24 | 0.31% | 0.31% | 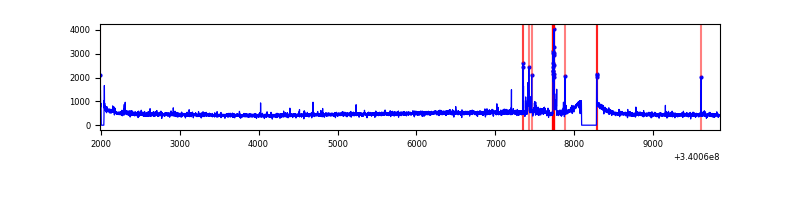 |
| B | 7853 | 7630 | 119 | 119 | 1.52% | 1.56% | 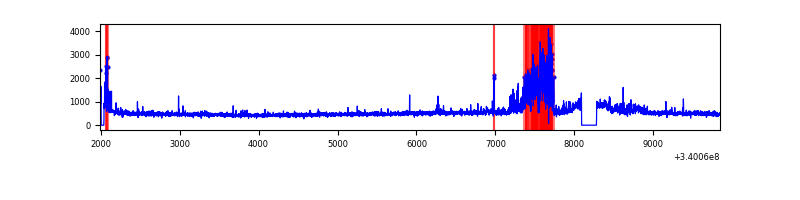 |
| C | 7853 | 7630 | 1 | 1 | 0.01% | 0.01% | 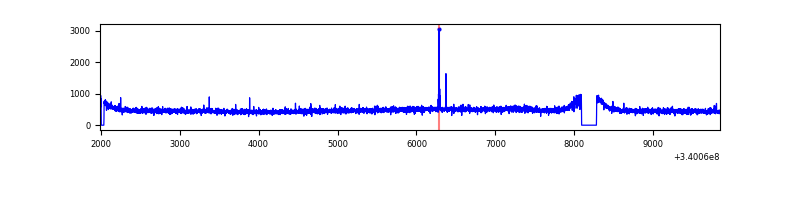 |
| D | 7853 | 7630 | 285 | 285 | 3.63% | 3.74% | 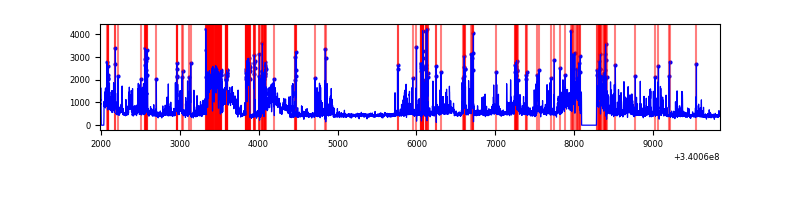 |
Top three noisy pixels from each quadrant. If the there are fewer than three noisy pixels in the level2.evt file, extra rows are filled as -1
| Pixel properties | Quadrant properties | ||||||
|---|---|---|---|---|---|---|---|
| Quadrant | DetID | PixID | Counts | Sigma | Mean | Median | Sigma |
| A | 12 | 96 | 137348 | 722.0 | 932 | 912 | 189.0 |
| A | 0 | 13 | 22555 | 114.53 | 932 | 912 | 189.0 |
| A | 8 | 192 | 18147 | 91.2 | 932 | 912 | 189.0 |
| B | 15 | 33 | 552177 | 3061.51 | 923 | 899 | 180.1 |
| B | 3 | 64 | 249728 | 1381.87 | 923 | 899 | 180.1 |
| B | 5 | 172 | 27179 | 145.95 | 923 | 899 | 180.1 |
| C | 14 | 238 | 140002 | 661.0 | 892 | 898 | 210.4 |
| C | 15 | 208 | 17006 | 76.54 | 892 | 898 | 210.4 |
| C | 8 | 128 | 13635 | 60.52 | 892 | 898 | 210.4 |
| D | 1 | 52 | 1923339 | 8510.86 | 882 | 861 | 225.9 |
| D | 2 | 250 | 199634 | 879.97 | 882 | 861 | 225.9 |
| D | 7 | 38 | 74506 | 326.03 | 882 | 861 | 225.9 |
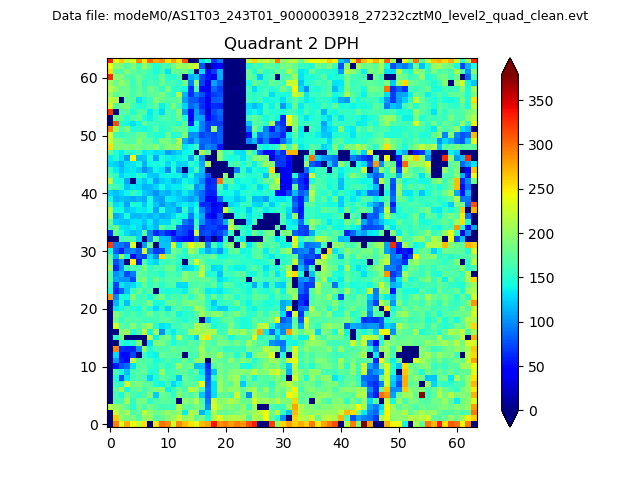
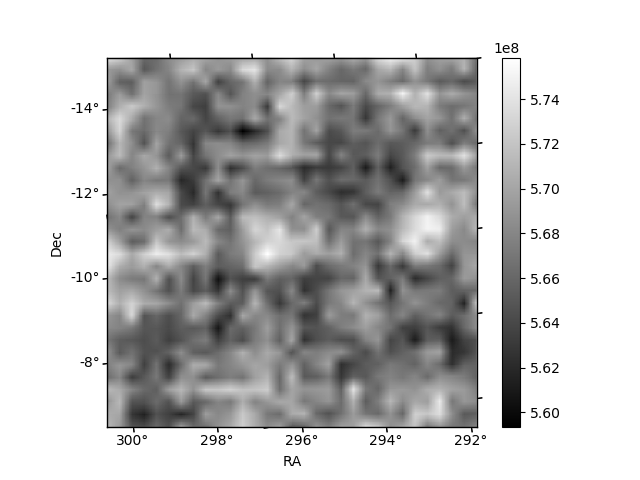
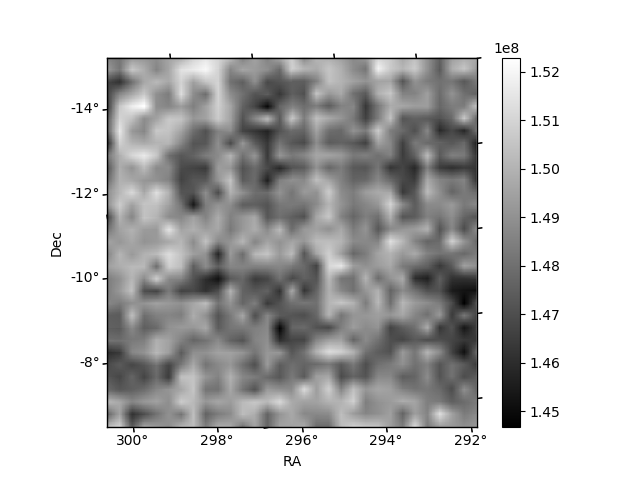
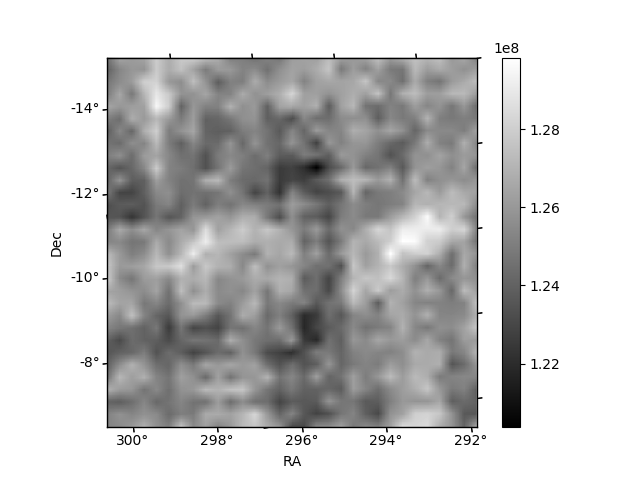
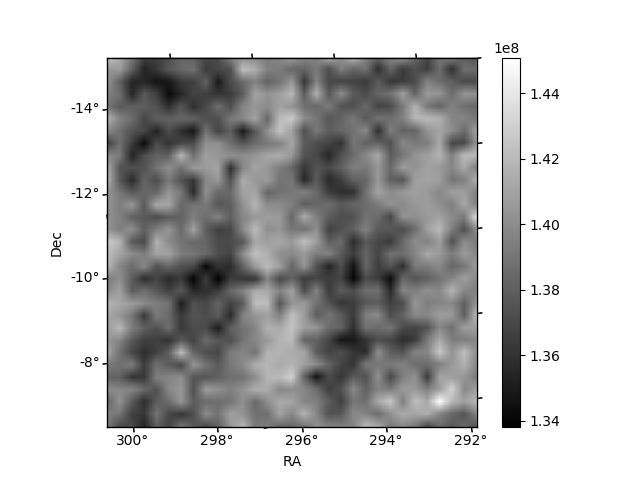
Histogram calculated using DETX and DETY for each event in the final _common_clean file
| Quadrant A | 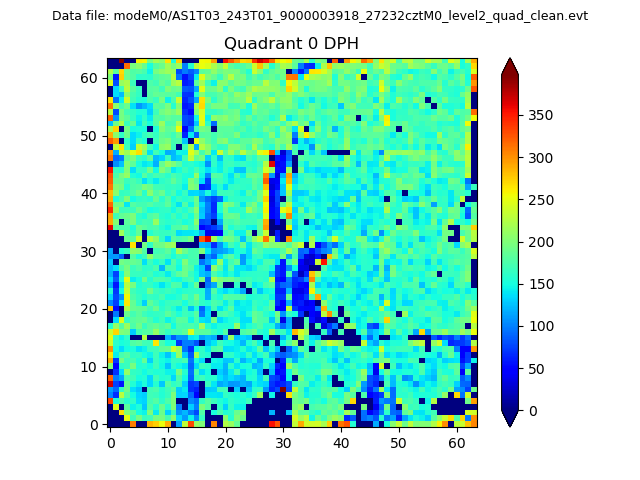 |
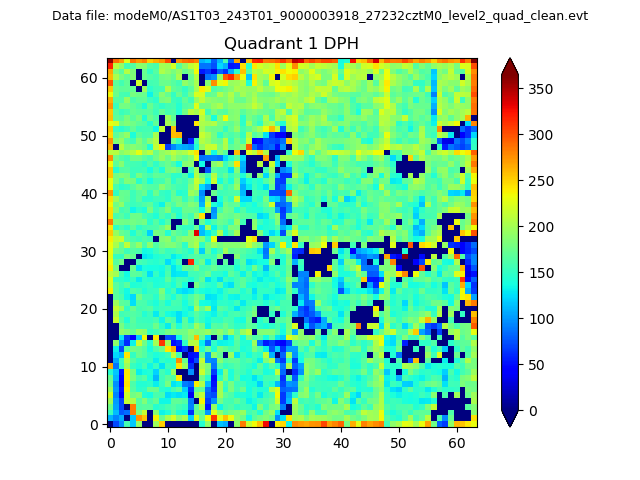 |
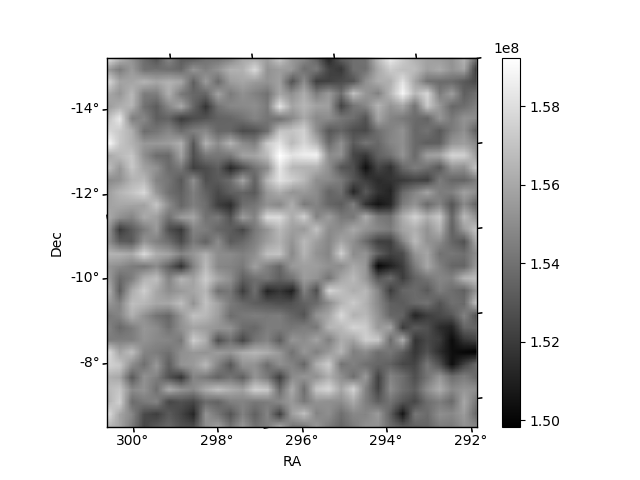
Quadrant B |
|---|---|---|---|
| Quadrant D | 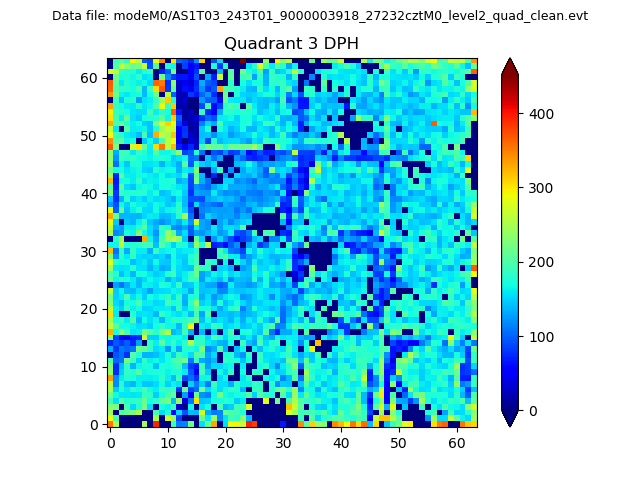 |
 |
Quadrant C |
| Plot type | Count rate plots | Images |
|---|---|---|
| Comparison with Poisson distribution Blue bars denote a histogram of data divided into 1 sec bins. Red curve is a Poisson curve with rate = median count rate of data. |
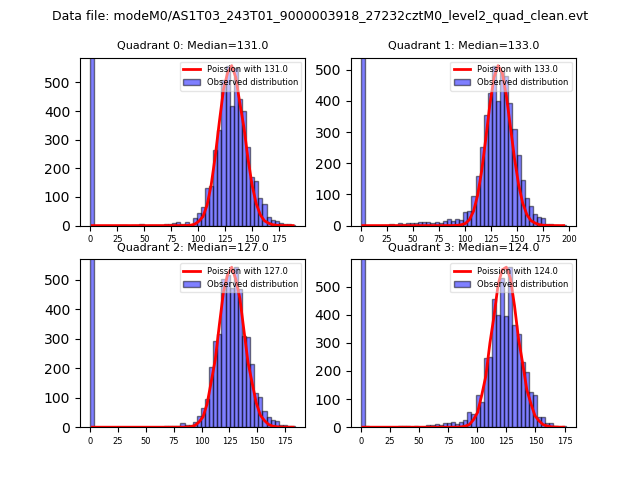 |
 |
| Quadrant-wise count rates Data is divided into 100 sec bins |
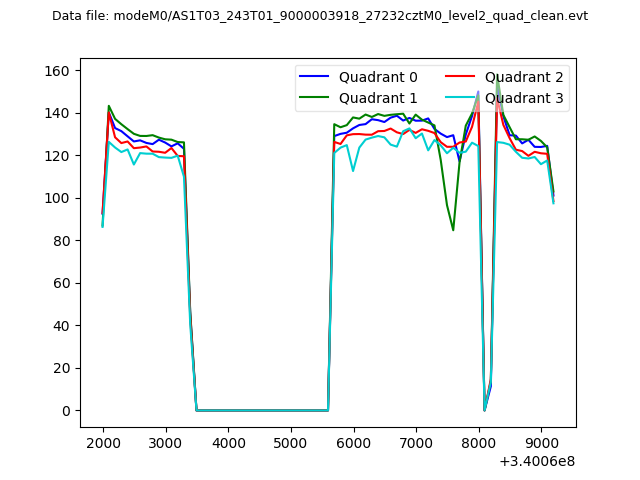 |
|
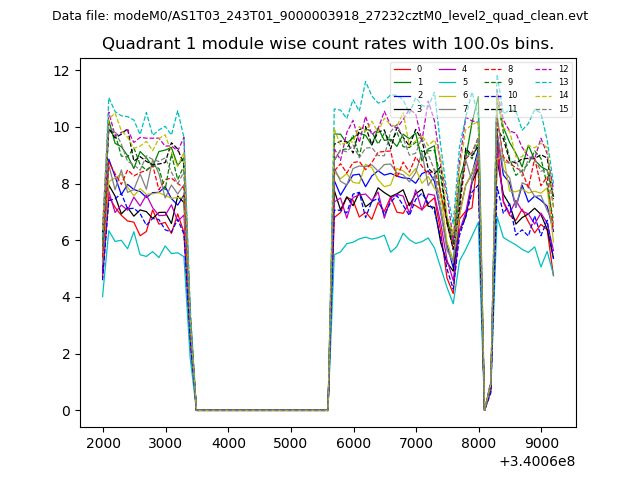
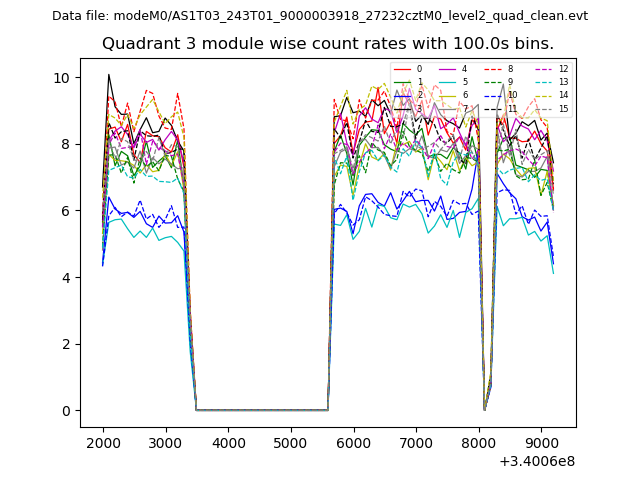
| Module-wise count rates for Quadrant A Data is divided into 100 sec bins |
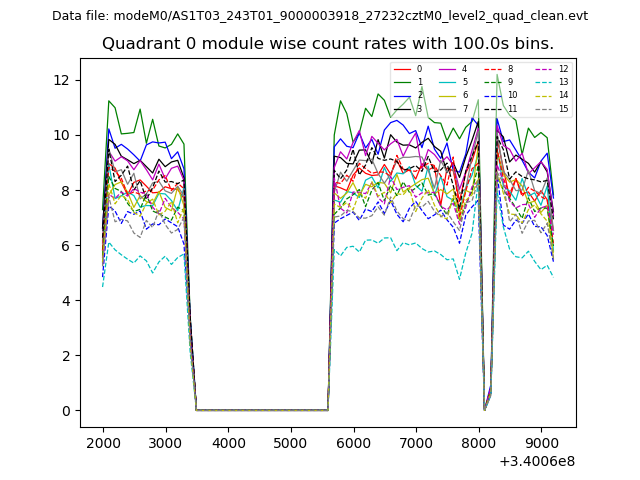 |
 |
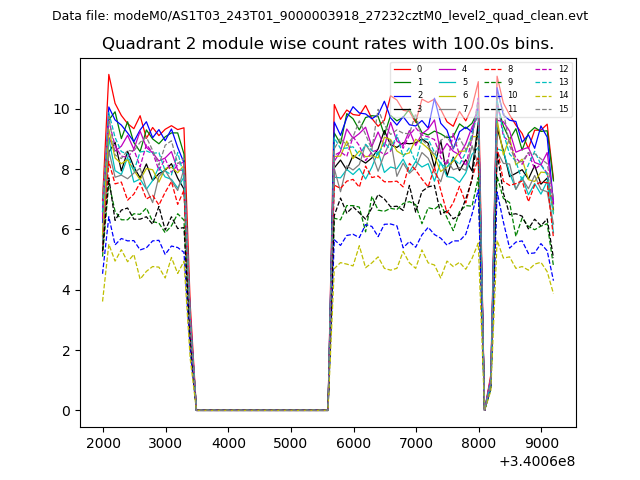
| Module-wise count rates for Quadrant B Data is divided into 100 sec bins |
 |
 |
| Module-wise count rates for Quadrant C Data is divided into 100 sec bins |
 |
 |
| Module-wise count rates for Quadrant D Data is divided into 100 sec bins |
 |
 |
| Parameter | Plot |
|---|---|
| CZT HV Monitor | 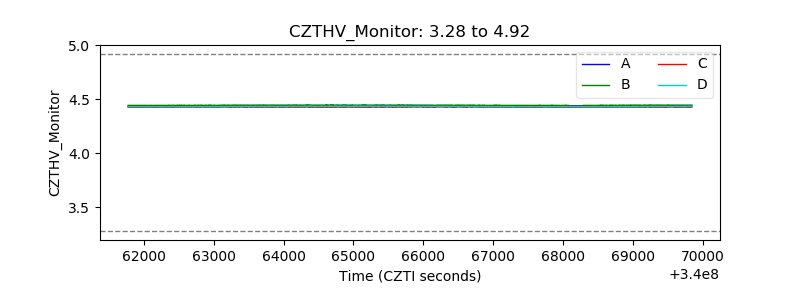 |
| D_VDD | 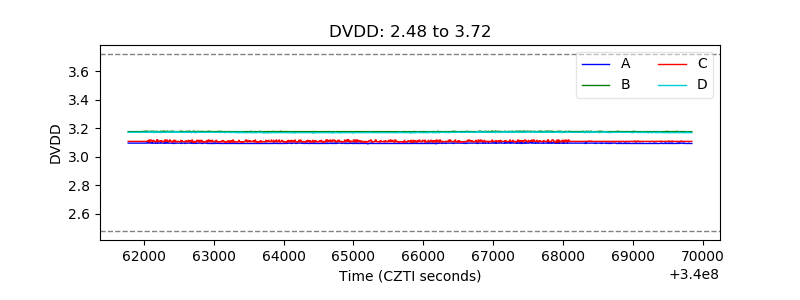 |
| Temperature 1 |  |
| Veto HV Monitor | 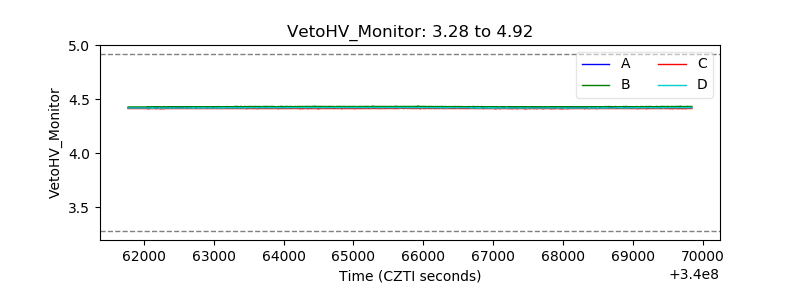 |
| Veto LLD | 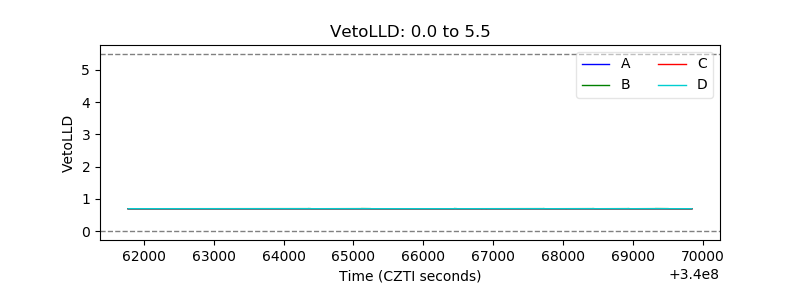 |
| Alpha Counter | 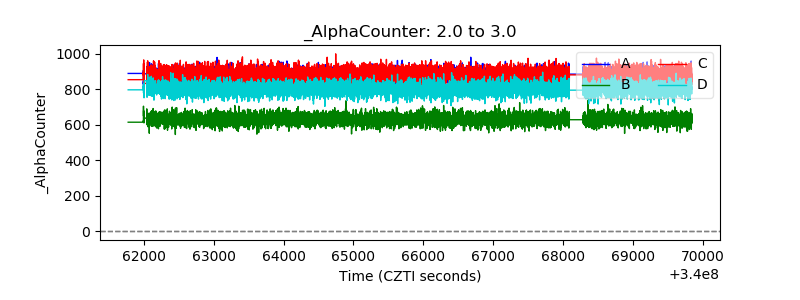 |
| _CPM_Rate | 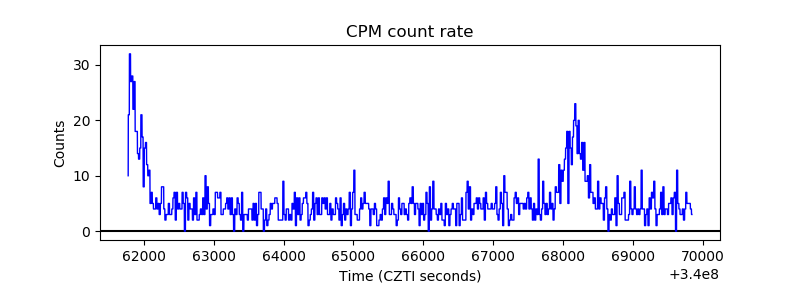 |
| CZT Counter | 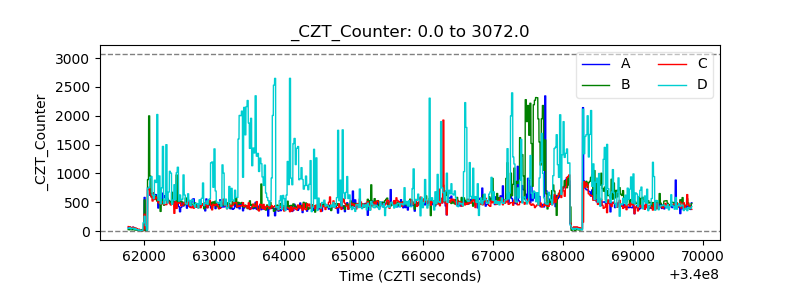 |
| +2.5 Volts monitor |  |
| +5 Volts monitor | 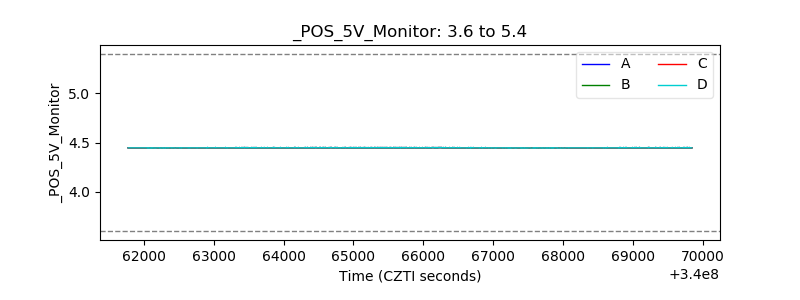 |
| _ROLL_ROT | 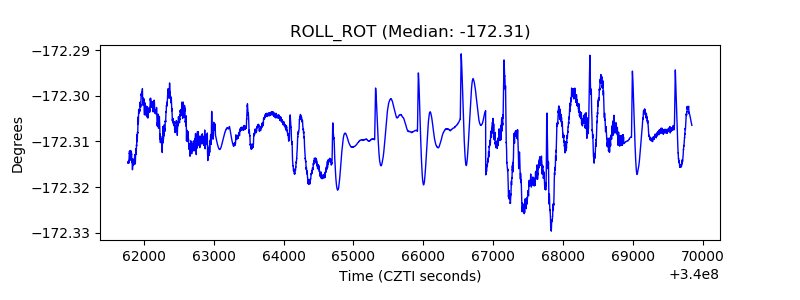 |
| _Roll_DEC | 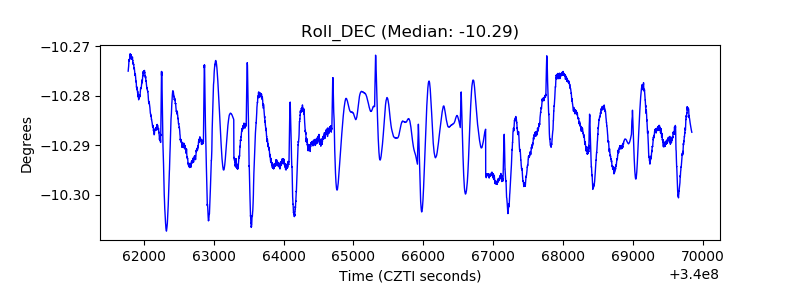 |
| _Roll_RA | 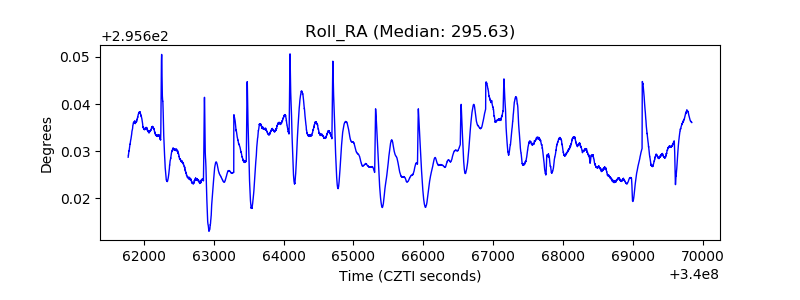 |
| Veto Counter | 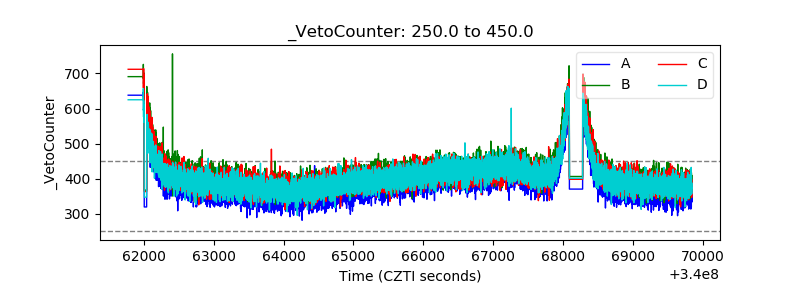 |