| Param | Original file | Final file |
|---|---|---|
| Filename | modeM0/AS1T03_243T01_9000003918_27233cztM0_level2.evt | modeM0/AS1T03_243T01_9000003918_27233cztM0_level2_quad_clean.evt |
| Size (bytes) | 681,716,160 | 104,353,920 |
| Size | 650.1 MB | 99.5 MB |
| Events in quadrant A | 4,312,261 | 661,794 |
| Events in quadrant B | 5,819,793 | 661,373 |
| Events in quadrant C | 4,119,191 | 643,016 |
| Events in quadrant D | 5,822,420 | 606,936 |
| Mode M9 | |||
|---|---|---|---|
| Quadrant | BADHDUFLAG | Total packets | Discarded packets |
| A | 0 | 5 | 0 |
| B | 0 | 5 | 0 |
| C | 0 | 5 | 0 |
| D | 0 | 5 | 0 |
| Mode M0 | |||
|---|---|---|---|
| Quadrant | BADHDUFLAG | Total packets | Discarded packets |
| A | 0 | 18312 | 0 |
| B | 0 | 22679 | 0 |
| C | 0 | 17643 | 0 |
| D | 0 | 23181 | 0 |
| Quadrant | Total seconds | Saturated seconds | Saturation percentage |
|---|---|---|---|
| A | 8438 | 136 | 1.611756% |
| B | 8444 | 443 | 5.246329% |
| C | 8444 | 148 | 1.752724% |
| D | 8443 | 559 | 6.620869% |
Noise dominated data is calculated using 1-second bins in cleaned event files. If a bin has >2000 counts, and if more than 50% of those come from <1% of pixels, then it is considered to be noise-dominated and hence unusable.
| Quadrant | # 1 sec bins | Bins with >0 counts | Bins with >2000 counts | High rate bins dominated by noise | Noise dominated (total time) | Noise dominated (detector-on time) | Marked lightcurve |
|---|---|---|---|---|---|---|---|
| A | 9015 | 8445 | 28 | 28 | 0.31% | 0.33% | 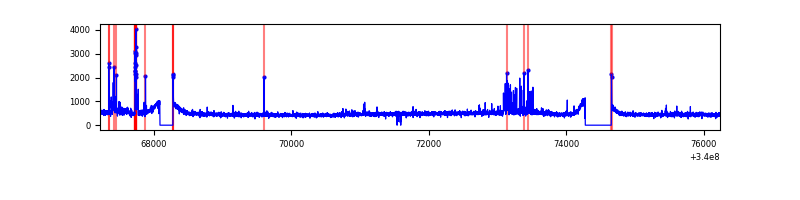 |
| B | 9016 | 8448 | 147 | 147 | 1.63% | 1.74% | 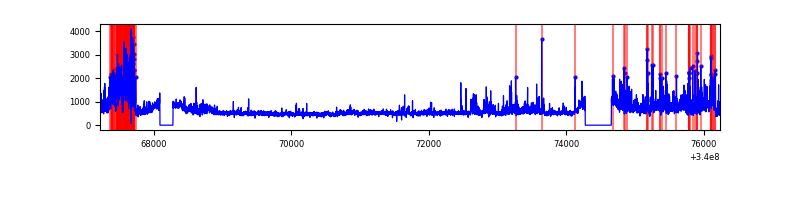 |
| C | 9016 | 8448 | 8 | 8 | 0.09% | 0.09% | 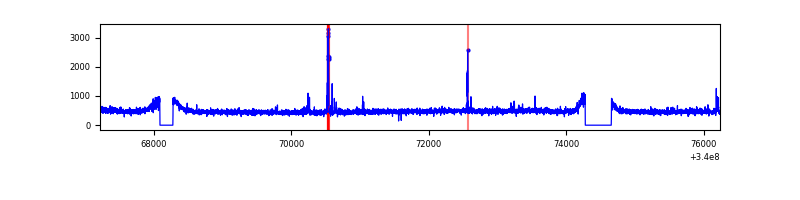 |
| D | 9016 | 8448 | 345 | 345 | 3.83% | 4.08% | 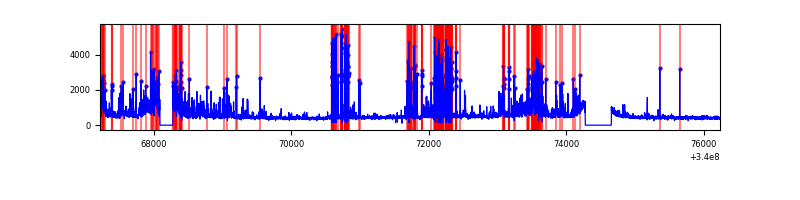 |
Top three noisy pixels from each quadrant. If the there are fewer than three noisy pixels in the level2.evt file, extra rows are filled as -1
| Pixel properties | Quadrant properties | ||||||
|---|---|---|---|---|---|---|---|
| Quadrant | DetID | PixID | Counts | Sigma | Mean | Median | Sigma |
| A | 12 | 96 | 129953 | 612.58 | 1041 | 1021 | 210.5 |
| A | 14 | 235 | 127372 | 600.32 | 1041 | 1021 | 210.5 |
| A | 8 | 192 | 17130 | 76.54 | 1041 | 1021 | 210.5 |
| B | 3 | 64 | 1169547 | 5907.91 | 1027 | 1003 | 197.8 |
| B | 15 | 33 | 570526 | 2879.39 | 1027 | 1003 | 197.8 |
| B | 4 | 171 | 31498 | 154.18 | 1027 | 1003 | 197.8 |
| C | 14 | 238 | 157996 | 662.58 | 995 | 999 | 236.9 |
| C | 15 | 208 | 78364 | 326.5 | 995 | 999 | 236.9 |
| C | 13 | 61 | 6921 | 24.99 | 995 | 999 | 236.9 |
| D | 1 | 52 | 1409890 | 5849.88 | 972 | 949 | 240.8 |
| D | 5 | 222 | 321970 | 1332.87 | 972 | 949 | 240.8 |
| D | 2 | 250 | 193145 | 797.99 | 972 | 949 | 240.8 |
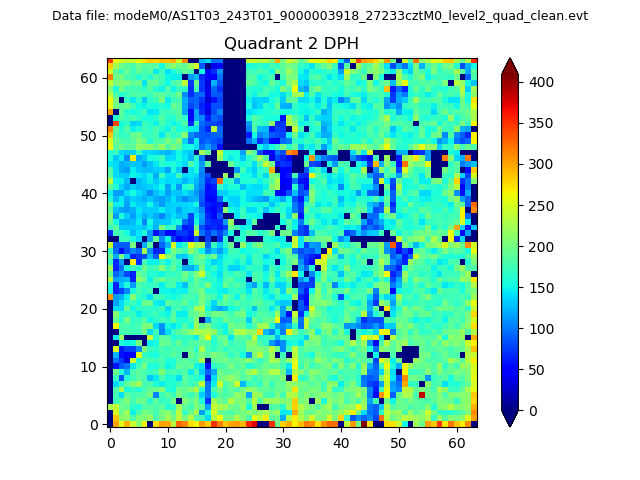
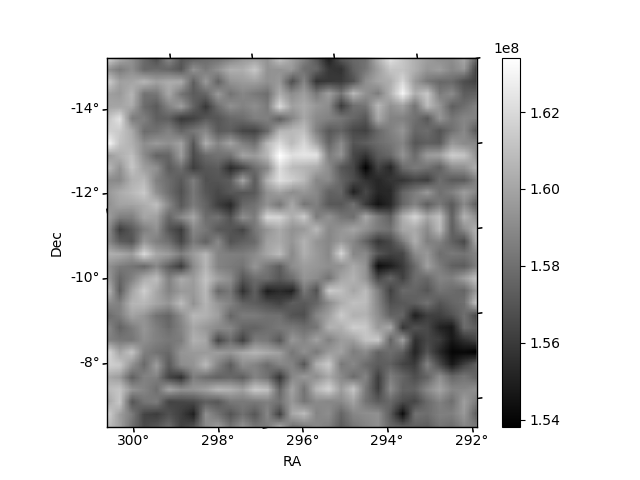
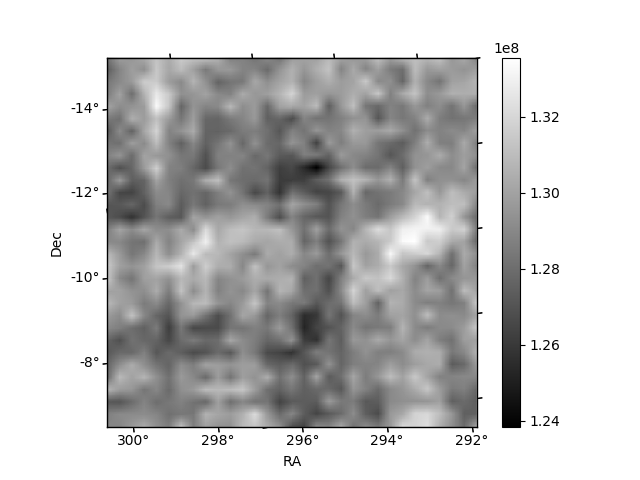
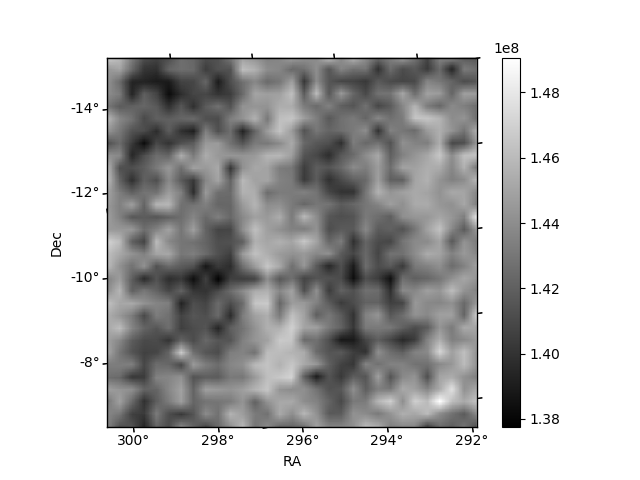
Histogram calculated using DETX and DETY for each event in the final _common_clean file
| Quadrant A | 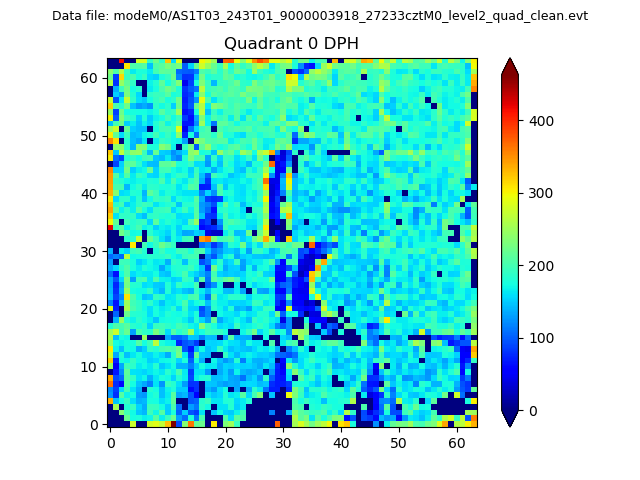 |
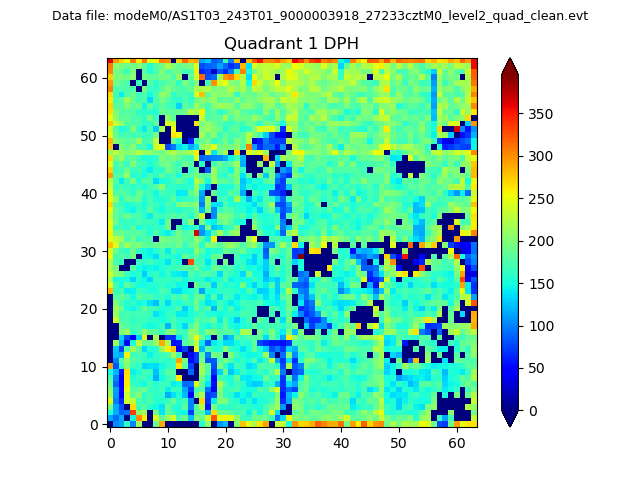 |
Quadrant B |
|---|---|---|---|
| Quadrant D | 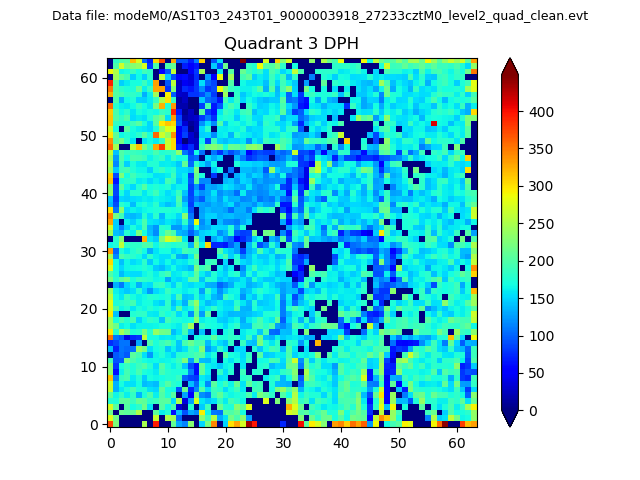 |
 |
Quadrant C |
| Plot type | Count rate plots | Images |
|---|---|---|
| Comparison with Poisson distribution Blue bars denote a histogram of data divided into 1 sec bins. Red curve is a Poisson curve with rate = median count rate of data. |
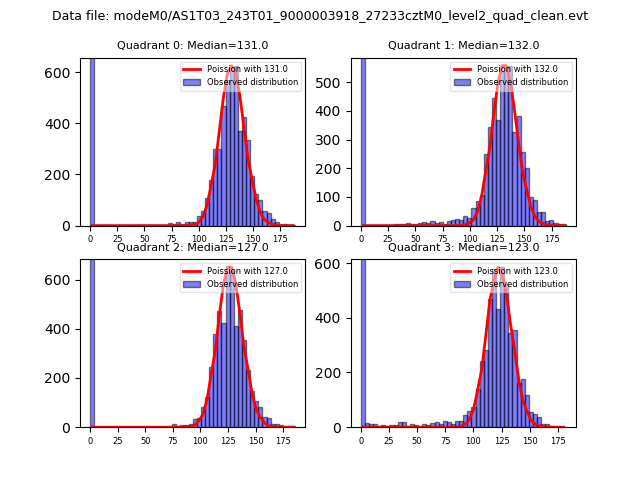 |
 |
| Quadrant-wise count rates Data is divided into 100 sec bins |
 |
|
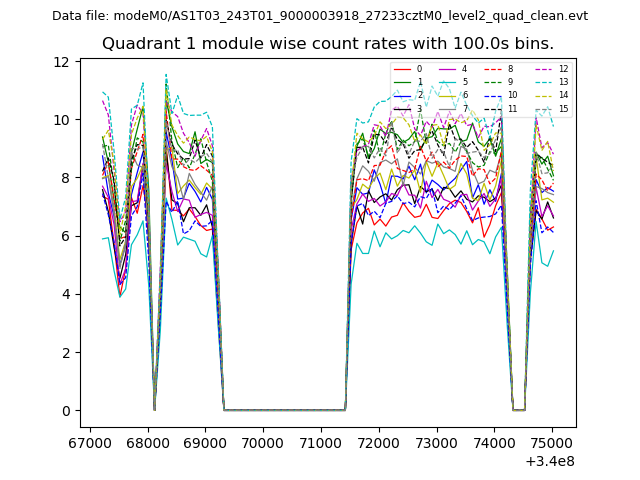
| Module-wise count rates for Quadrant A Data is divided into 100 sec bins |
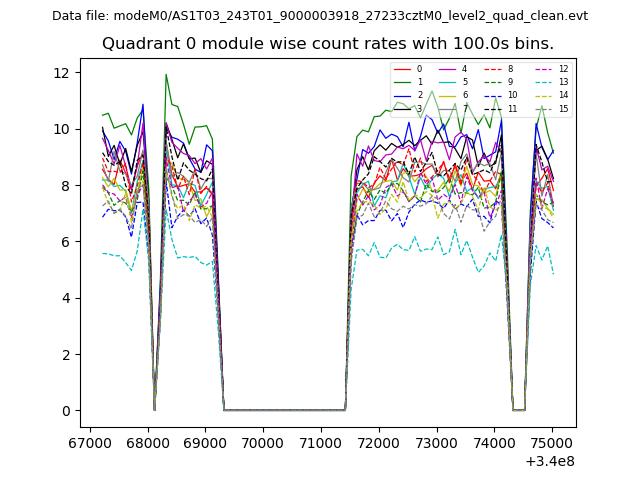 |
 |
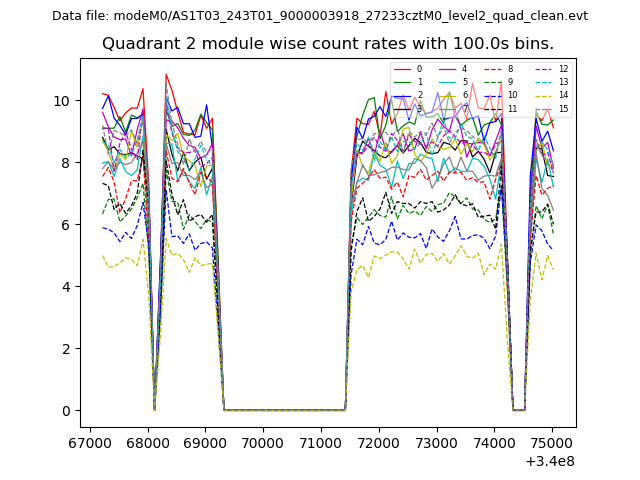
| Module-wise count rates for Quadrant B Data is divided into 100 sec bins |
 |
 |
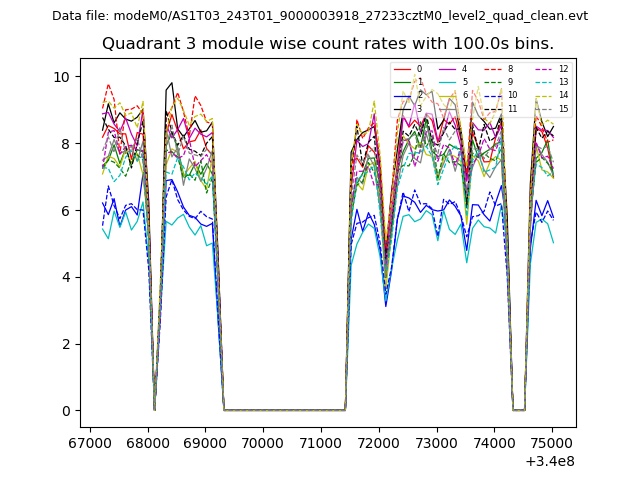
| Module-wise count rates for Quadrant C Data is divided into 100 sec bins |
 |
 |
| Module-wise count rates for Quadrant D Data is divided into 100 sec bins |
 |
 |
| Parameter | Plot |
|---|---|
| CZT HV Monitor | 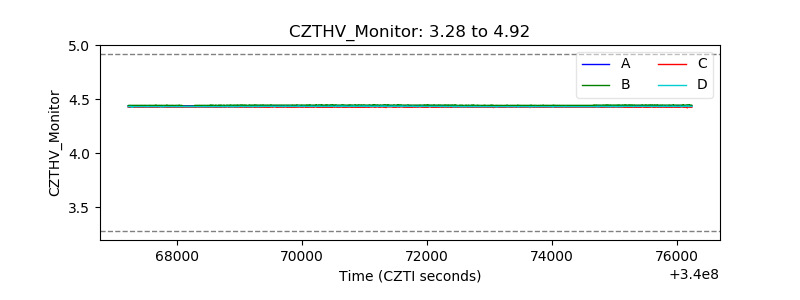 |
| D_VDD | 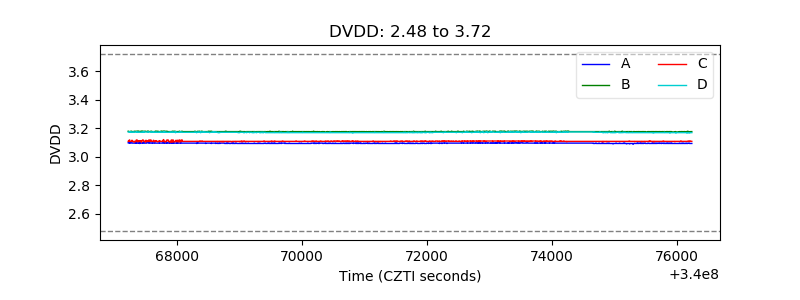 |
| Temperature 1 | 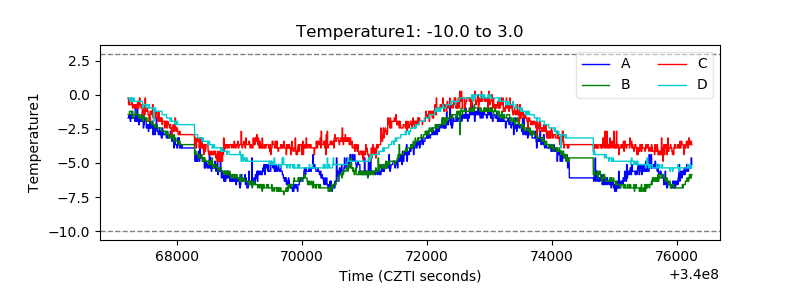 |
| Veto HV Monitor |  |
| Veto LLD | 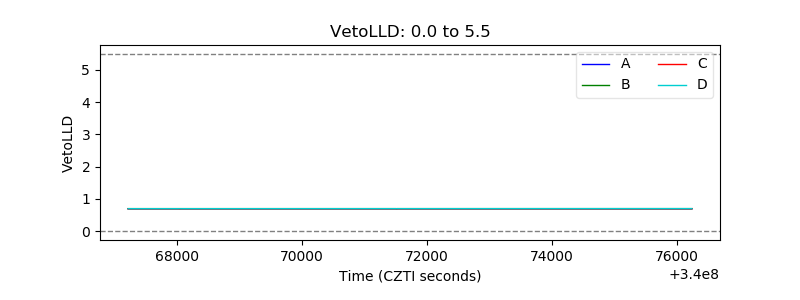 |
| Alpha Counter | 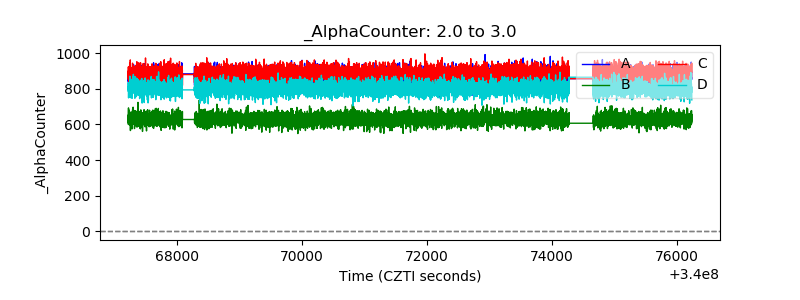 |
| _CPM_Rate |  |
| CZT Counter | 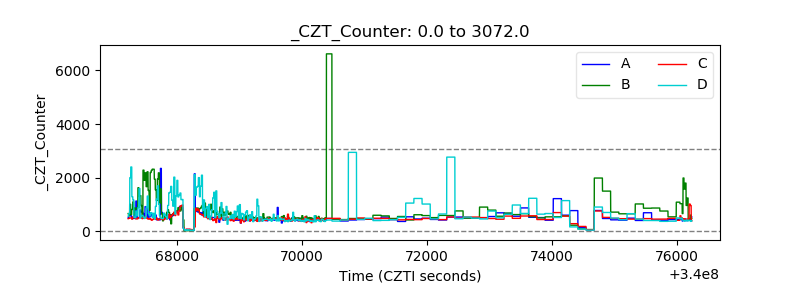 |
| +2.5 Volts monitor |  |
| +5 Volts monitor |  |
| _ROLL_ROT | 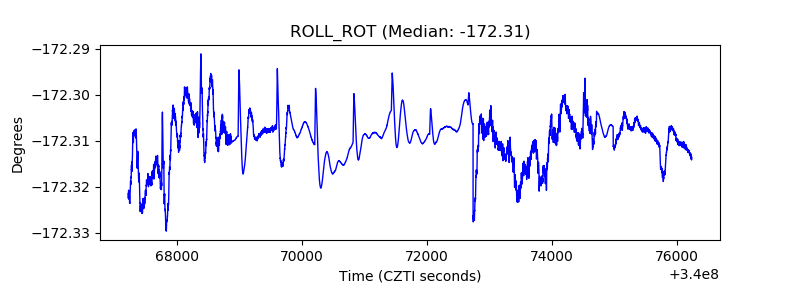 |
| _Roll_DEC | 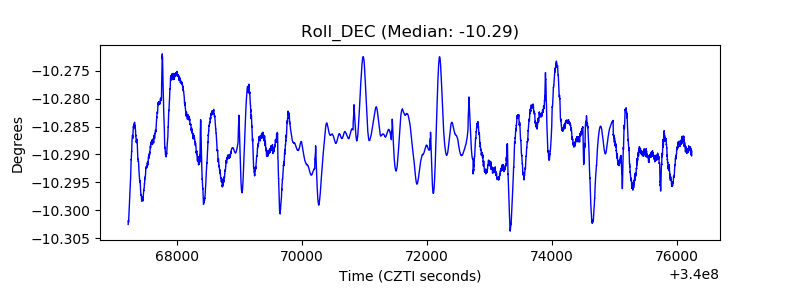 |
| _Roll_RA | 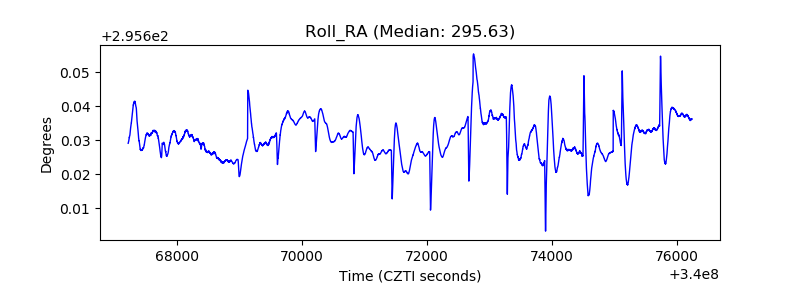 |
| Veto Counter | 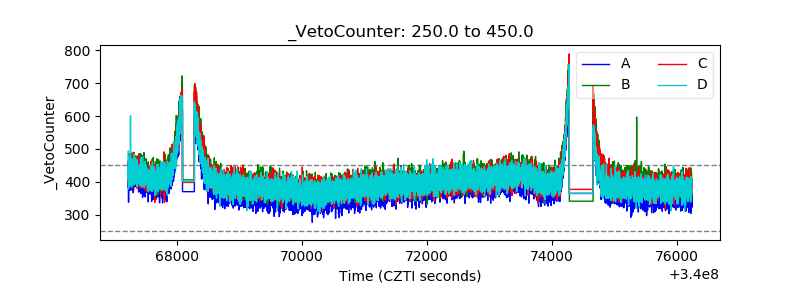 |