| Param | Original file | Final file |
|---|---|---|
| Filename | modeM0/AS1T03_243T01_9000003918_27236cztM0_level2.evt | modeM0/AS1T03_243T01_9000003918_27236cztM0_level2_quad_clean.evt |
| Size (bytes) | 499,455,360 | 77,137,920 |
| Size | 476.3 MB | 73.6 MB |
| Events in quadrant A | 3,399,383 | 473,402 |
| Events in quadrant B | 3,998,509 | 470,367 |
| Events in quadrant C | 3,400,734 | 460,493 |
| Events in quadrant D | 3,858,905 | 450,677 |
| Mode M9 | |||
|---|---|---|---|
| Quadrant | BADHDUFLAG | Total packets | Discarded packets |
| A | 0 | 16 | 0 |
| B | 0 | 16 | 0 |
| C | 0 | 16 | 0 |
| D | 0 | 16 | 0 |
| Mode M0 | |||
|---|---|---|---|
| Quadrant | BADHDUFLAG | Total packets | Discarded packets |
| A | 0 | 14329 | 0 |
| B | 0 | 16041 | 0 |
| C | 0 | 14340 | 0 |
| D | 0 | 15865 | 0 |
| Quadrant | Total seconds | Saturated seconds | Saturation percentage |
|---|---|---|---|
| A | 6899 | 95 | 1.377011% |
| B | 6898 | 245 | 3.551754% |
| C | 6899 | 133 | 1.927816% |
| D | 6899 | 133 | 1.927816% |
Noise dominated data is calculated using 1-second bins in cleaned event files. If a bin has >2000 counts, and if more than 50% of those come from <1% of pixels, then it is considered to be noise-dominated and hence unusable.
| Quadrant | # 1 sec bins | Bins with >0 counts | Bins with >2000 counts | High rate bins dominated by noise | Noise dominated (total time) | Noise dominated (detector-on time) | Marked lightcurve |
|---|---|---|---|---|---|---|---|
| A | 8499 | 6901 | 0 | 0 | 0.00% | 0.00% |  |
| B | 8498 | 6900 | 99 | 99 | 1.16% | 1.43% |  |
| C | 8499 | 6901 | 0 | 0 | 0.00% | 0.00% |  |
| D | 8499 | 6901 | 33 | 33 | 0.39% | 0.48% |  |
Top three noisy pixels from each quadrant. If the there are fewer than three noisy pixels in the level2.evt file, extra rows are filled as -1
| Pixel properties | Quadrant properties | ||||||
|---|---|---|---|---|---|---|---|
| Quadrant | DetID | PixID | Counts | Sigma | Mean | Median | Sigma |
| A | 0 | 13 | 22753 | 125.49 | 866 | 846 | 174.6 |
| A | 14 | 235 | 12103 | 64.48 | 866 | 846 | 174.6 |
| A | 12 | 96 | 11828 | 62.91 | 866 | 846 | 174.6 |
| B | 3 | 64 | 585858 | 3529.53 | 855 | 835 | 165.8 |
| B | 0 | 245 | 37499 | 221.2 | 855 | 835 | 165.8 |
| B | 12 | 111 | 20449 | 118.33 | 855 | 835 | 165.8 |
| C | 14 | 238 | 133995 | 687.33 | 827 | 832 | 193.7 |
| C | 15 | 208 | 25649 | 128.09 | 827 | 832 | 193.7 |
| C | 1 | 16 | 20746 | 102.79 | 827 | 832 | 193.7 |
| D | 1 | 52 | 554294 | 2758.37 | 832 | 812 | 200.7 |
| D | 2 | 250 | 48472 | 237.52 | 832 | 812 | 200.7 |
| D | 13 | 168 | 31265 | 151.77 | 832 | 812 | 200.7 |
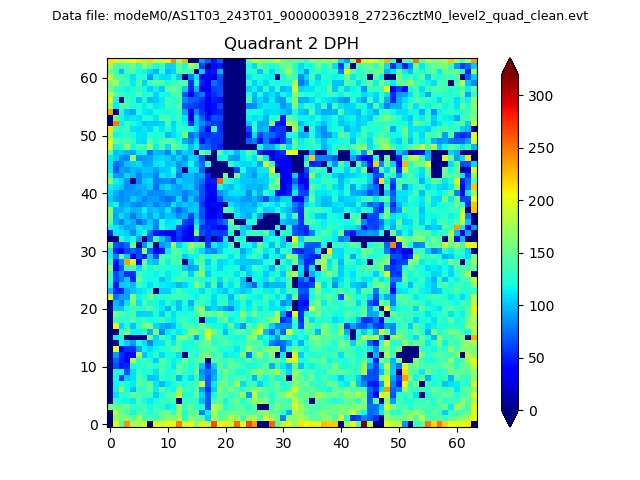
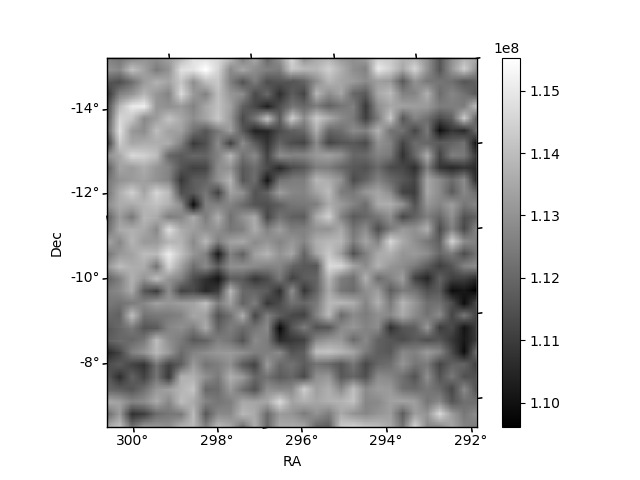
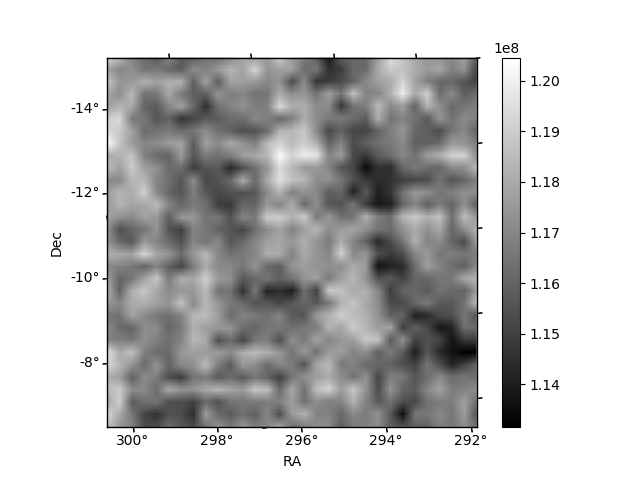
Histogram calculated using DETX and DETY for each event in the final _common_clean file
| Quadrant A | 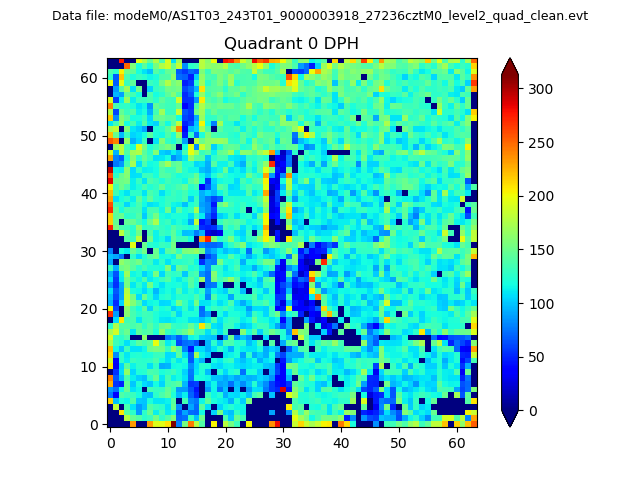 |
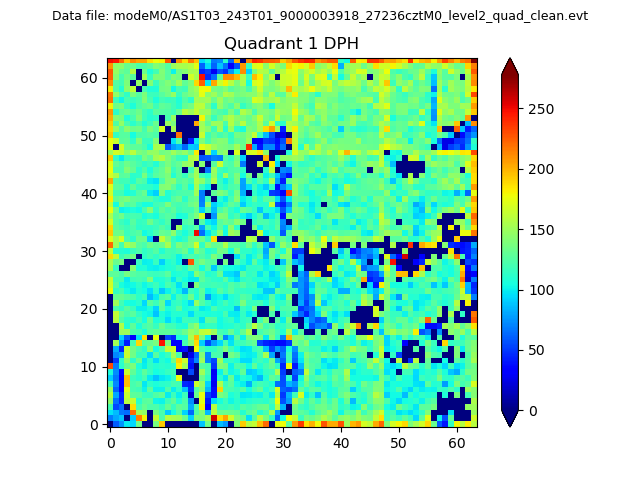 |
Quadrant B |
|---|---|---|---|
| Quadrant D | 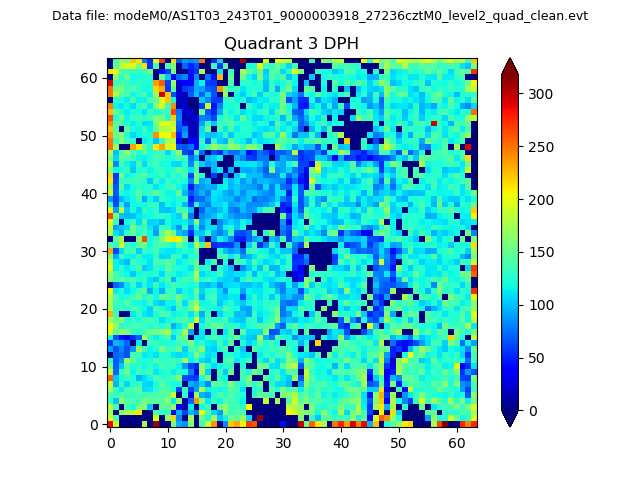 |
 |
Quadrant C |
| Plot type | Count rate plots | Images |
|---|---|---|
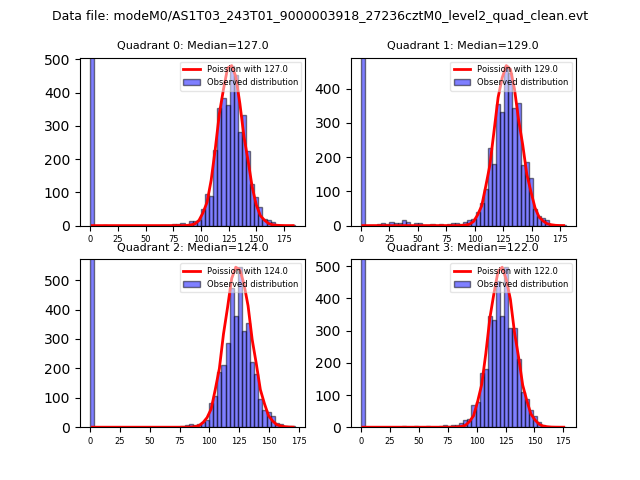
| Comparison with Poisson distribution Blue bars denote a histogram of data divided into 1 sec bins. Red curve is a Poisson curve with rate = median count rate of data. |
 |
 |
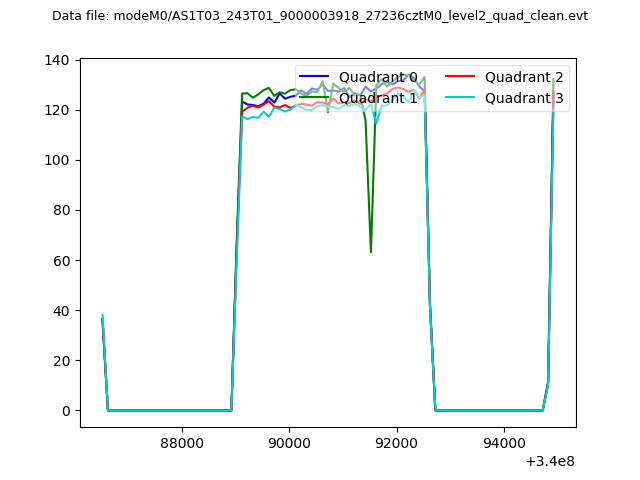
| Quadrant-wise count rates Data is divided into 100 sec bins |
 |
|
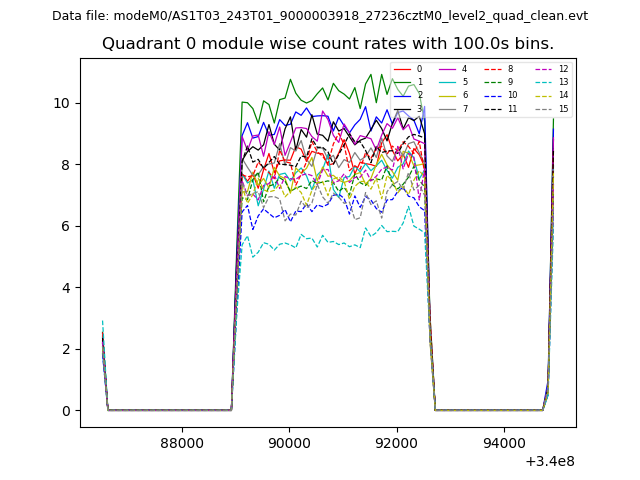
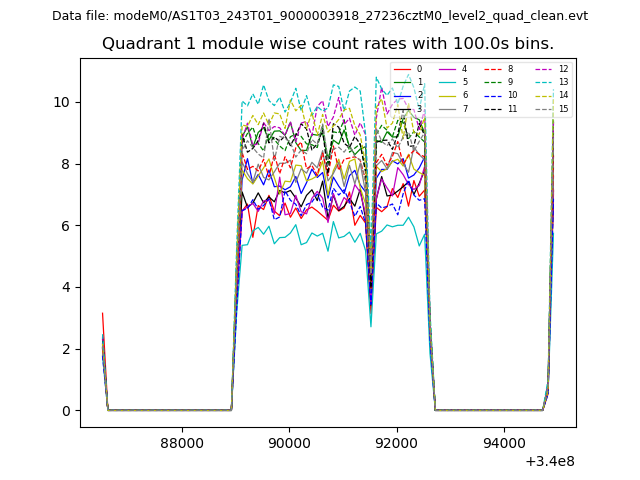
| Module-wise count rates for Quadrant A Data is divided into 100 sec bins |
 |
 |
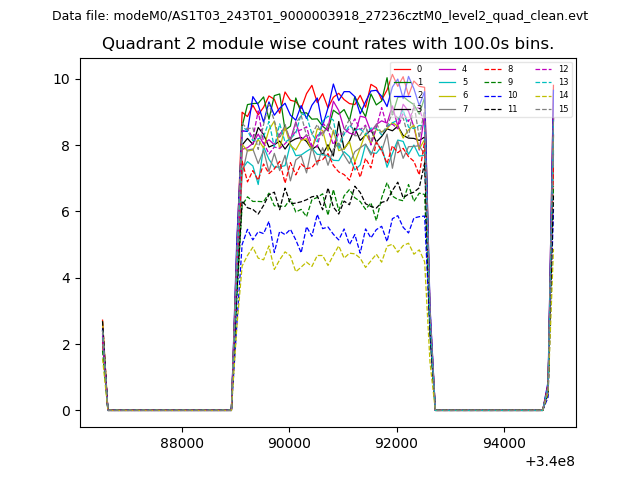
| Module-wise count rates for Quadrant B Data is divided into 100 sec bins |
 |
 |
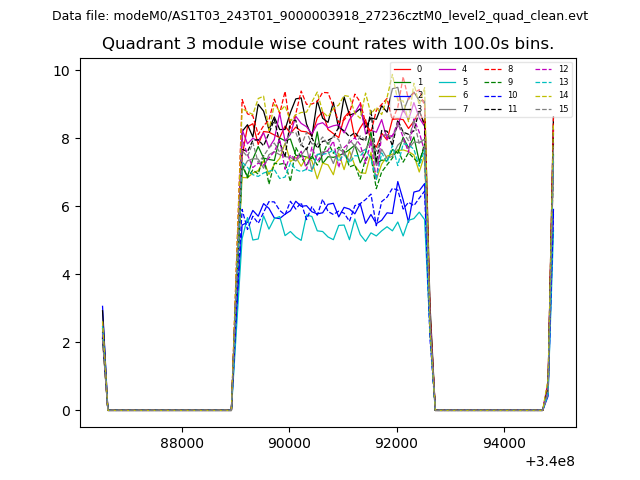
| Module-wise count rates for Quadrant C Data is divided into 100 sec bins |
 |
 |
| Module-wise count rates for Quadrant D Data is divided into 100 sec bins |
 |
 |
| Parameter | Plot |
|---|---|
| CZT HV Monitor | 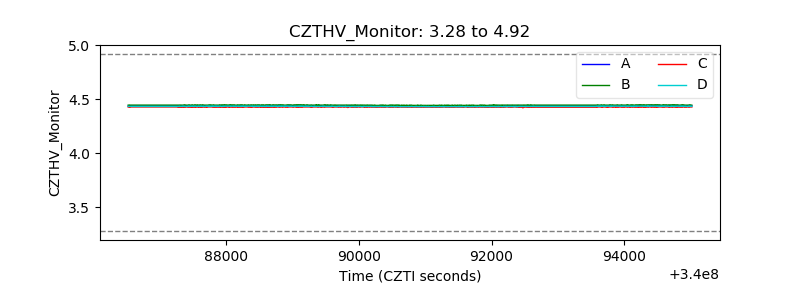 |
| D_VDD | 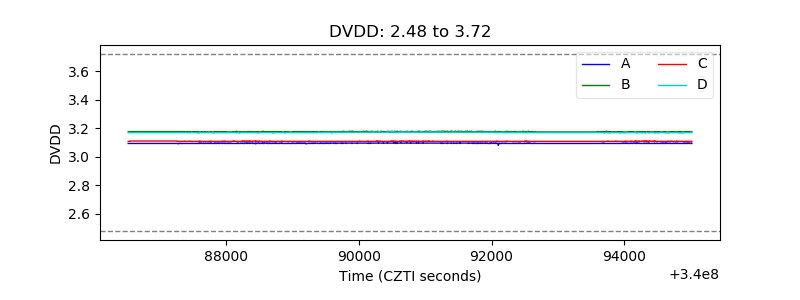 |
| Temperature 1 | 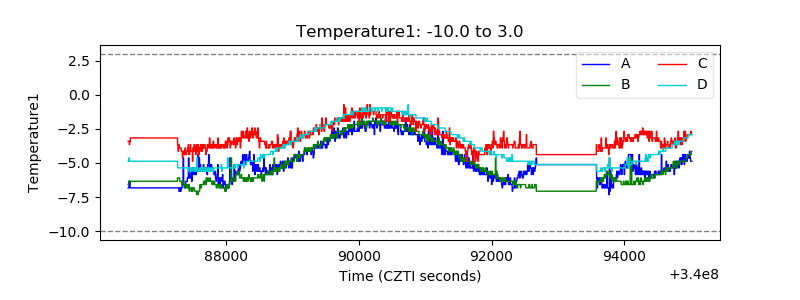 |
| Veto HV Monitor | 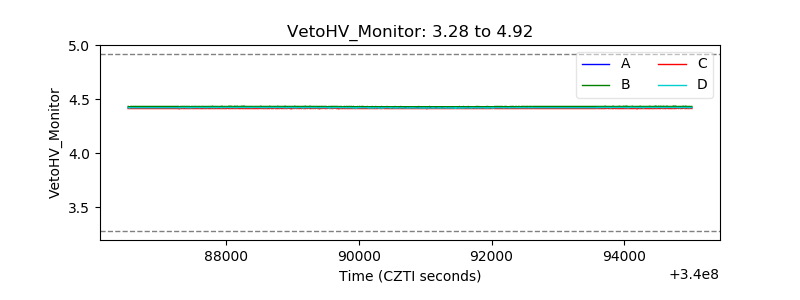 |
| Veto LLD | 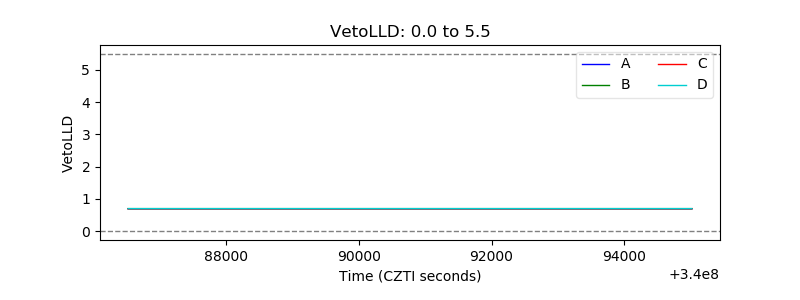 |
| Alpha Counter | 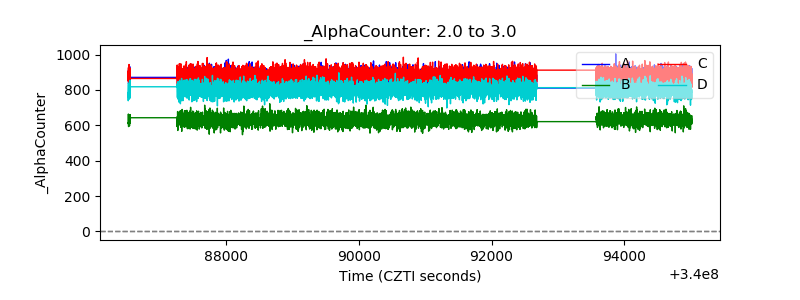 |
| _CPM_Rate | 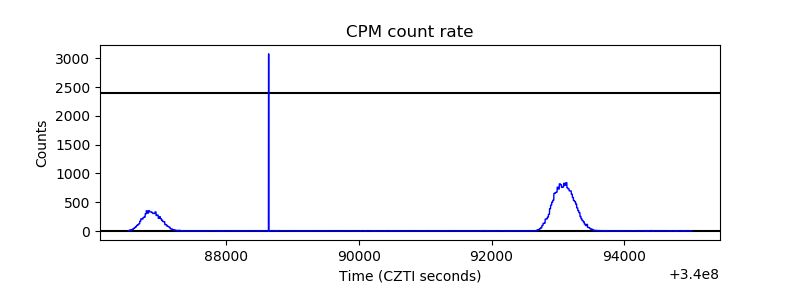 |
| CZT Counter |  |
| +2.5 Volts monitor |  |
| +5 Volts monitor |  |
| _ROLL_ROT | 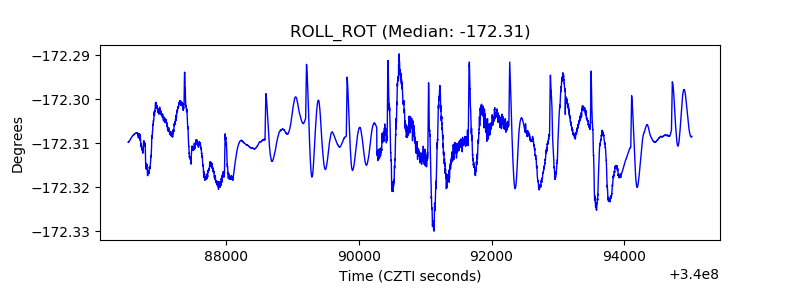 |
| _Roll_DEC |  |
| _Roll_RA | 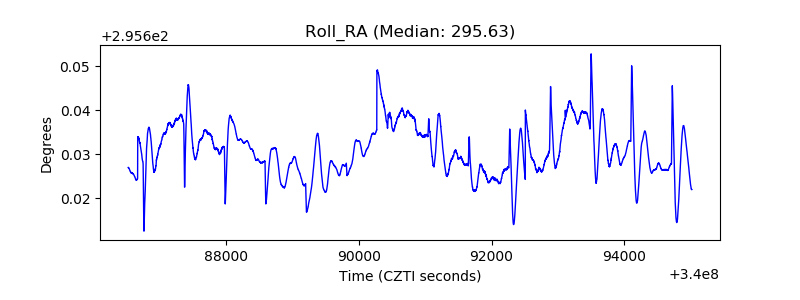 |
| Veto Counter |  |