| Param | Original file | Final file |
|---|---|---|
| Filename | modeM0/AS1T03_243T01_9000003918_27237cztM0_level2.evt | modeM0/AS1T03_243T01_9000003918_27237cztM0_level2_quad_clean.evt |
| Size (bytes) | 521,956,800 | 83,776,320 |
| Size | 497.8 MB | 79.9 MB |
| Events in quadrant A | 3,378,074 | 535,190 |
| Events in quadrant B | 3,801,945 | 541,772 |
| Events in quadrant C | 3,327,762 | 515,025 |
| Events in quadrant D | 4,852,147 | 484,809 |
| Mode M9 | |||
|---|---|---|---|
| Quadrant | BADHDUFLAG | Total packets | Discarded packets |
| A | 0 | 11 | 0 |
| B | 0 | 12 | 0 |
| C | 0 | 12 | 0 |
| D | 0 | 12 | 0 |
| Mode M0 | |||
|---|---|---|---|
| Quadrant | BADHDUFLAG | Total packets | Discarded packets |
| A | 0 | 14145 | 0 |
| B | 0 | 15406 | 0 |
| C | 0 | 14045 | 0 |
| D | 0 | 18688 | 0 |
| Quadrant | Total seconds | Saturated seconds | Saturation percentage |
|---|---|---|---|
| A | 6603 | 78 | 1.181281% |
| B | 6603 | 134 | 2.029381% |
| C | 6603 | 117 | 1.771922% |
| D | 6603 | 402 | 6.088142% |
Noise dominated data is calculated using 1-second bins in cleaned event files. If a bin has >2000 counts, and if more than 50% of those come from <1% of pixels, then it is considered to be noise-dominated and hence unusable.
| Quadrant | # 1 sec bins | Bins with >0 counts | Bins with >2000 counts | High rate bins dominated by noise | Noise dominated (total time) | Noise dominated (detector-on time) | Marked lightcurve |
|---|---|---|---|---|---|---|---|
| A | 7643 | 6603 | 0 | 0 | 0.00% | 0.00% | 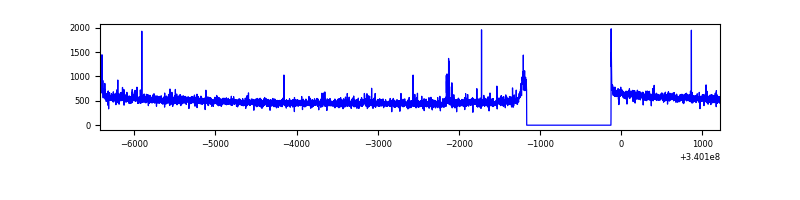 |
| B | 7643 | 6603 | 24 | 24 | 0.31% | 0.36% | 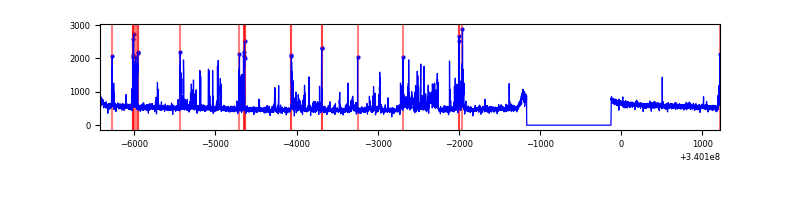 |
| C | 7643 | 6603 | 1 | 1 | 0.01% | 0.02% | 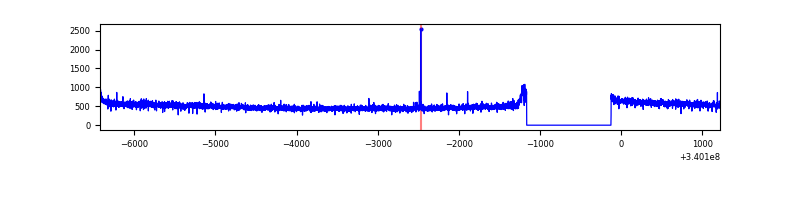 |
| D | 7643 | 6603 | 312 | 312 | 4.08% | 4.73% | 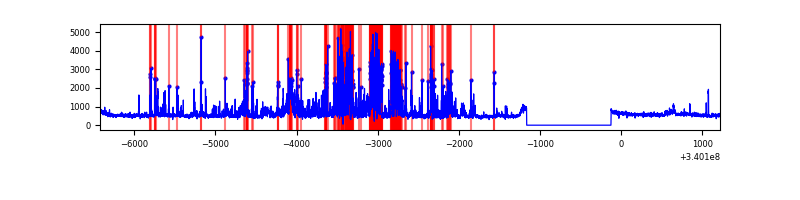 |
Top three noisy pixels from each quadrant. If the there are fewer than three noisy pixels in the level2.evt file, extra rows are filled as -1
| Pixel properties | Quadrant properties | ||||||
|---|---|---|---|---|---|---|---|
| Quadrant | DetID | PixID | Counts | Sigma | Mean | Median | Sigma |
| A | 0 | 13 | 20742 | 115.71 | 858 | 843 | 172.0 |
| A | 14 | 235 | 15226 | 83.63 | 858 | 843 | 172.0 |
| A | 15 | 174 | 13070 | 71.1 | 858 | 843 | 172.0 |
| B | 3 | 64 | 414844 | 2553.24 | 849 | 830 | 162.2 |
| B | 0 | 190 | 24687 | 147.13 | 849 | 830 | 162.2 |
| B | 12 | 111 | 19962 | 117.99 | 849 | 830 | 162.2 |
| C | 14 | 238 | 132254 | 691.63 | 814 | 821 | 190.0 |
| C | 1 | 16 | 12878 | 63.45 | 814 | 821 | 190.0 |
| C | 15 | 208 | 11033 | 53.74 | 814 | 821 | 190.0 |
| D | 1 | 52 | 1610152 | 8275.74 | 810 | 791 | 194.5 |
| D | 2 | 250 | 97510 | 497.35 | 810 | 791 | 194.5 |
| D | 2 | 120 | 29656 | 148.43 | 810 | 791 | 194.5 |
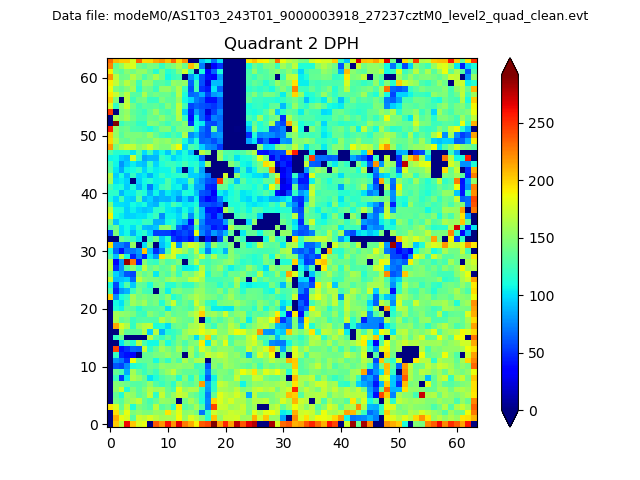
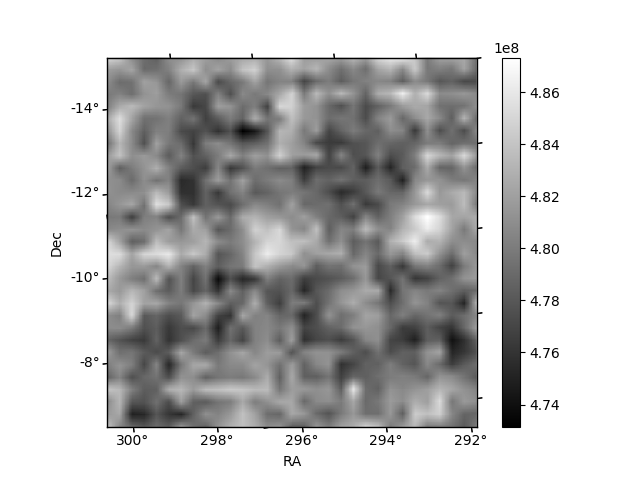
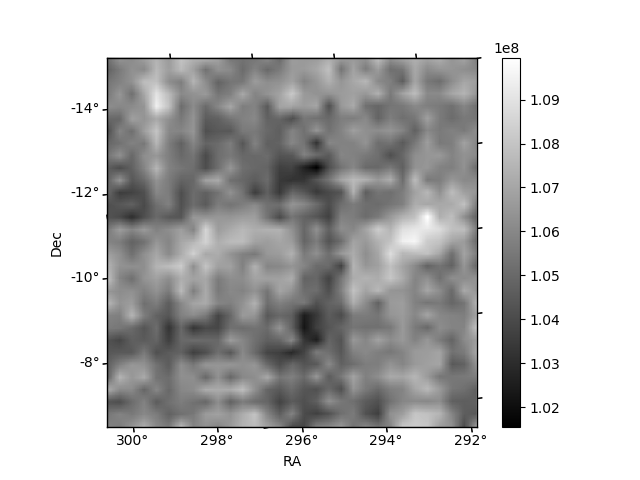
Histogram calculated using DETX and DETY for each event in the final _common_clean file
| Quadrant A | 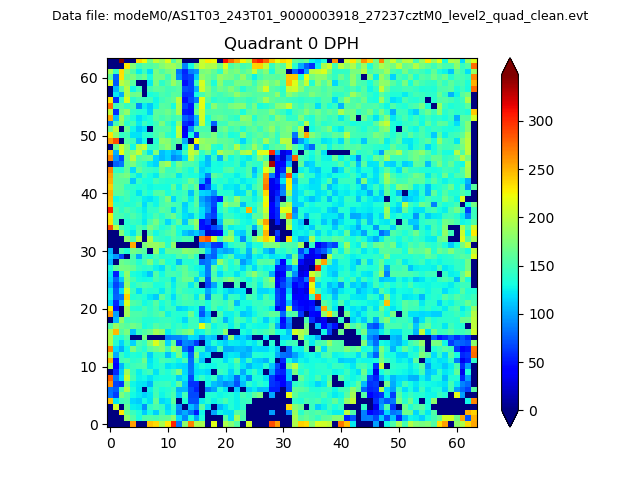 |
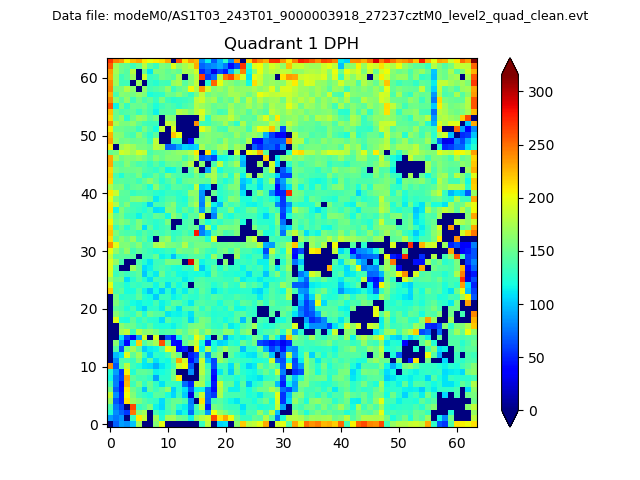 |
Quadrant B |
|---|---|---|---|
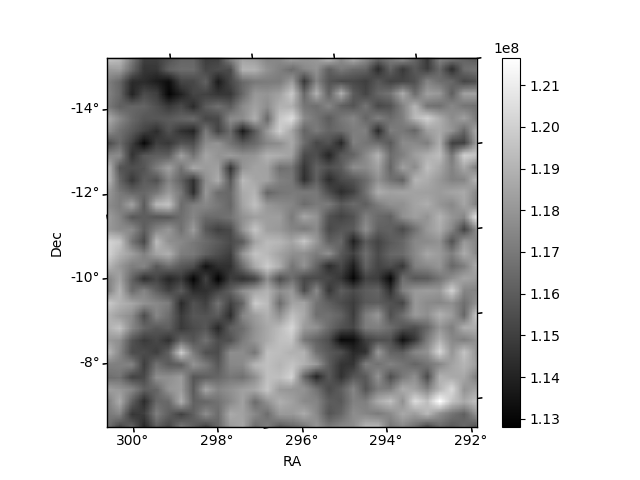
| Quadrant D | 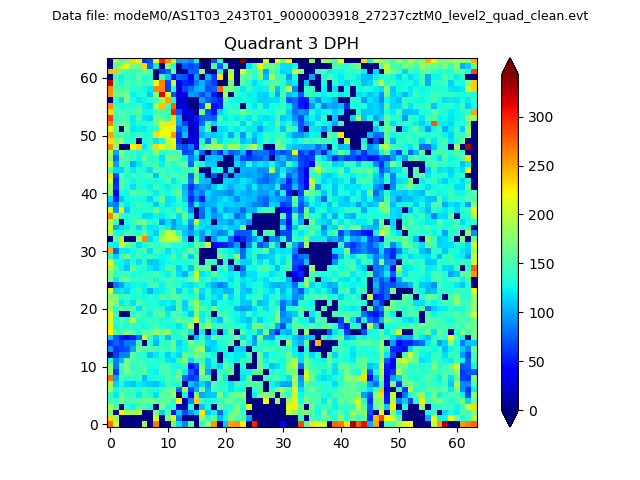 |
 |
Quadrant C |
| Plot type | Count rate plots | Images |
|---|---|---|
| Comparison with Poisson distribution Blue bars denote a histogram of data divided into 1 sec bins. Red curve is a Poisson curve with rate = median count rate of data. |
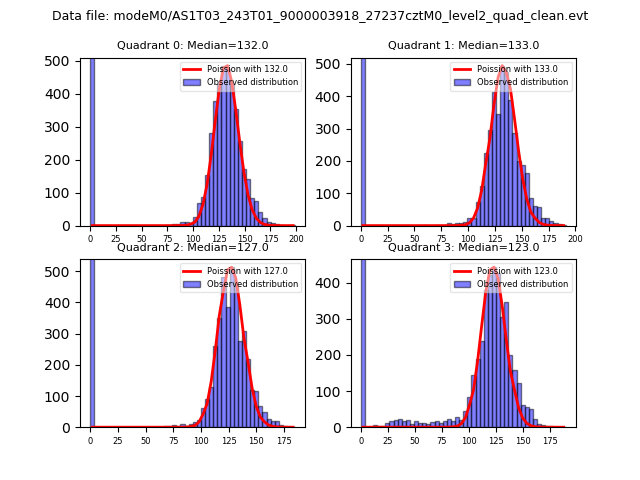 |
 |
| Quadrant-wise count rates Data is divided into 100 sec bins |
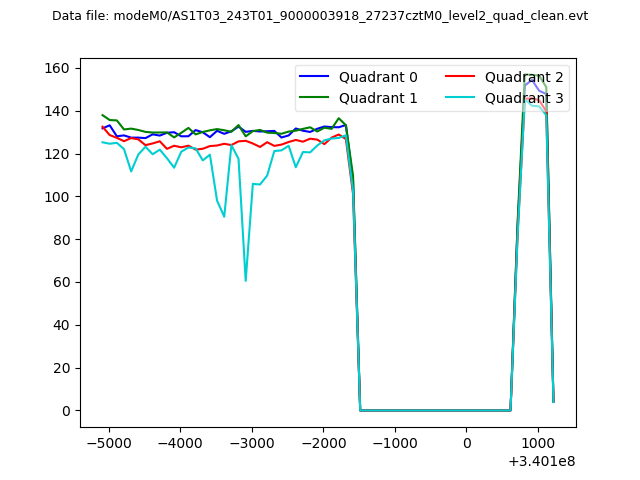 |
|
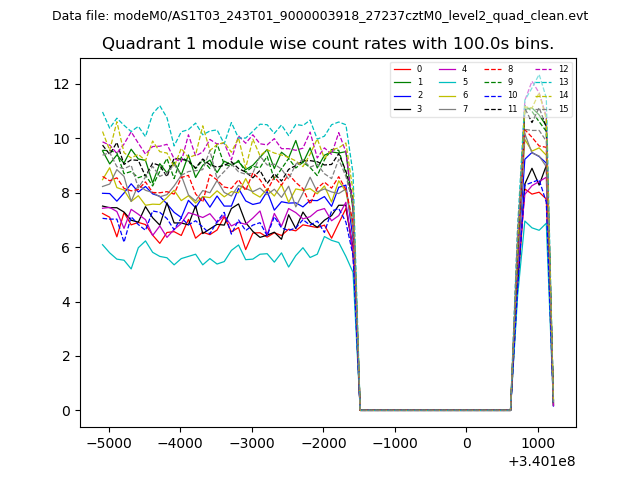
| Module-wise count rates for Quadrant A Data is divided into 100 sec bins |
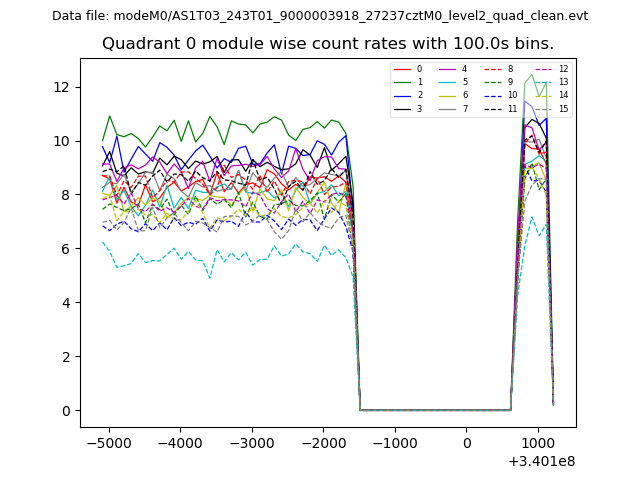 |
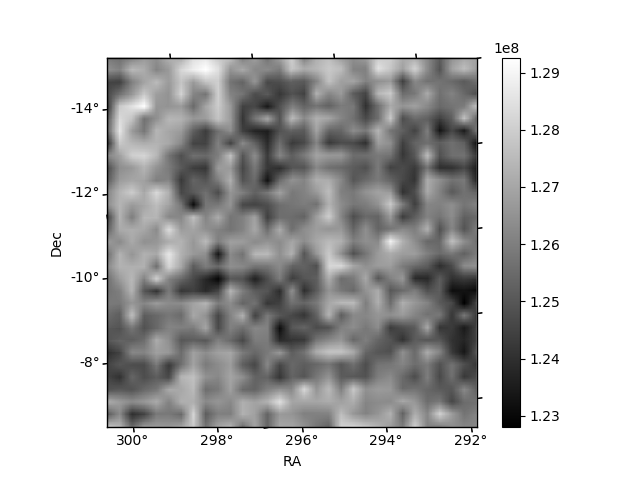 |
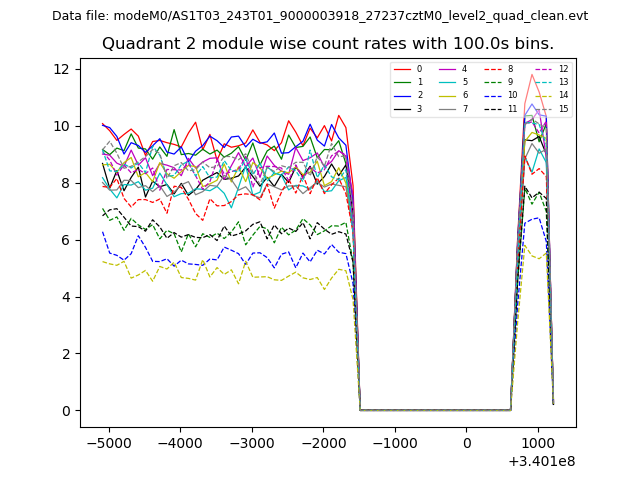
| Module-wise count rates for Quadrant B Data is divided into 100 sec bins |
 |
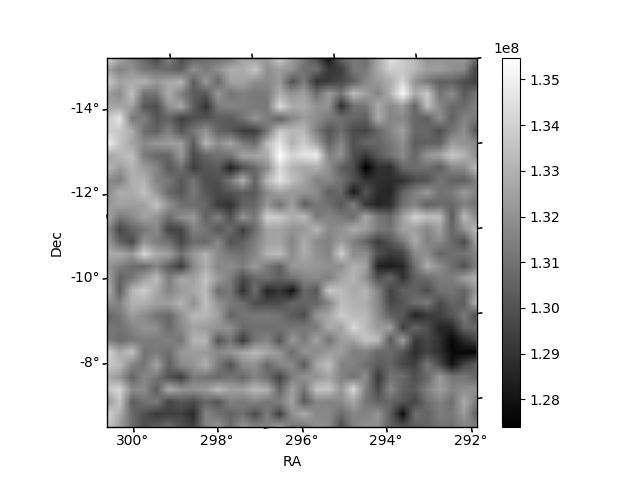 |
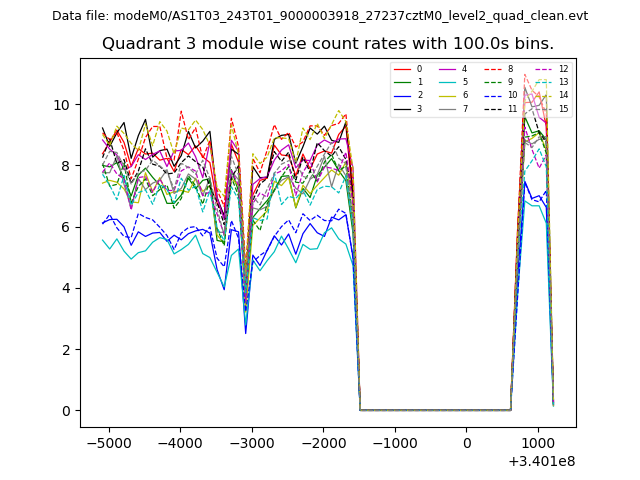
| Module-wise count rates for Quadrant C Data is divided into 100 sec bins |
 |
 |
| Module-wise count rates for Quadrant D Data is divided into 100 sec bins |
 |
 |
| Parameter | Plot |
|---|---|
| CZT HV Monitor | 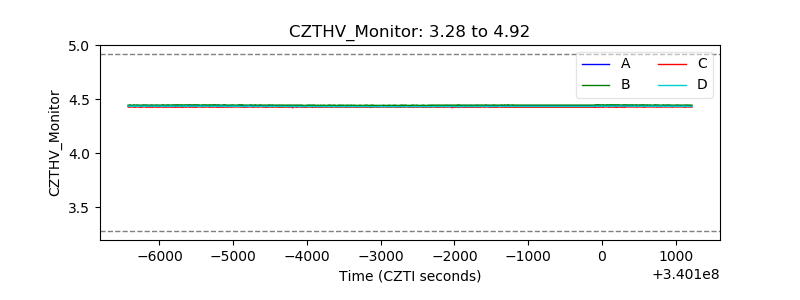 |
| D_VDD | 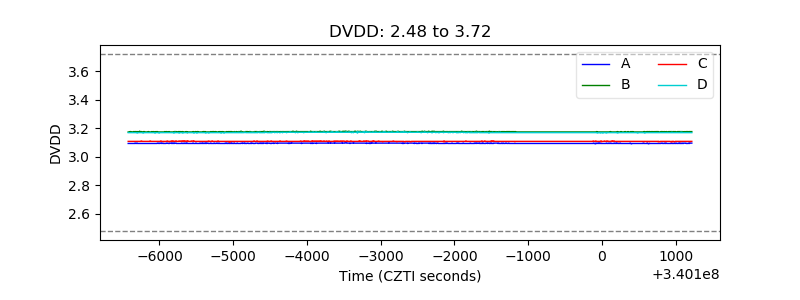 |
| Temperature 1 | 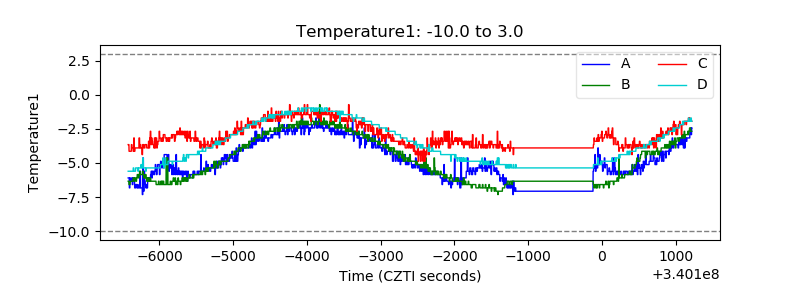 |
| Veto HV Monitor | 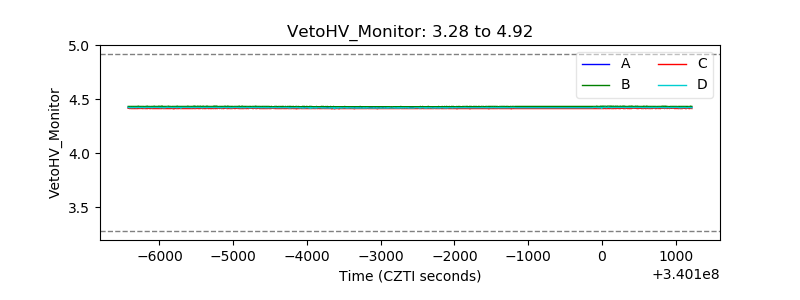 |
| Veto LLD | 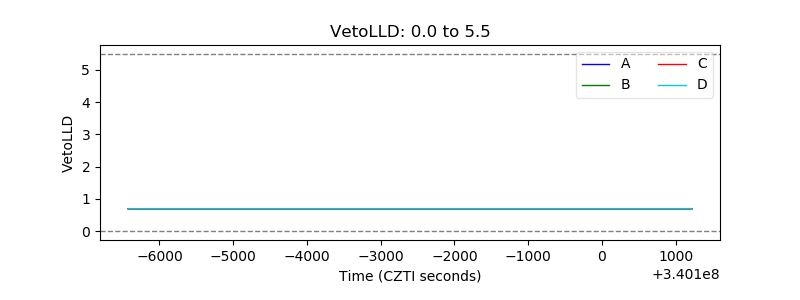 |
| Alpha Counter | 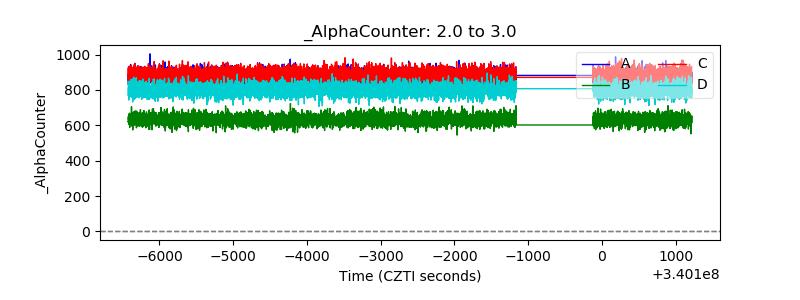 |
| _CPM_Rate | 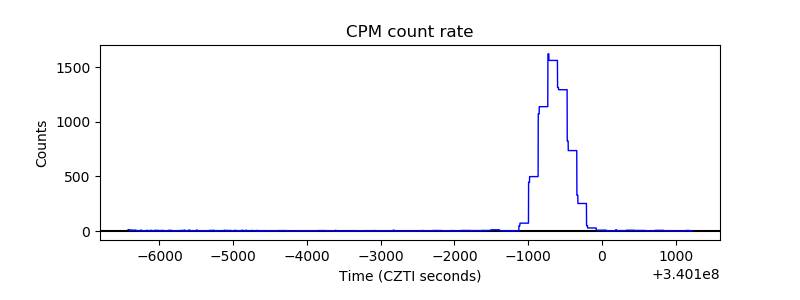 |
| CZT Counter | 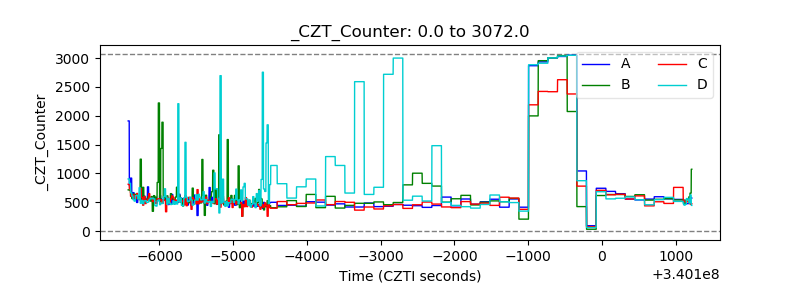 |
| +2.5 Volts monitor |  |
| +5 Volts monitor |  |
| _ROLL_ROT | 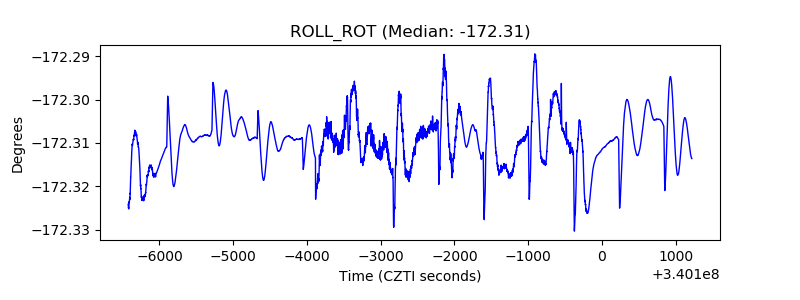 |
| _Roll_DEC | 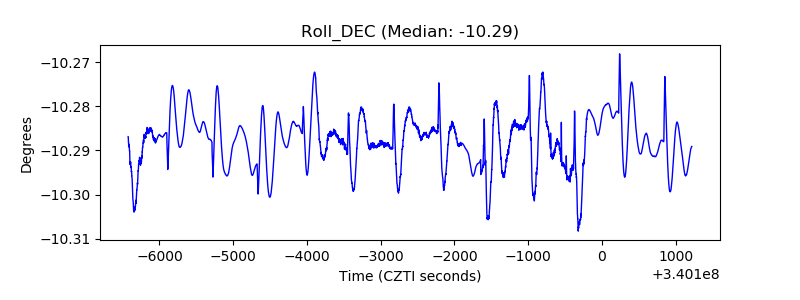 |
| _Roll_RA | 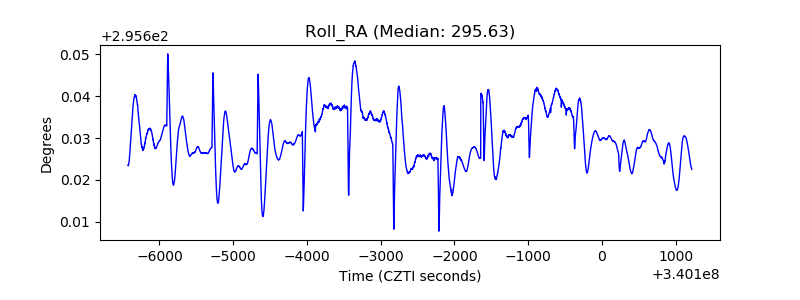 |
| Veto Counter | 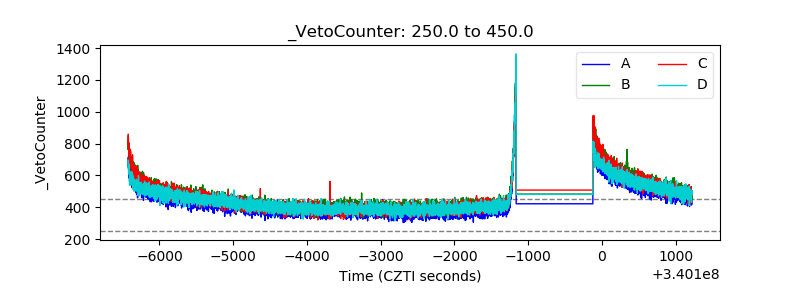 |