| Param | Original file | Final file |
|---|---|---|
| Filename | modeM0/AS1T03_243T01_9000003918_27239cztM0_level2.evt | modeM0/AS1T03_243T01_9000003918_27239cztM0_level2_quad_clean.evt |
| Size (bytes) | 445,884,480 | 97,289,280 |
| Size | 425.2 MB | 92.8 MB |
| Events in quadrant A | 3,161,042 | 647,971 |
| Events in quadrant B | 3,385,828 | 655,146 |
| Events in quadrant C | 3,091,028 | 616,083 |
| Events in quadrant D | 3,460,731 | 610,651 |
| Mode M9 | |||
|---|---|---|---|
| Quadrant | BADHDUFLAG | Total packets | Discarded packets |
| A | 0 | 12 | 0 |
| B | 0 | 12 | 0 |
| C | 0 | 12 | 0 |
| D | 0 | 12 | 0 |
| Mode M0 | |||
|---|---|---|---|
| Quadrant | BADHDUFLAG | Total packets | Discarded packets |
| A | 0 | 13257 | 0 |
| B | 0 | 13883 | 0 |
| C | 0 | 13032 | 0 |
| D | 0 | 14107 | 0 |
| Quadrant | Total seconds | Saturated seconds | Saturation percentage |
|---|---|---|---|
| A | 5967 | 77 | 1.290431% |
| B | 5967 | 87 | 1.458019% |
| C | 5968 | 89 | 1.491287% |
| D | 5968 | 84 | 1.407507% |
Noise dominated data is calculated using 1-second bins in cleaned event files. If a bin has >2000 counts, and if more than 50% of those come from <1% of pixels, then it is considered to be noise-dominated and hence unusable.
| Quadrant | # 1 sec bins | Bins with >0 counts | Bins with >2000 counts | High rate bins dominated by noise | Noise dominated (total time) | Noise dominated (detector-on time) | Marked lightcurve |
|---|---|---|---|---|---|---|---|
| A | 7142 | 5968 | 2 | 2 | 0.03% | 0.03% | 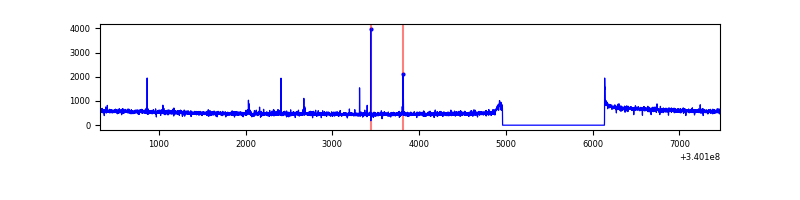 |
| B | 7142 | 5968 | 12 | 12 | 0.17% | 0.20% | 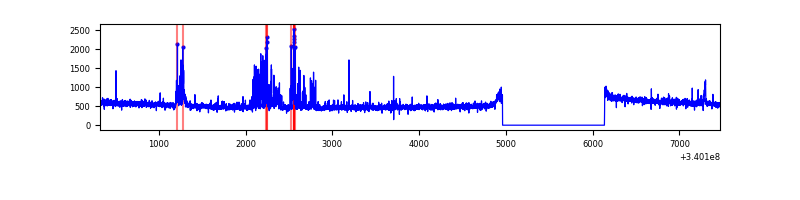 |
| C | 7143 | 5969 | 0 | 0 | 0.00% | 0.00% | 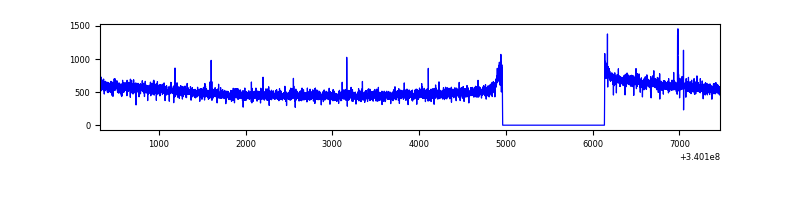 |
| D | 7143 | 5969 | 33 | 33 | 0.46% | 0.55% | 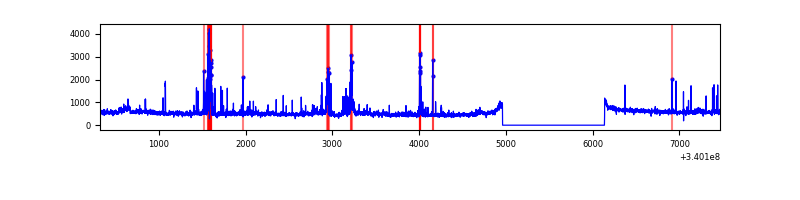 |
Top three noisy pixels from each quadrant. If the there are fewer than three noisy pixels in the level2.evt file, extra rows are filled as -1
| Pixel properties | Quadrant properties | ||||||
|---|---|---|---|---|---|---|---|
| Quadrant | DetID | PixID | Counts | Sigma | Mean | Median | Sigma |
| A | 15 | 174 | 14925 | 87.56 | 808 | 796 | 161.4 |
| A | 12 | 96 | 14123 | 82.59 | 808 | 796 | 161.4 |
| A | 14 | 235 | 9649 | 54.87 | 808 | 796 | 161.4 |
| B | 3 | 64 | 108859 | 717.8 | 795 | 778 | 150.6 |
| B | 15 | 33 | 103735 | 683.77 | 795 | 778 | 150.6 |
| B | 0 | 190 | 24407 | 156.93 | 795 | 778 | 150.6 |
| C | 14 | 238 | 123744 | 695.81 | 757 | 765 | 176.7 |
| C | 15 | 208 | 15984 | 86.11 | 757 | 765 | 176.7 |
| C | 4 | 224 | 5423 | 26.35 | 757 | 765 | 176.7 |
| D | 1 | 52 | 218513 | 1173.96 | 773 | 757 | 185.5 |
| D | 12 | 233 | 137889 | 739.3 | 773 | 757 | 185.5 |
| D | 7 | 38 | 90638 | 484.56 | 773 | 757 | 185.5 |
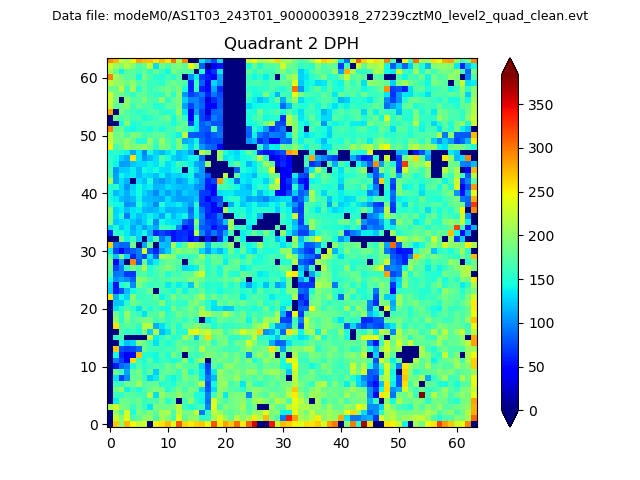
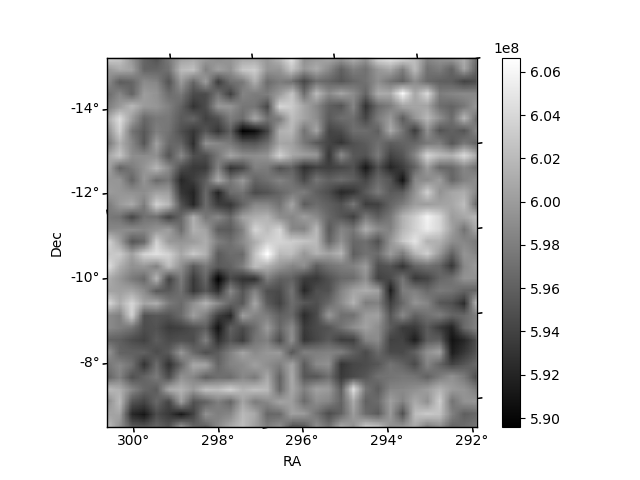
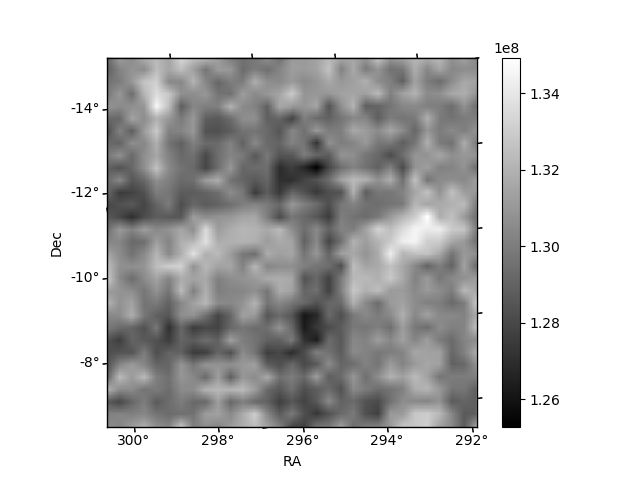
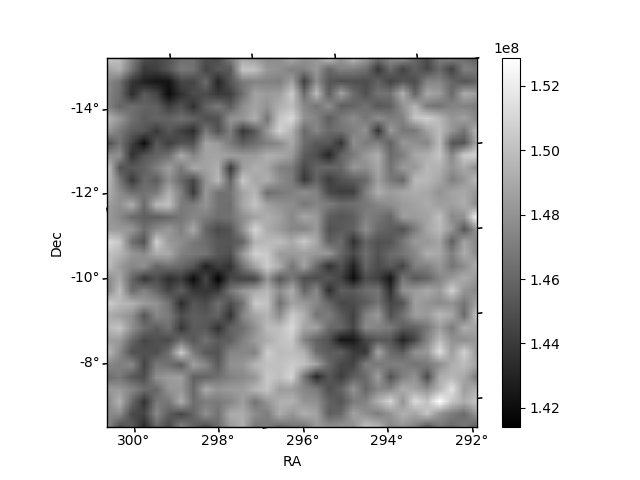
Histogram calculated using DETX and DETY for each event in the final _common_clean file
| Quadrant A | 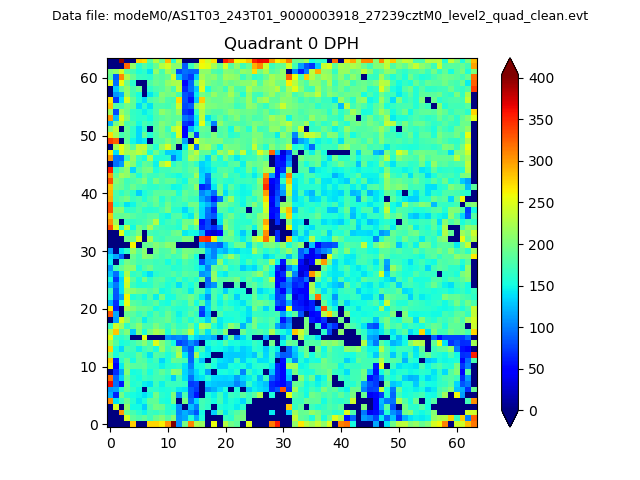 |
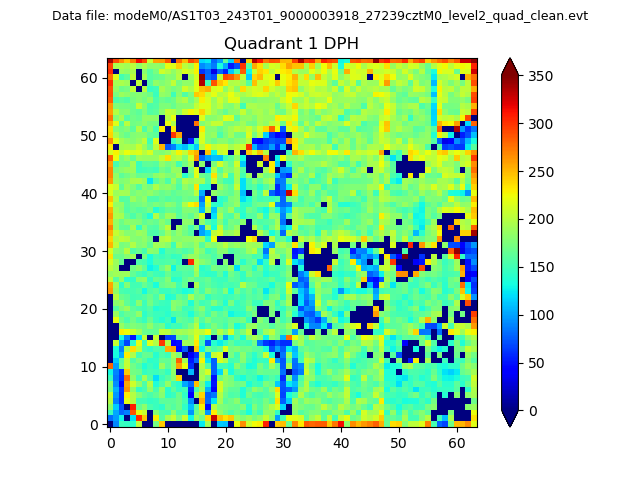 |
Quadrant B |
|---|---|---|---|
| Quadrant D | 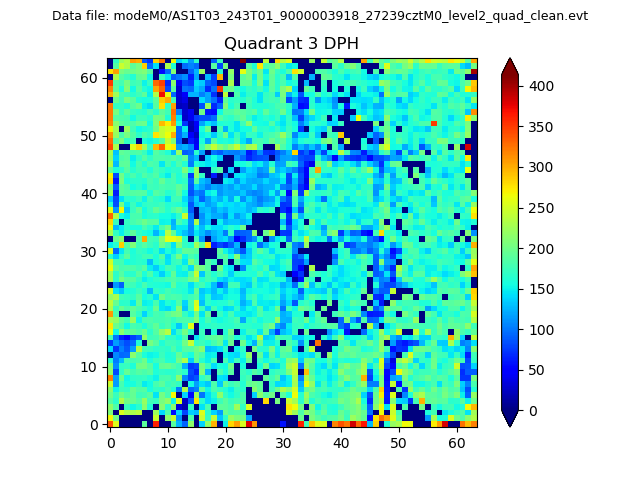 |
 |
Quadrant C |
| Plot type | Count rate plots | Images |
|---|---|---|
| Comparison with Poisson distribution Blue bars denote a histogram of data divided into 1 sec bins. Red curve is a Poisson curve with rate = median count rate of data. |
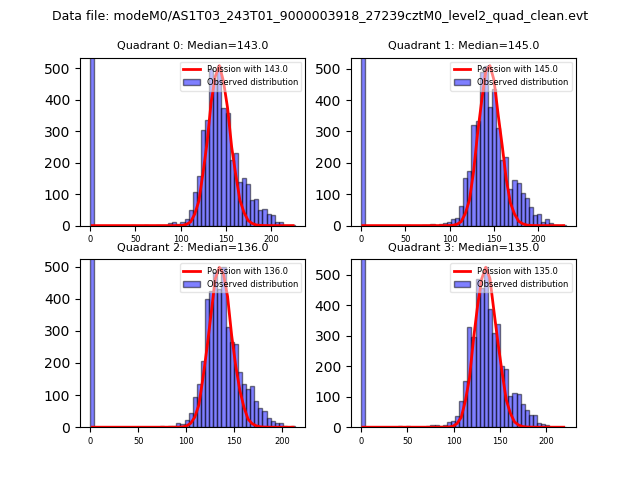 |
 |
| Quadrant-wise count rates Data is divided into 100 sec bins |
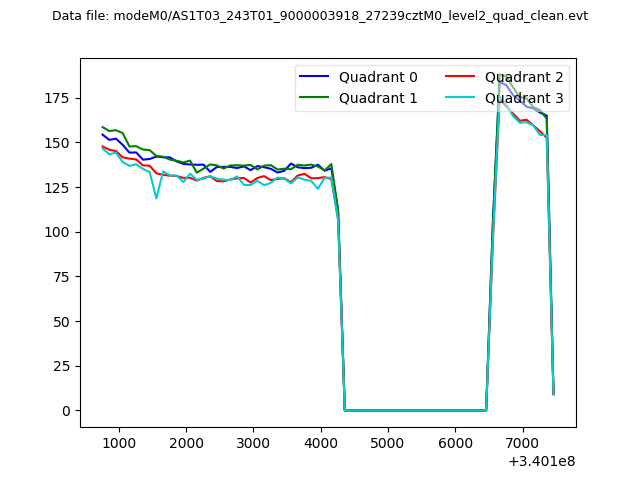 |
|
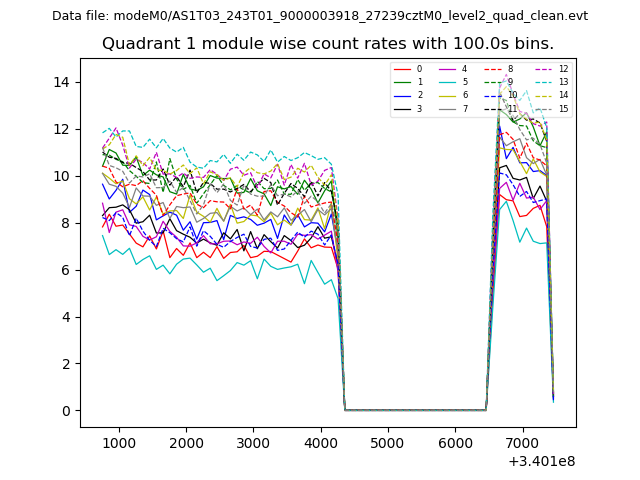
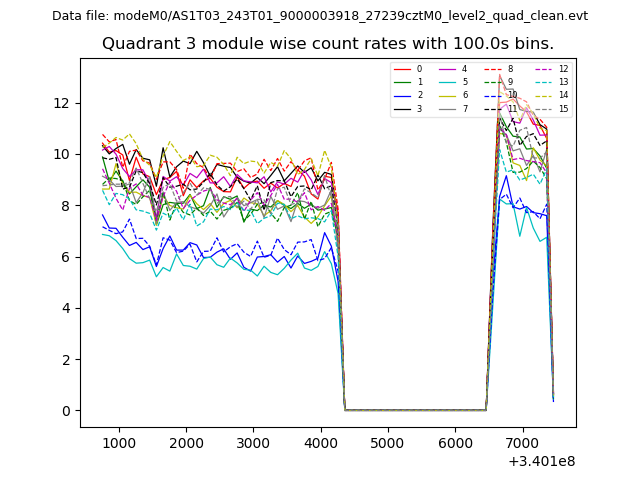
| Module-wise count rates for Quadrant A Data is divided into 100 sec bins |
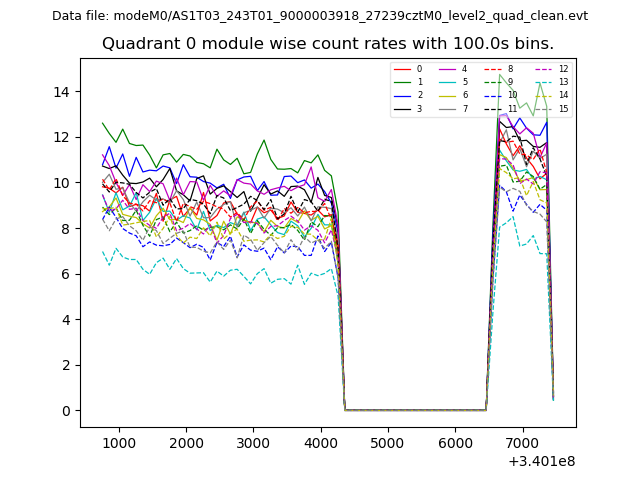 |
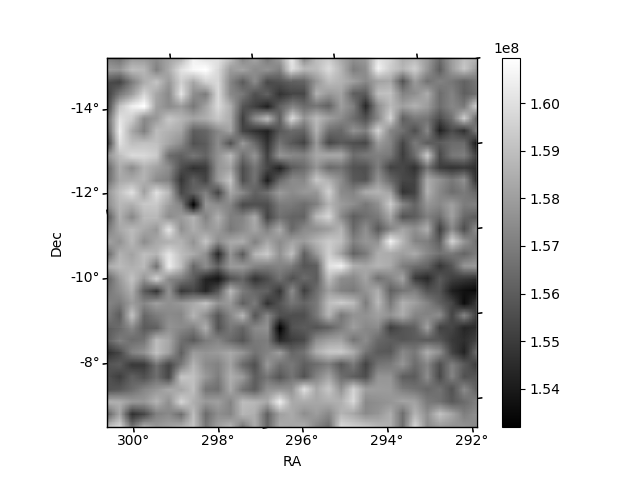 |
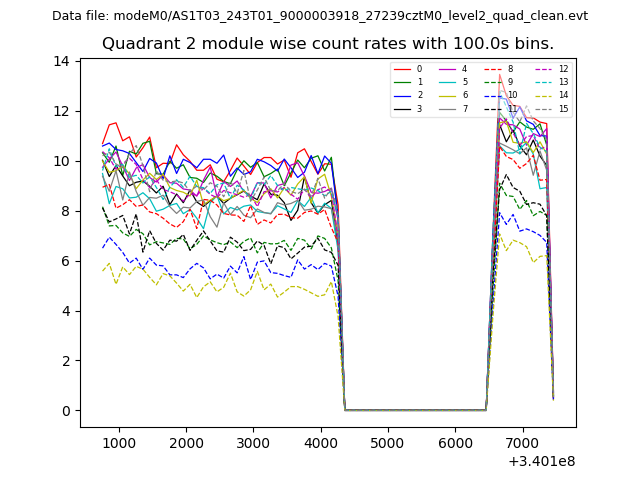
| Module-wise count rates for Quadrant B Data is divided into 100 sec bins |
 |
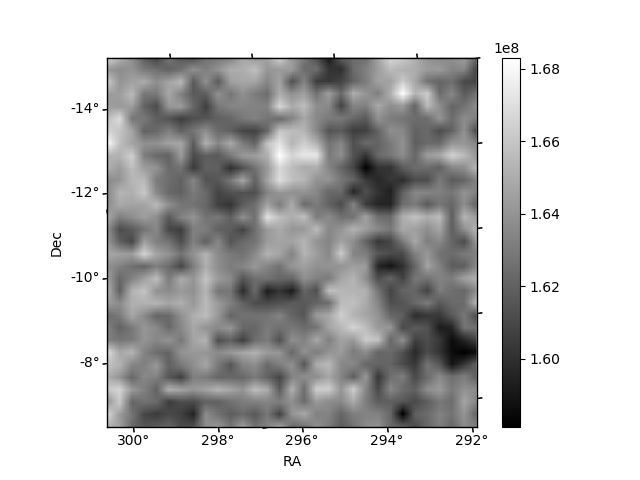 |
| Module-wise count rates for Quadrant C Data is divided into 100 sec bins |
 |
 |
| Module-wise count rates for Quadrant D Data is divided into 100 sec bins |
 |
 |
| Parameter | Plot |
|---|---|
| CZT HV Monitor | 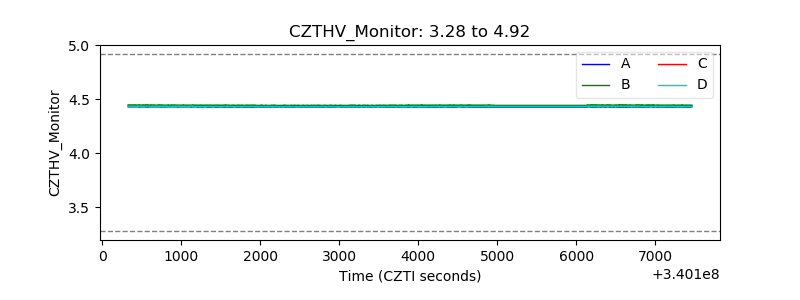 |
| D_VDD | 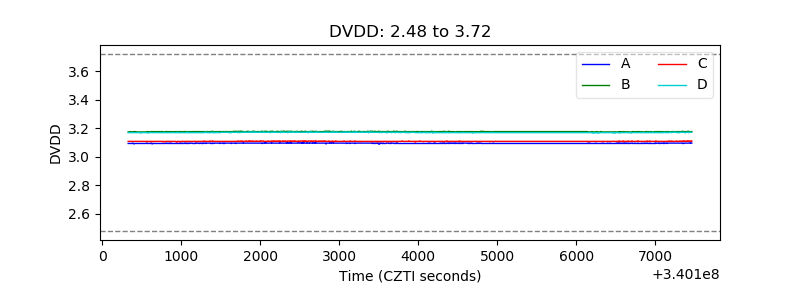 |
| Temperature 1 | 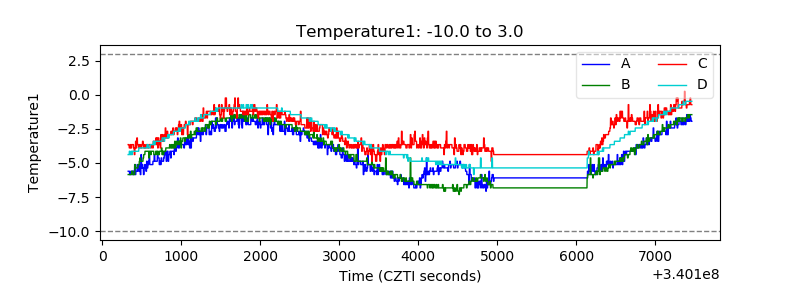 |
| Veto HV Monitor | 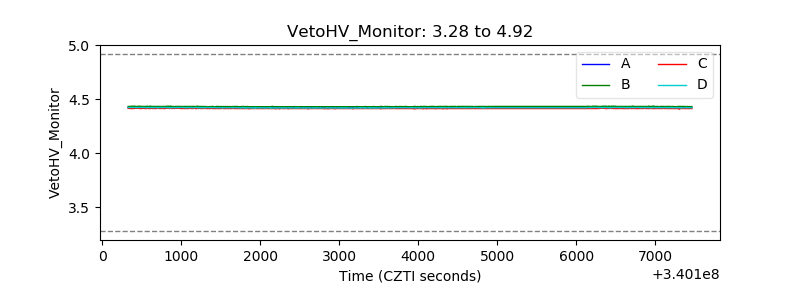 |
| Veto LLD |  |
| Alpha Counter | 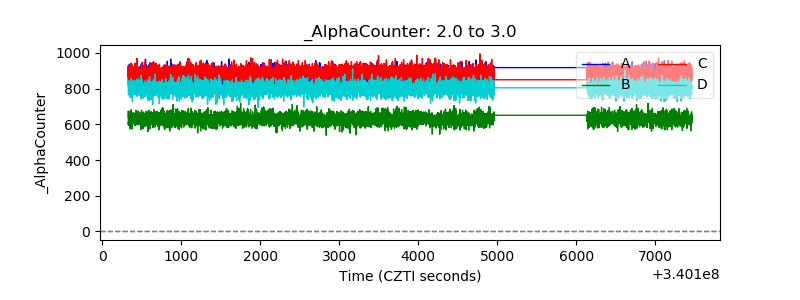 |
| _CPM_Rate | 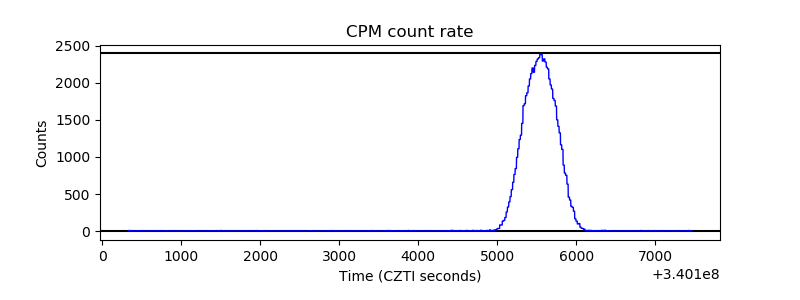 |
| CZT Counter | 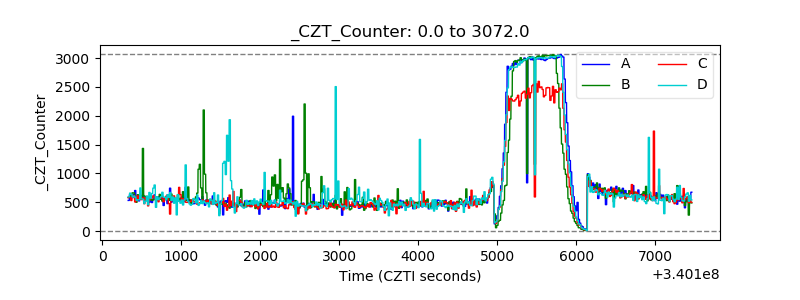 |
| +2.5 Volts monitor | 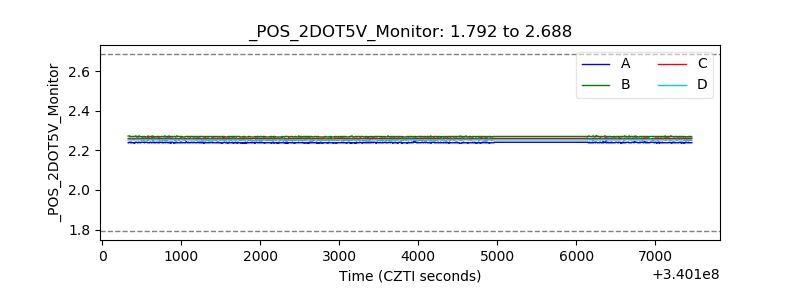 |
| +5 Volts monitor | 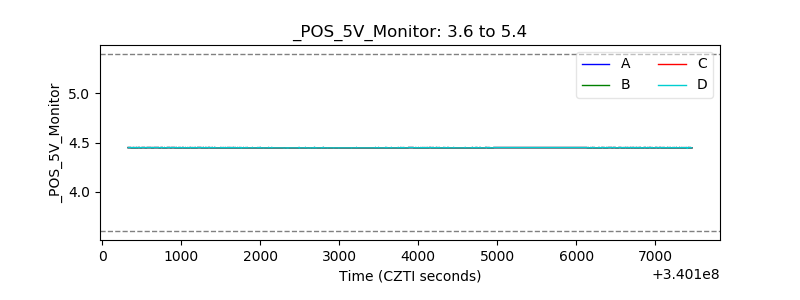 |
| _ROLL_ROT | 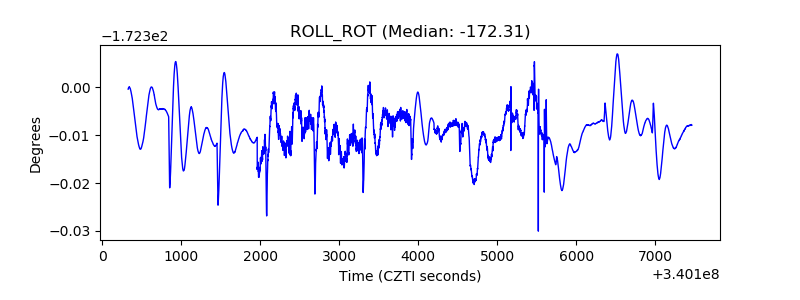 |
| _Roll_DEC | 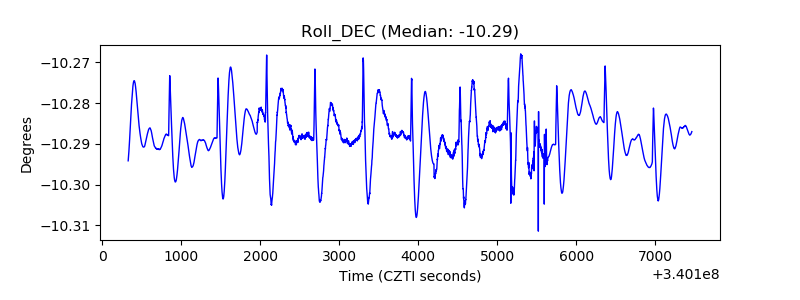 |
| _Roll_RA | 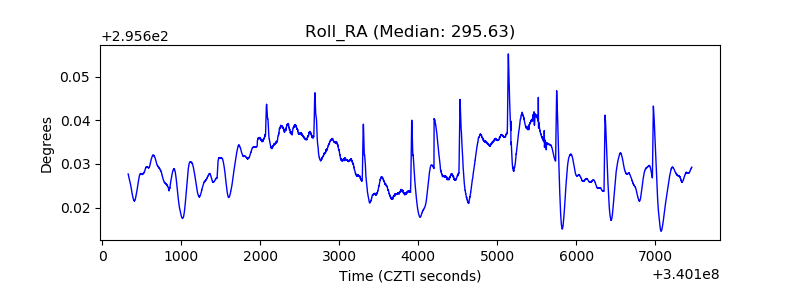 |
| Veto Counter | 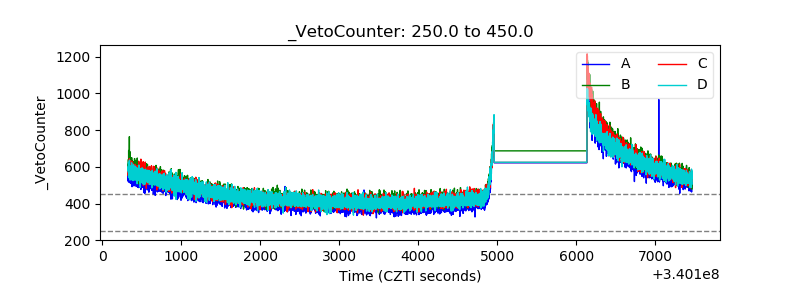 |