| Param | Original file | Final file |
|---|---|---|
| Filename | modeM0/AS1T03_243T01_9000003918_27240cztM0_level2.evt | modeM0/AS1T03_243T01_9000003918_27240cztM0_level2_quad_clean.evt |
| Size (bytes) | 467,640,000 | 114,220,800 |
| Size | 446.0 MB | 108.9 MB |
| Events in quadrant A | 3,244,224 | 788,237 |
| Events in quadrant B | 3,361,776 | 792,324 |
| Events in quadrant C | 3,161,109 | 735,040 |
| Events in quadrant D | 3,994,027 | 730,705 |
| Mode M9 | |||
|---|---|---|---|
| Quadrant | BADHDUFLAG | Total packets | Discarded packets |
| A | 0 | 13 | 0 |
| B | 0 | 13 | 0 |
| C | 0 | 13 | 0 |
| D | 0 | 13 | 0 |
| Mode M0 | |||
|---|---|---|---|
| Quadrant | BADHDUFLAG | Total packets | Discarded packets |
| A | 0 | 13558 | 0 |
| B | 0 | 13893 | 0 |
| C | 0 | 13215 | 0 |
| D | 0 | 15831 | 0 |
| Quadrant | Total seconds | Saturated seconds | Saturation percentage |
|---|---|---|---|
| A | 5916 | 79 | 1.335362% |
| B | 5916 | 100 | 1.690331% |
| C | 5917 | 115 | 1.943552% |
| D | 5917 | 182 | 3.075883% |
Noise dominated data is calculated using 1-second bins in cleaned event files. If a bin has >2000 counts, and if more than 50% of those come from <1% of pixels, then it is considered to be noise-dominated and hence unusable.
| Quadrant | # 1 sec bins | Bins with >0 counts | Bins with >2000 counts | High rate bins dominated by noise | Noise dominated (total time) | Noise dominated (detector-on time) | Marked lightcurve |
|---|---|---|---|---|---|---|---|
| A | 7216 | 5917 | 0 | 0 | 0.00% | 0.00% | 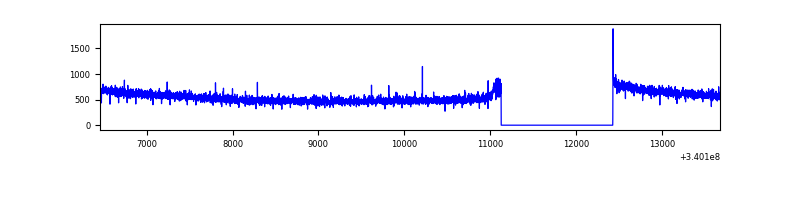 |
| B | 7216 | 5917 | 12 | 12 | 0.17% | 0.20% | 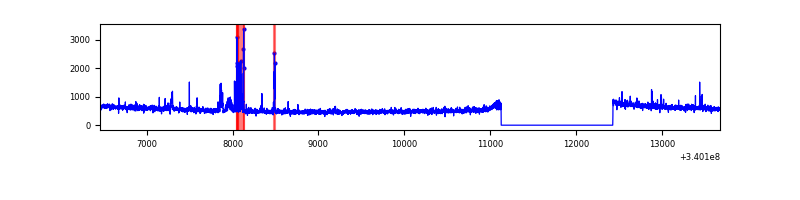 |
| C | 7217 | 5918 | 0 | 0 | 0.00% | 0.00% | 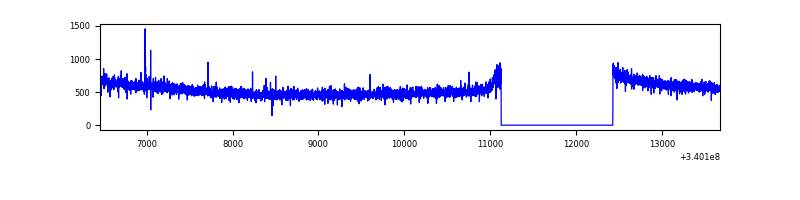 |
| D | 7217 | 5918 | 124 | 124 | 1.72% | 2.10% | 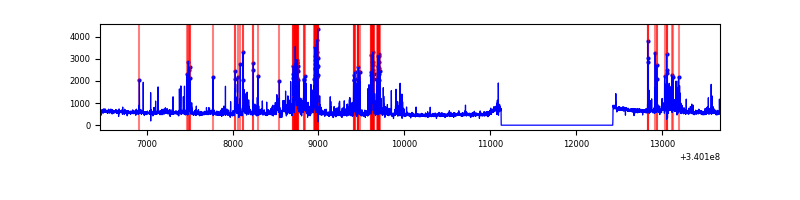 |
Top three noisy pixels from each quadrant. If the there are fewer than three noisy pixels in the level2.evt file, extra rows are filled as -1
| Pixel properties | Quadrant properties | ||||||
|---|---|---|---|---|---|---|---|
| Quadrant | DetID | PixID | Counts | Sigma | Mean | Median | Sigma |
| A | 13 | 254 | 8199 | 43.9 | 837 | 826 | 168.0 |
| A | 0 | 226 | 7315 | 38.63 | 837 | 826 | 168.0 |
| A | 3 | 137 | 7113 | 37.43 | 837 | 826 | 168.0 |
| B | 3 | 64 | 70380 | 455.73 | 816 | 799 | 152.7 |
| B | 15 | 32 | 32808 | 209.65 | 816 | 799 | 152.7 |
| B | 15 | 33 | 29892 | 190.55 | 816 | 799 | 152.7 |
| C | 14 | 238 | 127517 | 707.65 | 775 | 782 | 179.1 |
| C | 15 | 208 | 10707 | 55.42 | 775 | 782 | 179.1 |
| C | 13 | 61 | 5241 | 24.9 | 775 | 782 | 179.1 |
| D | 12 | 233 | 532681 | 2758.67 | 794 | 777 | 192.8 |
| D | 1 | 52 | 240925 | 1245.5 | 794 | 777 | 192.8 |
| D | 2 | 250 | 154742 | 798.52 | 794 | 777 | 192.8 |
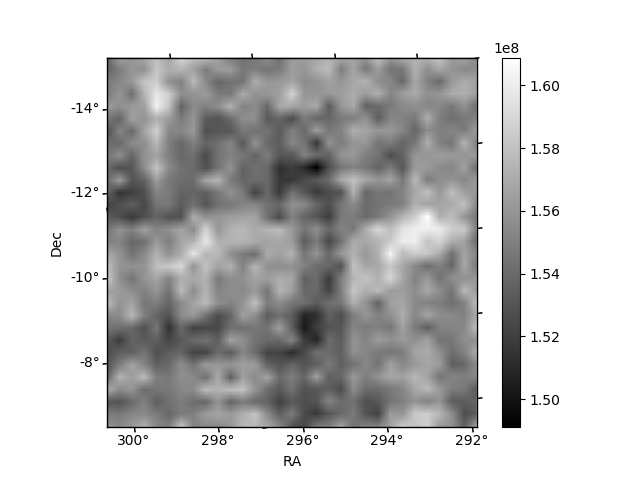
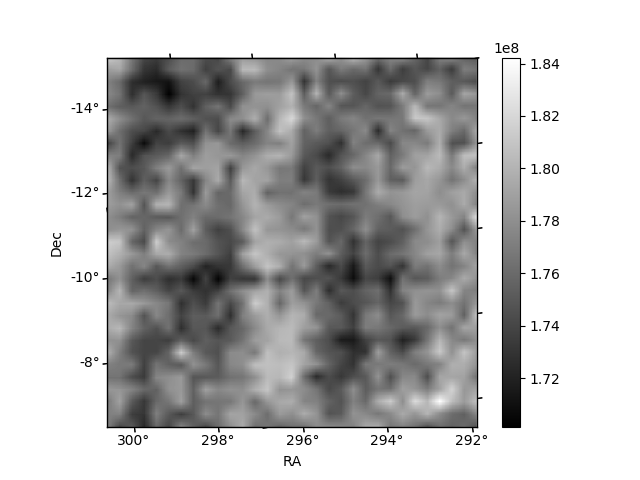
Histogram calculated using DETX and DETY for each event in the final _common_clean file
| Quadrant A | 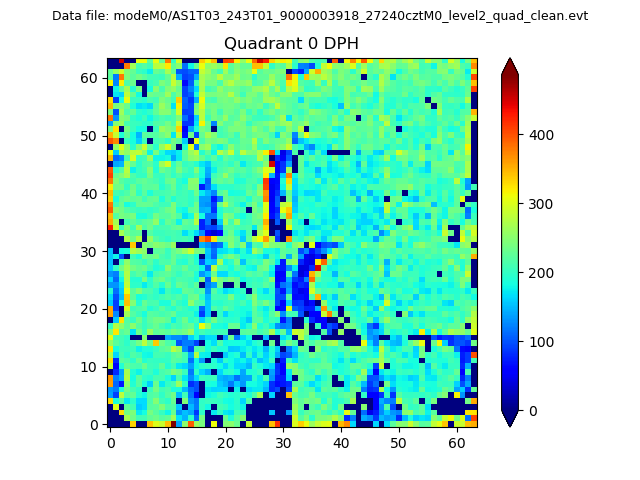 |
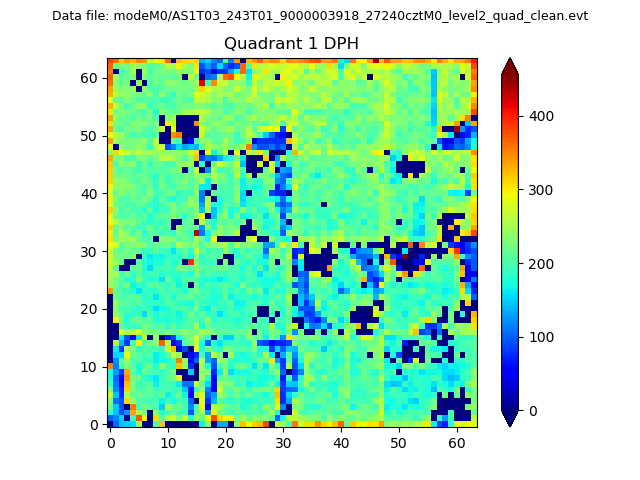 |
Quadrant B |
|---|---|---|---|
| Quadrant D | 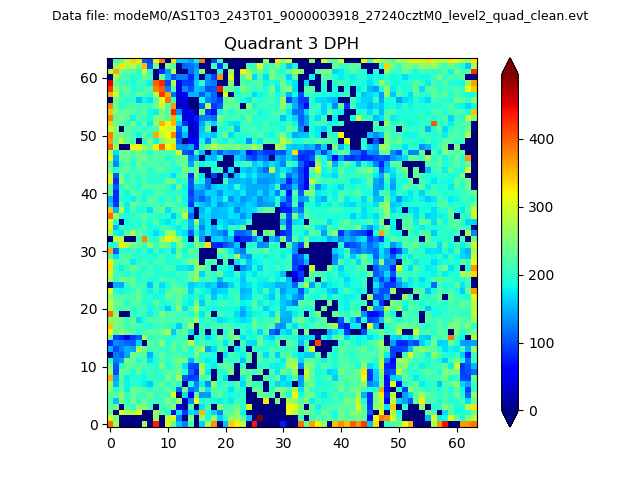 |
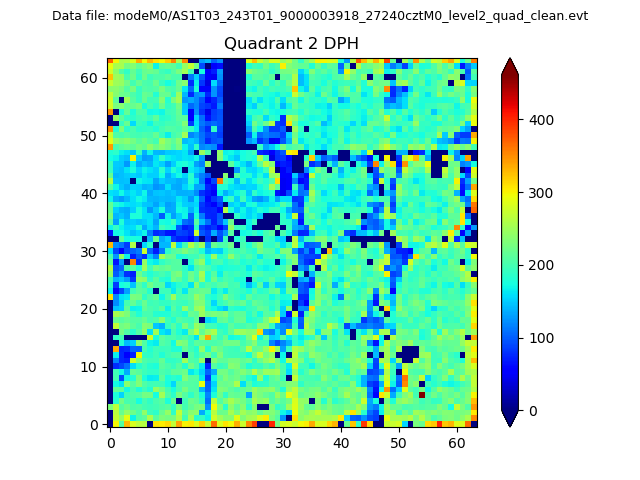 |
Quadrant C |
| Plot type | Count rate plots | Images |
|---|---|---|
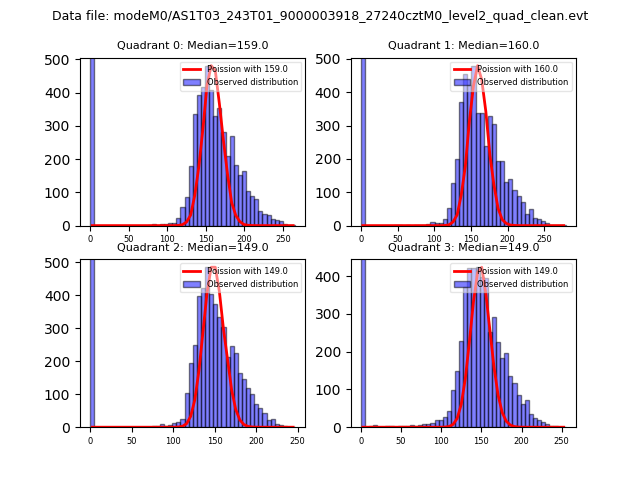
| Comparison with Poisson distribution Blue bars denote a histogram of data divided into 1 sec bins. Red curve is a Poisson curve with rate = median count rate of data. |
 |
 |
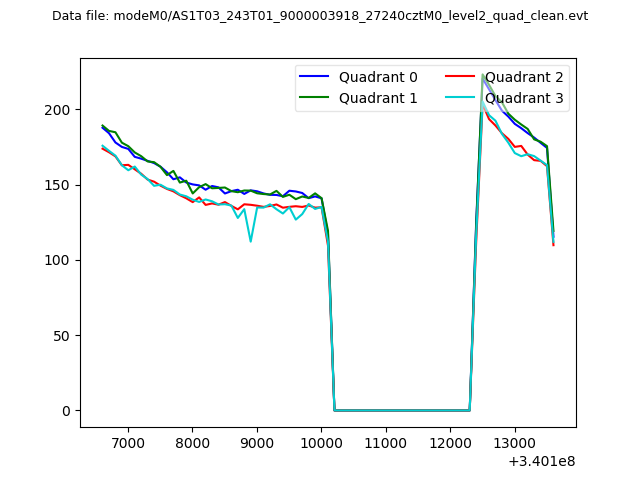
| Quadrant-wise count rates Data is divided into 100 sec bins |
 |
|
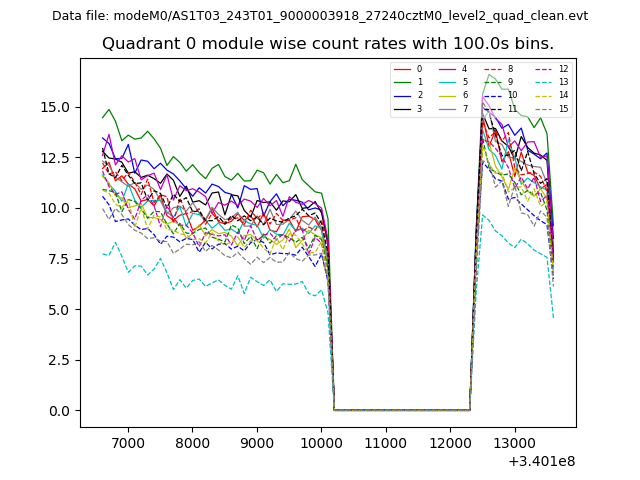
| Module-wise count rates for Quadrant A Data is divided into 100 sec bins |
 |
 |
| Module-wise count rates for Quadrant B Data is divided into 100 sec bins |
 |
 |
| Module-wise count rates for Quadrant C Data is divided into 100 sec bins |
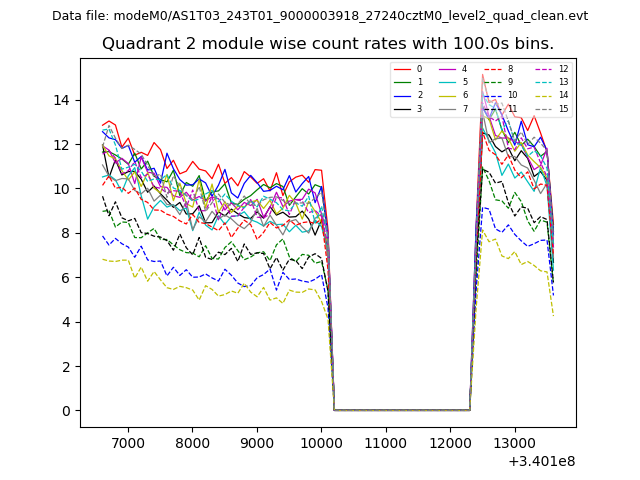 |
 |
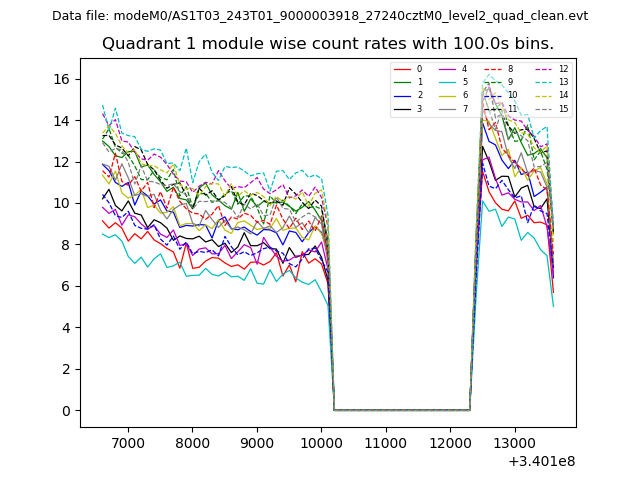
| Module-wise count rates for Quadrant D Data is divided into 100 sec bins |
 |
 |
| Parameter | Plot |
|---|---|
| CZT HV Monitor | 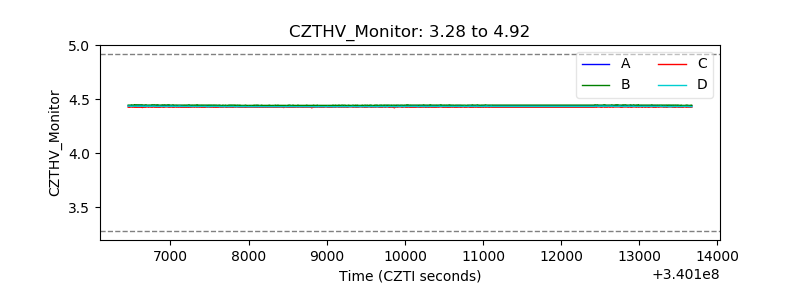 |
| D_VDD | 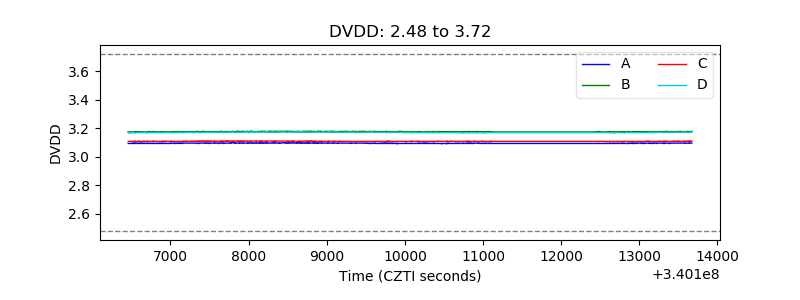 |
| Temperature 1 | 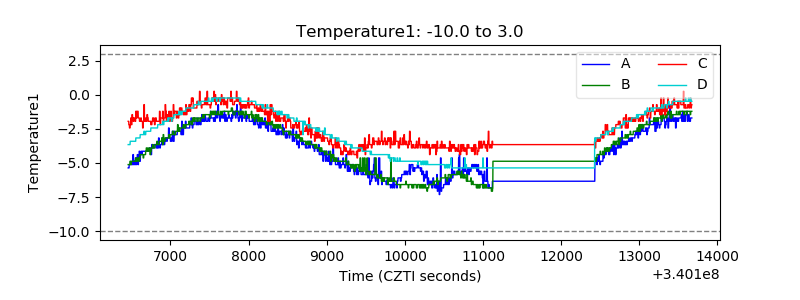 |
| Veto HV Monitor | 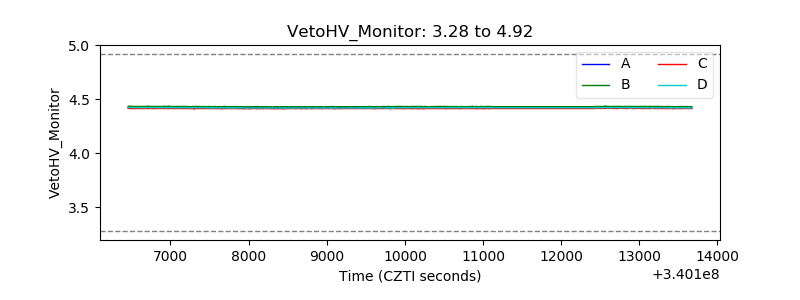 |
| Veto LLD | 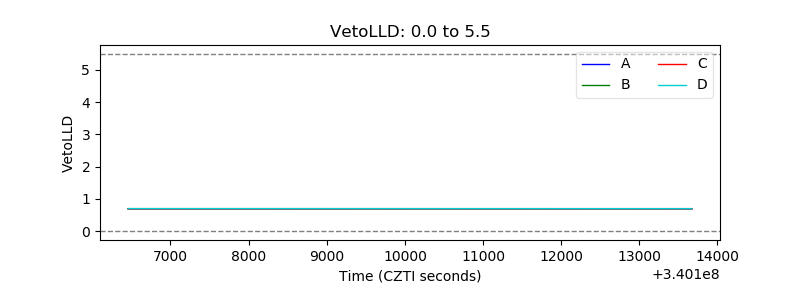 |
| Alpha Counter | 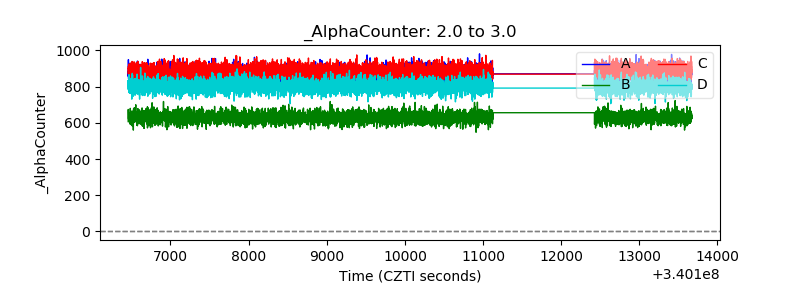 |
| _CPM_Rate | 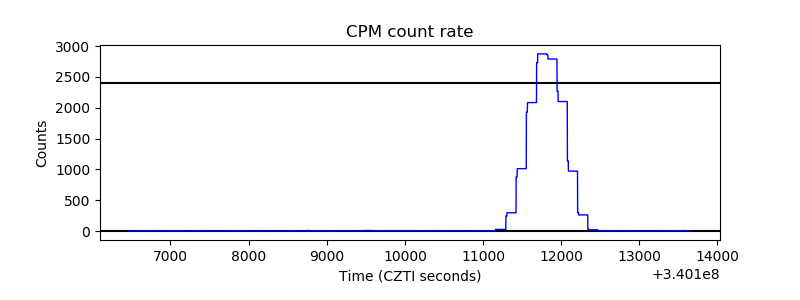 |
| CZT Counter | 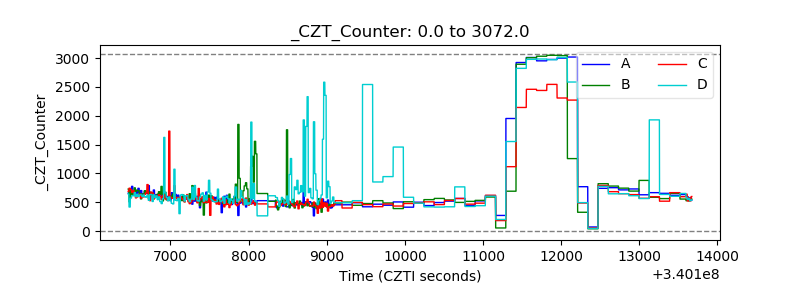 |
| +2.5 Volts monitor | 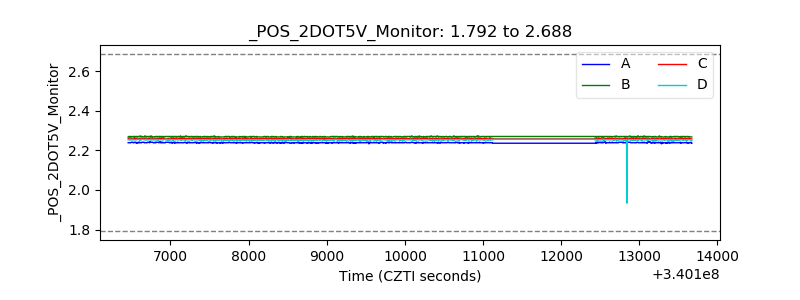 |
| +5 Volts monitor |  |
| _ROLL_ROT | 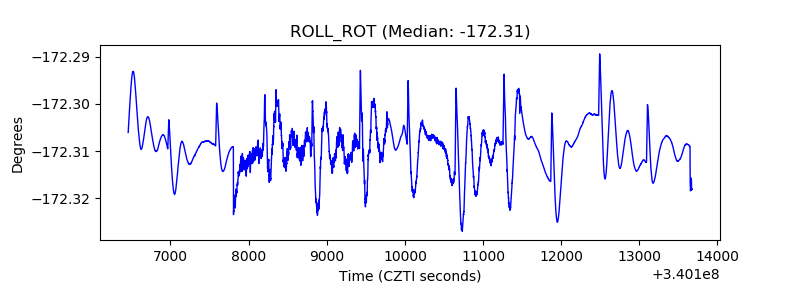 |
| _Roll_DEC | 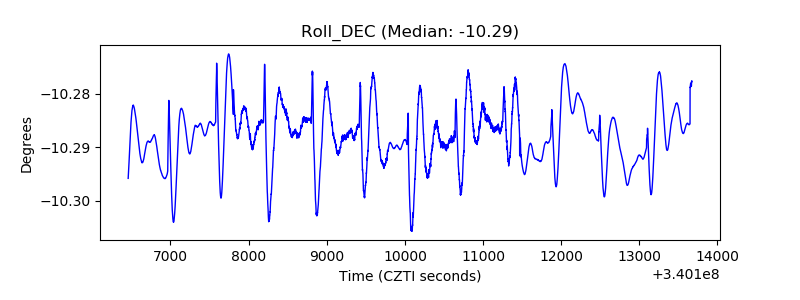 |
| _Roll_RA | 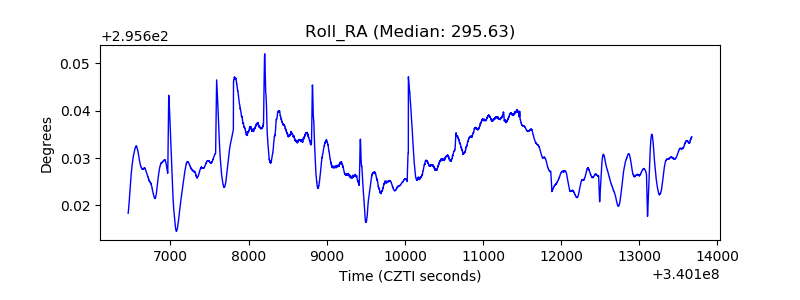 |
| Veto Counter | 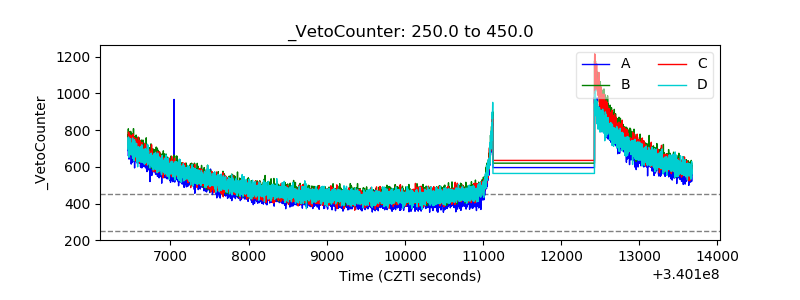 |