| Param | Original file | Final file |
|---|---|---|
| Filename | modeM0/AS1T03_243T01_9000003918_27243cztM0_level2.evt | modeM0/AS1T03_243T01_9000003918_27243cztM0_level2_quad_clean.evt |
| Size (bytes) | 541,863,360 | 100,840,320 |
| Size | 516.8 MB | 96.2 MB |
| Events in quadrant A | 3,444,577 | 673,962 |
| Events in quadrant B | 3,502,415 | 685,210 |
| Events in quadrant C | 3,389,124 | 636,811 |
| Events in quadrant D | 5,634,337 | 605,474 |
| Mode M9 | |||
|---|---|---|---|
| Quadrant | BADHDUFLAG | Total packets | Discarded packets |
| A | 0 | 16 | 0 |
| B | 0 | 17 | 0 |
| C | 0 | 17 | 0 |
| D | 0 | 17 | 0 |
| Mode M0 | |||
|---|---|---|---|
| Quadrant | BADHDUFLAG | Total packets | Discarded packets |
| A | 0 | 14303 | 0 |
| B | 0 | 14403 | 0 |
| C | 0 | 14012 | 0 |
| D | 0 | 21232 | 0 |
| Quadrant | Total seconds | Saturated seconds | Saturation percentage |
|---|---|---|---|
| A | 6485 | 117 | 1.804163% |
| B | 6485 | 122 | 1.881264% |
| C | 6485 | 153 | 2.359291% |
| D | 6485 | 534 | 8.234387% |
Noise dominated data is calculated using 1-second bins in cleaned event files. If a bin has >2000 counts, and if more than 50% of those come from <1% of pixels, then it is considered to be noise-dominated and hence unusable.
| Quadrant | # 1 sec bins | Bins with >0 counts | Bins with >2000 counts | High rate bins dominated by noise | Noise dominated (total time) | Noise dominated (detector-on time) | Marked lightcurve |
|---|---|---|---|---|---|---|---|
| A | 7715 | 6486 | 4 | 4 | 0.05% | 0.06% | 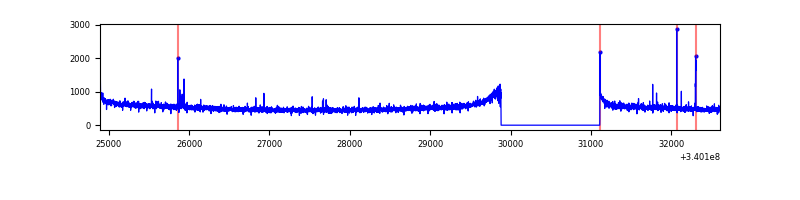 |
| B | 7715 | 6486 | 2 | 2 | 0.03% | 0.03% | 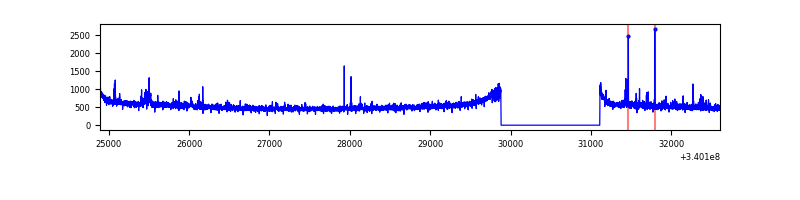 |
| C | 7715 | 6486 | 0 | 0 | 0.00% | 0.00% | 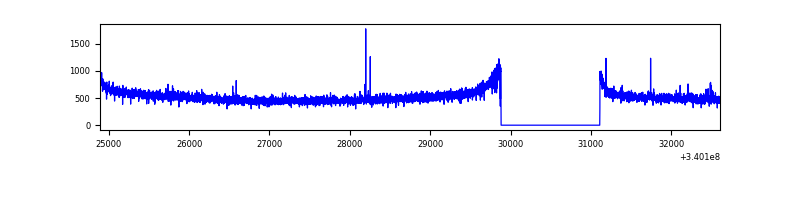 |
| D | 7715 | 6486 | 448 | 448 | 5.81% | 6.91% | 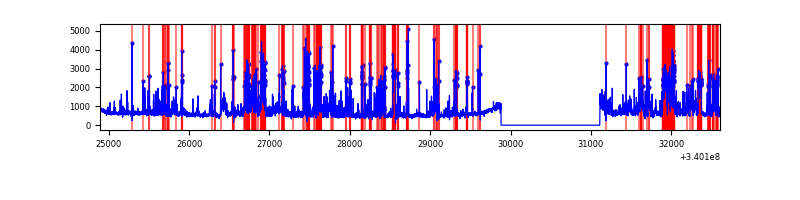 |
Top three noisy pixels from each quadrant. If the there are fewer than three noisy pixels in the level2.evt file, extra rows are filled as -1
| Pixel properties | Quadrant properties | ||||||
|---|---|---|---|---|---|---|---|
| Quadrant | DetID | PixID | Counts | Sigma | Mean | Median | Sigma |
| A | 15 | 174 | 15129 | 80.9 | 881 | 868 | 176.3 |
| A | 13 | 248 | 12680 | 67.0 | 881 | 868 | 176.3 |
| A | 8 | 192 | 11568 | 60.7 | 881 | 868 | 176.3 |
| B | 15 | 33 | 51827 | 312.07 | 871 | 851 | 163.3 |
| B | 12 | 111 | 19236 | 112.55 | 871 | 851 | 163.3 |
| B | 11 | 111 | 16938 | 98.48 | 871 | 851 | 163.3 |
| C | 14 | 238 | 133597 | 690.04 | 826 | 833 | 192.4 |
| C | 1 | 16 | 22475 | 112.48 | 826 | 833 | 192.4 |
| C | 15 | 208 | 8413 | 39.4 | 826 | 833 | 192.4 |
| D | 1 | 52 | 1955757 | 9296.79 | 818 | 803 | 210.3 |
| D | 15 | 0 | 276829 | 1312.64 | 818 | 803 | 210.3 |
| D | 7 | 38 | 141162 | 667.48 | 818 | 803 | 210.3 |
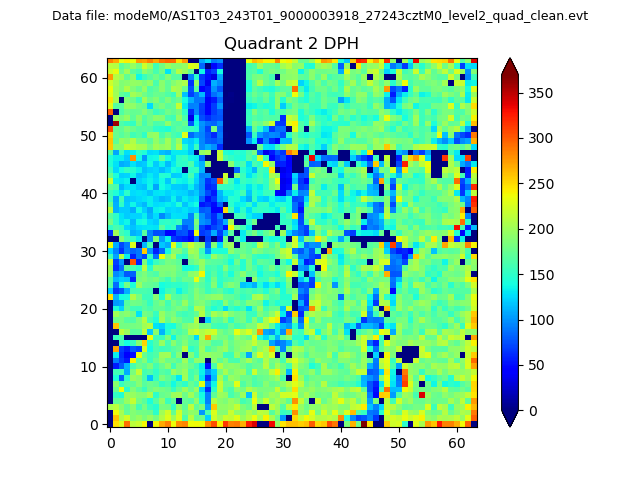
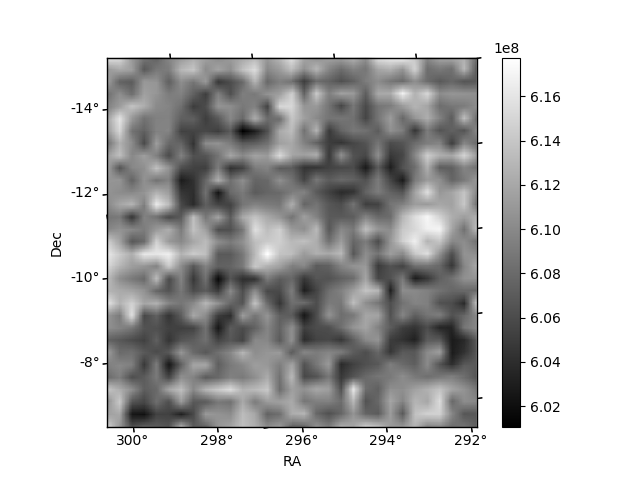
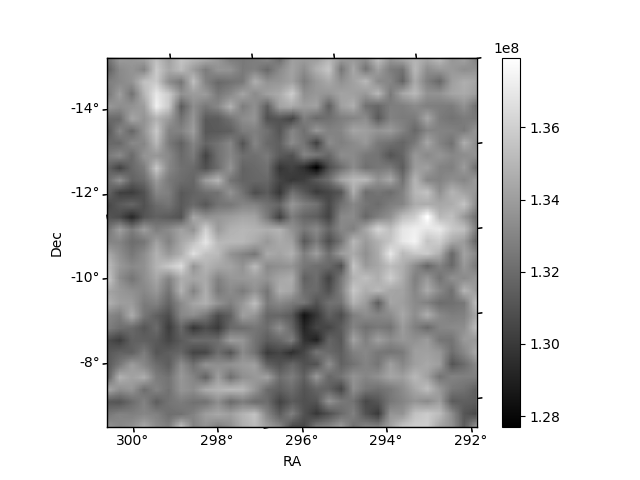
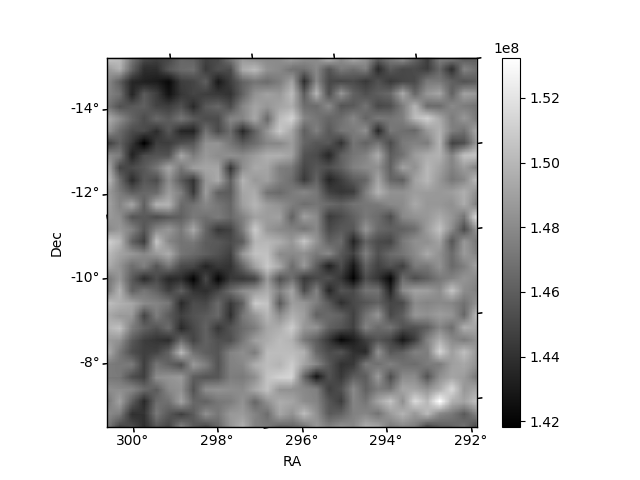
Histogram calculated using DETX and DETY for each event in the final _common_clean file
| Quadrant A | 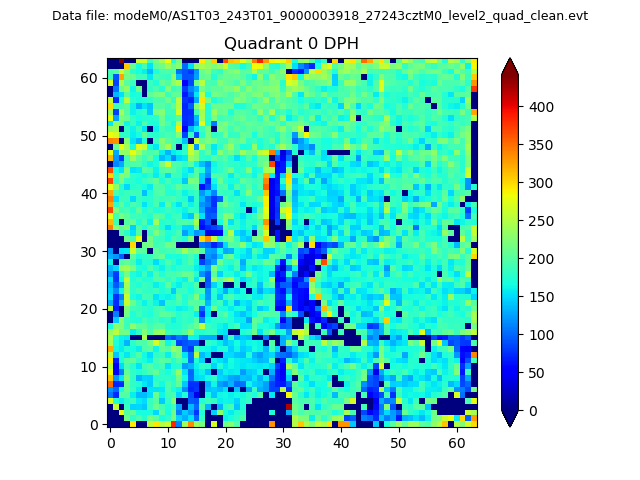 |
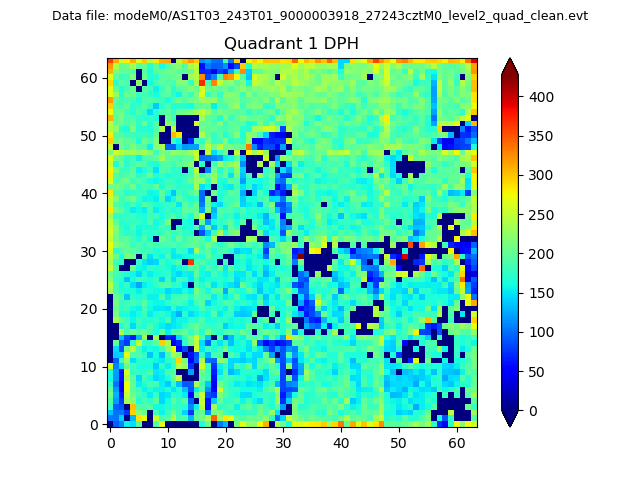 |
Quadrant B |
|---|---|---|---|
| Quadrant D | 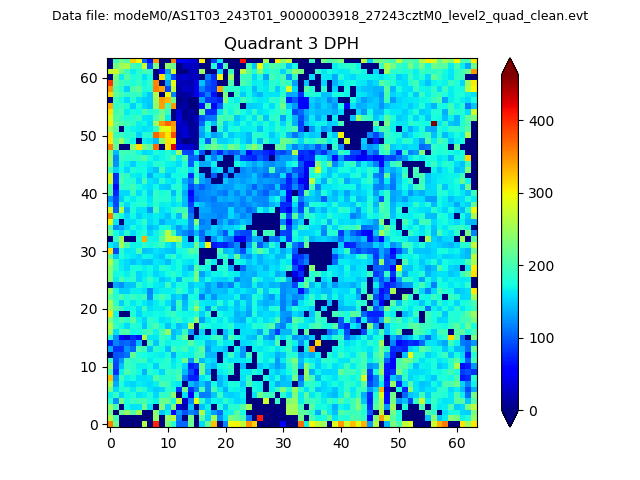 |
 |
Quadrant C |
| Plot type | Count rate plots | Images |
|---|---|---|
| Comparison with Poisson distribution Blue bars denote a histogram of data divided into 1 sec bins. Red curve is a Poisson curve with rate = median count rate of data. |
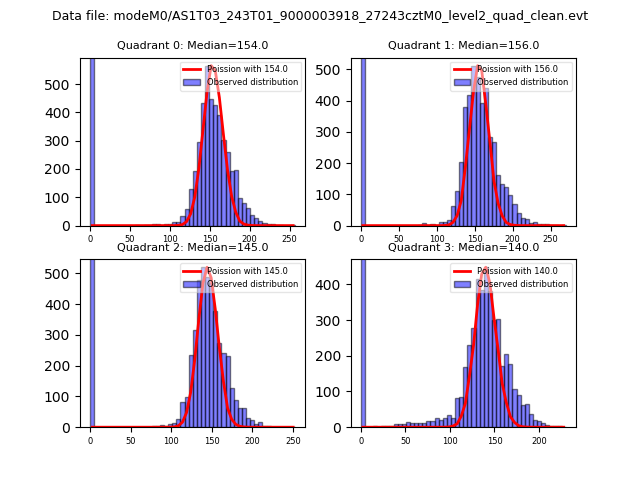 |
 |
| Quadrant-wise count rates Data is divided into 100 sec bins |
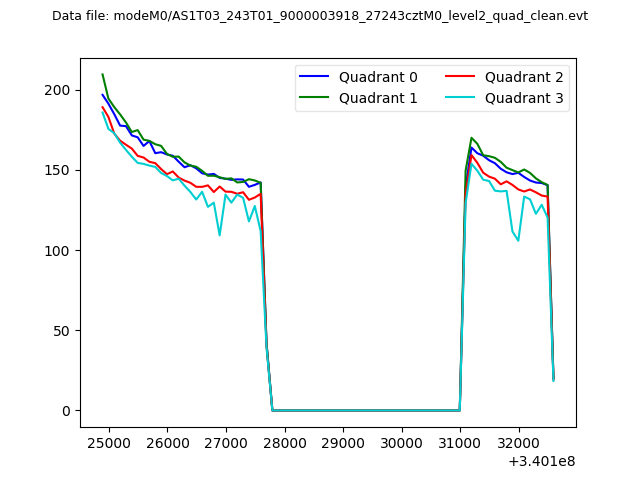 |
|
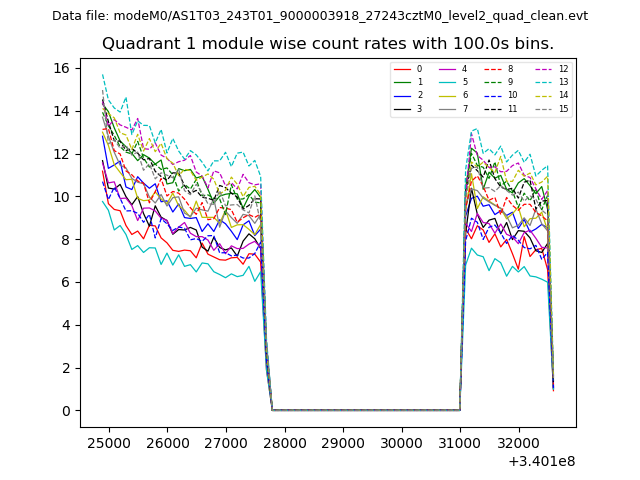
| Module-wise count rates for Quadrant A Data is divided into 100 sec bins |
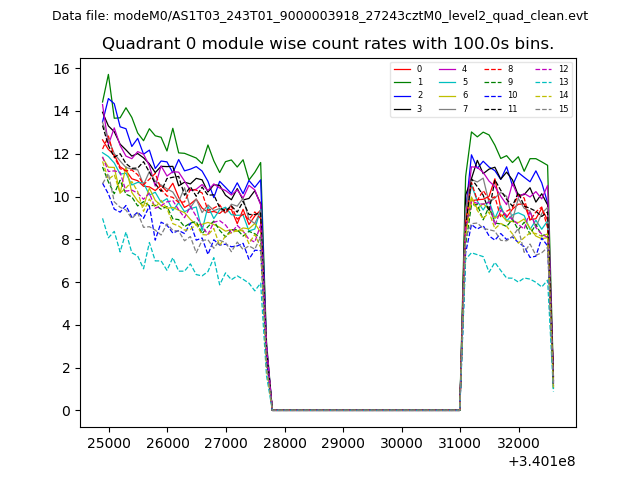 |
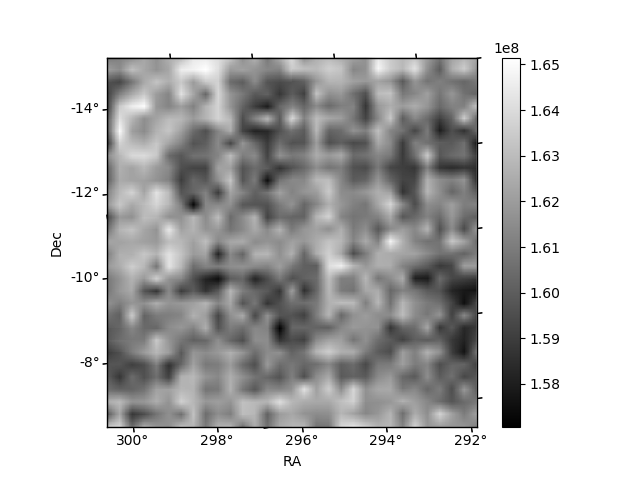 |
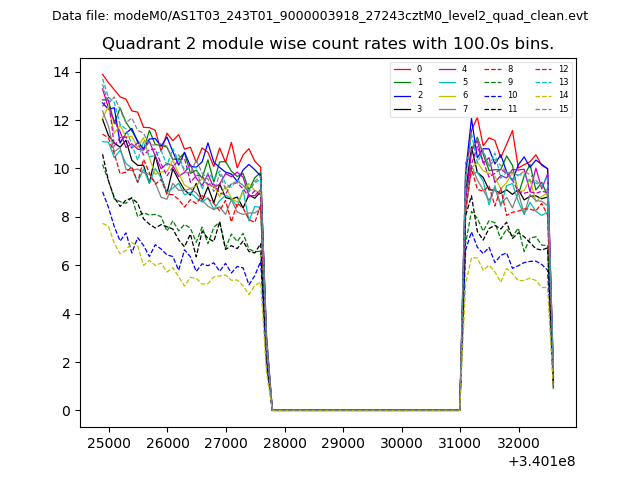
| Module-wise count rates for Quadrant B Data is divided into 100 sec bins |
 |
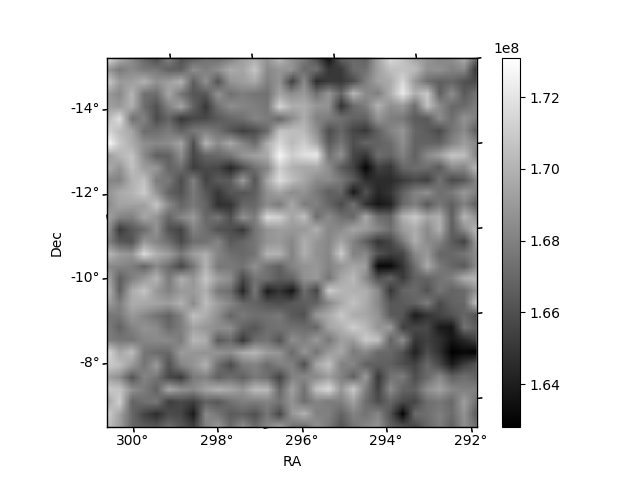 |
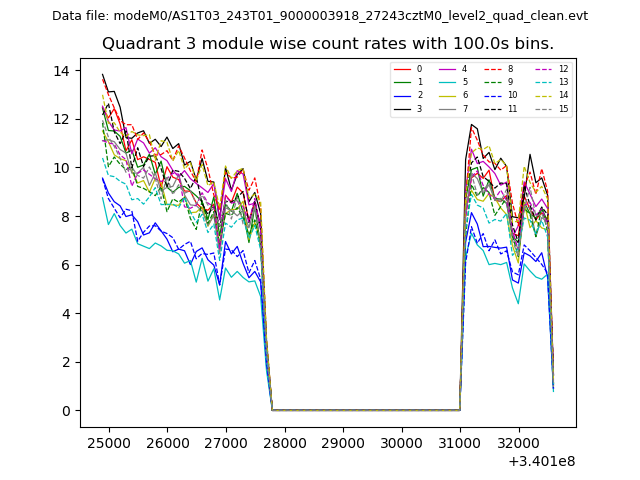
| Module-wise count rates for Quadrant C Data is divided into 100 sec bins |
 |
 |
| Module-wise count rates for Quadrant D Data is divided into 100 sec bins |
 |
 |
| Parameter | Plot |
|---|---|
| CZT HV Monitor | 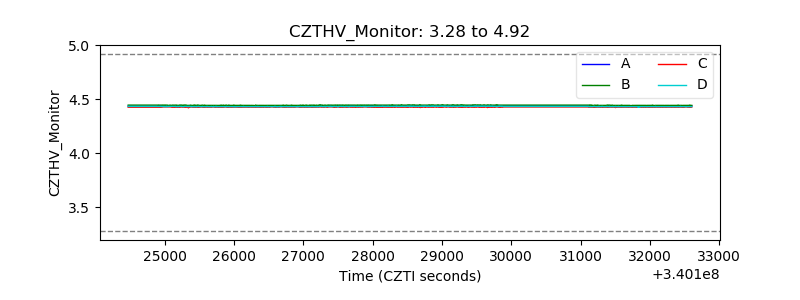 |
| D_VDD | 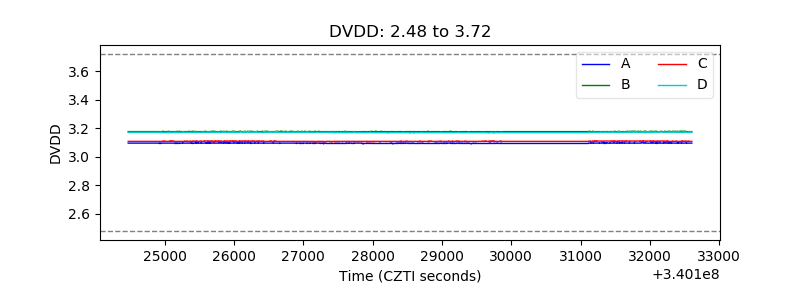 |
| Temperature 1 | 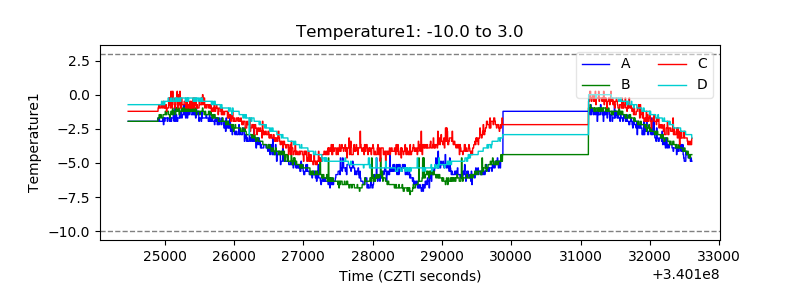 |
| Veto HV Monitor | 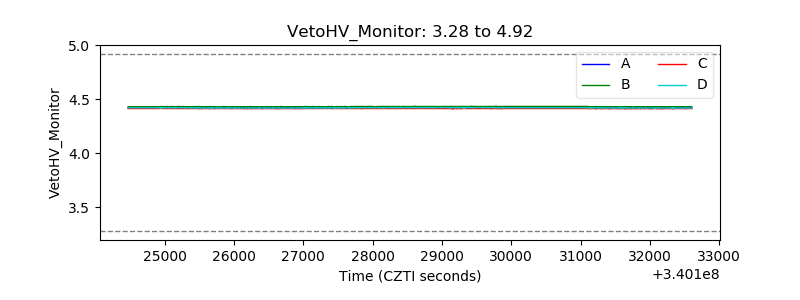 |
| Veto LLD | 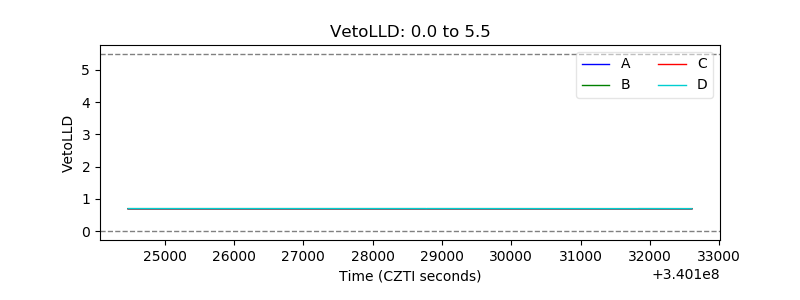 |
| Alpha Counter | 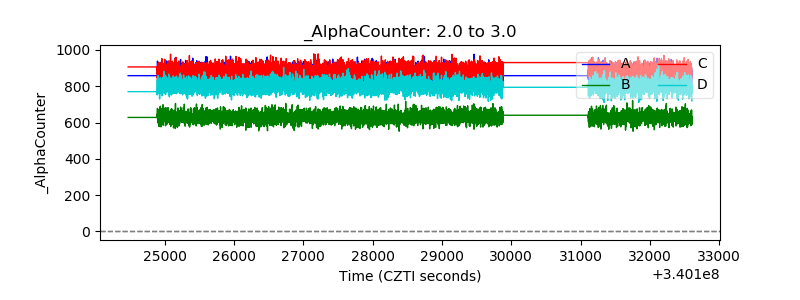 |
| _CPM_Rate | 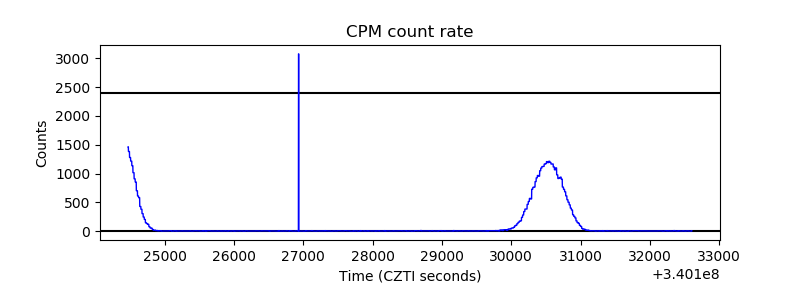 |
| CZT Counter | 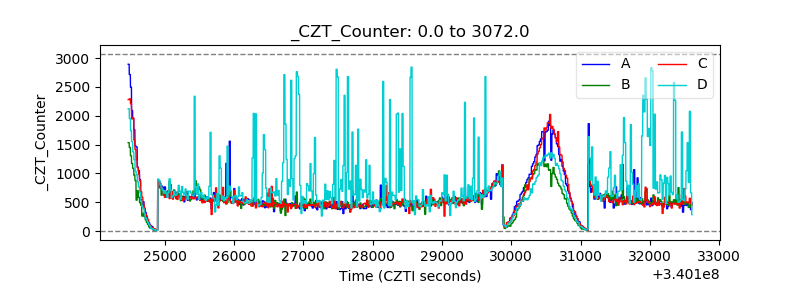 |
| +2.5 Volts monitor |  |
| +5 Volts monitor | 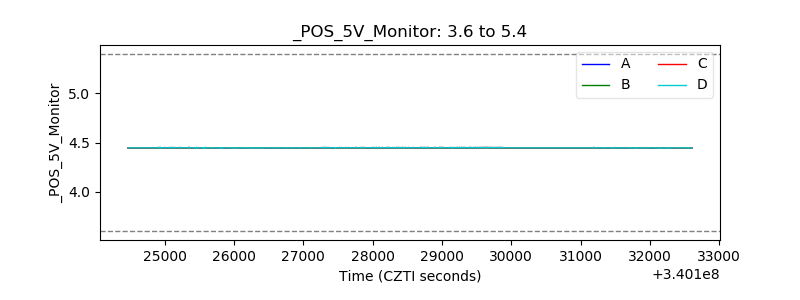 |
| _ROLL_ROT | 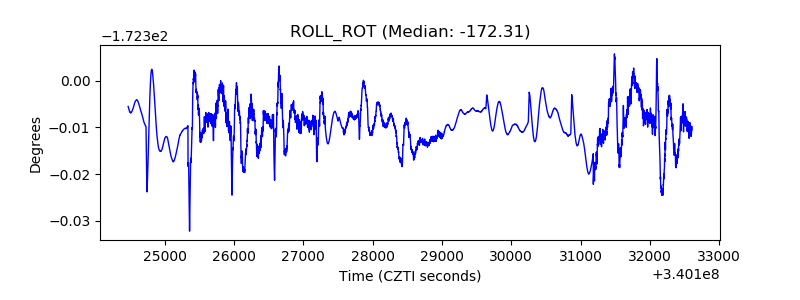 |
| _Roll_DEC | 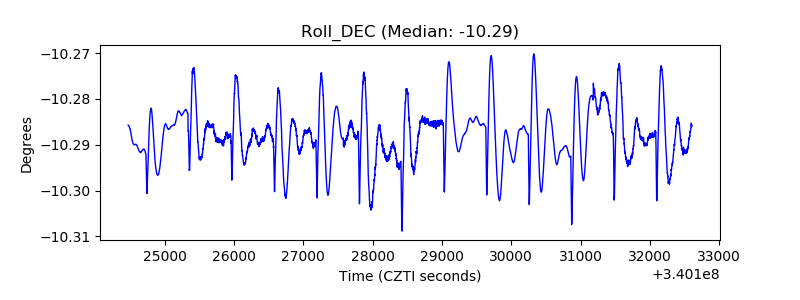 |
| _Roll_RA | 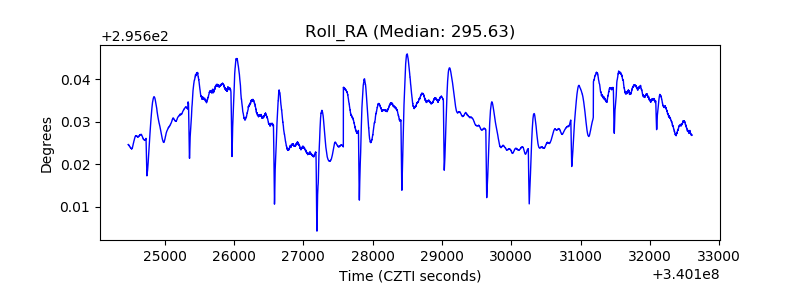 |
| Veto Counter | 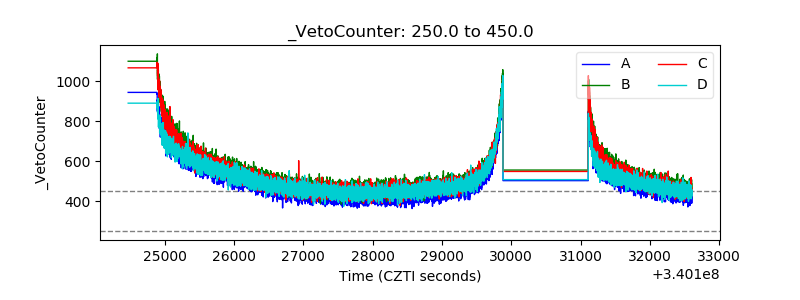 |