| Param | Original file | Final file |
|---|---|---|
| Filename | modeM0/AS1T03_243T01_9000003918_27244cztM0_level2.evt | modeM0/AS1T03_243T01_9000003918_27244cztM0_level2_quad_clean.evt |
| Size (bytes) | 590,394,240 | 96,511,680 |
| Size | 563.0 MB | 92.0 MB |
| Events in quadrant A | 3,513,769 | 638,809 |
| Events in quadrant B | 3,558,514 | 648,878 |
| Events in quadrant C | 3,398,011 | 611,531 |
| Events in quadrant D | 6,954,432 | 554,757 |
| Mode M9 | |||
|---|---|---|---|
| Quadrant | BADHDUFLAG | Total packets | Discarded packets |
| A | 0 | 15 | 0 |
| B | 0 | 16 | 0 |
| C | 0 | 16 | 0 |
| D | 0 | 16 | 0 |
| Mode M0 | |||
|---|---|---|---|
| Quadrant | BADHDUFLAG | Total packets | Discarded packets |
| A | 0 | 14716 | 0 |
| B | 0 | 14737 | 0 |
| C | 0 | 14279 | 0 |
| D | 0 | 25181 | 0 |
| Quadrant | Total seconds | Saturated seconds | Saturation percentage |
|---|---|---|---|
| A | 6715 | 94 | 1.399851% |
| B | 6715 | 139 | 2.069993% |
| C | 6715 | 101 | 1.504095% |
| D | 6715 | 1118 | 16.649293% |
Noise dominated data is calculated using 1-second bins in cleaned event files. If a bin has >2000 counts, and if more than 50% of those come from <1% of pixels, then it is considered to be noise-dominated and hence unusable.
| Quadrant | # 1 sec bins | Bins with >0 counts | Bins with >2000 counts | High rate bins dominated by noise | Noise dominated (total time) | Noise dominated (detector-on time) | Marked lightcurve |
|---|---|---|---|---|---|---|---|
| A | 7685 | 6716 | 19 | 19 | 0.25% | 0.28% | 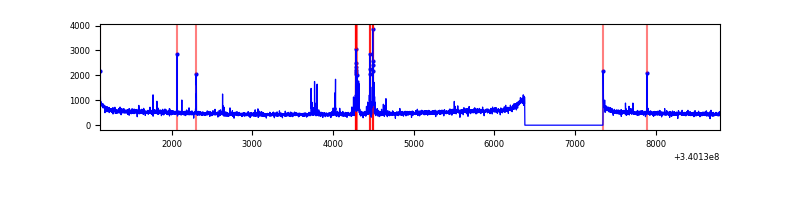 |
| B | 7685 | 6716 | 10 | 10 | 0.13% | 0.15% | 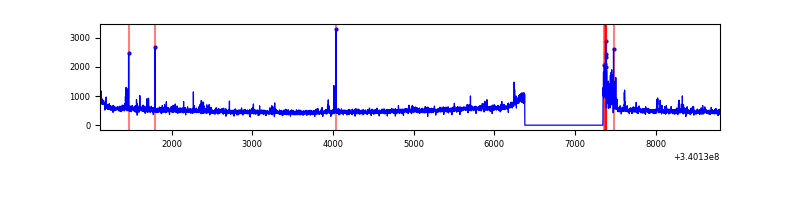 |
| C | 7685 | 6716 | 0 | 0 | 0.00% | 0.00% | 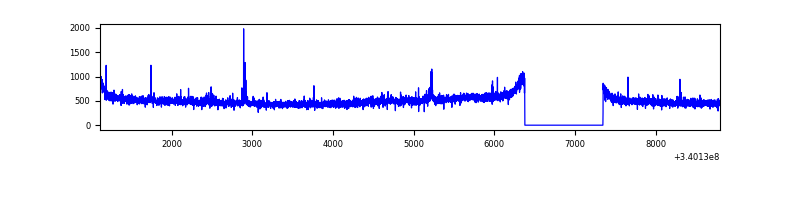 |
| D | 7685 | 6716 | 1174 | 1174 | 15.28% | 17.48% | 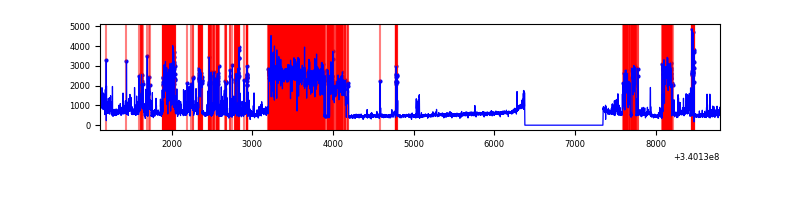 |
Top three noisy pixels from each quadrant. If the there are fewer than three noisy pixels in the level2.evt file, extra rows are filled as -1
| Pixel properties | Quadrant properties | ||||||
|---|---|---|---|---|---|---|---|
| Quadrant | DetID | PixID | Counts | Sigma | Mean | Median | Sigma |
| A | 14 | 235 | 141003 | 807.49 | 865 | 851 | 173.6 |
| A | 13 | 248 | 19681 | 108.49 | 865 | 851 | 173.6 |
| A | 8 | 192 | 11919 | 63.77 | 865 | 851 | 173.6 |
| B | 15 | 33 | 116517 | 708.44 | 860 | 840 | 163.3 |
| B | 0 | 245 | 25970 | 153.9 | 860 | 840 | 163.3 |
| B | 5 | 172 | 24033 | 142.04 | 860 | 840 | 163.3 |
| C | 14 | 238 | 131217 | 676.65 | 820 | 825 | 192.7 |
| C | 1 | 16 | 41238 | 209.72 | 820 | 825 | 192.7 |
| C | 15 | 208 | 20701 | 103.14 | 820 | 825 | 192.7 |
| D | 1 | 52 | 3233062 | 15794.63 | 788 | 768 | 204.6 |
| D | 15 | 0 | 332008 | 1618.61 | 788 | 768 | 204.6 |
| D | 2 | 250 | 172087 | 837.15 | 788 | 768 | 204.6 |
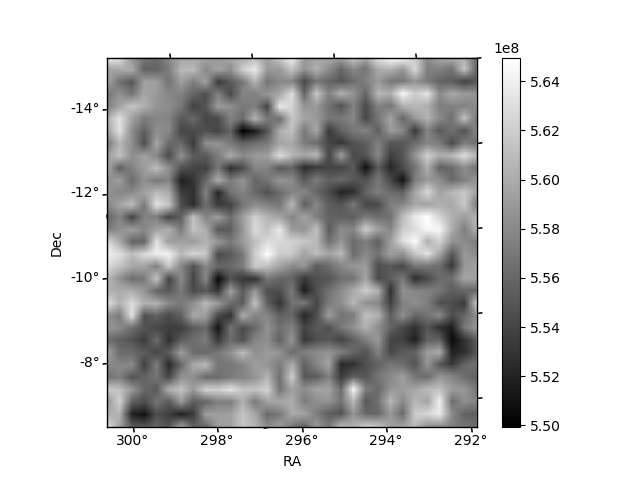
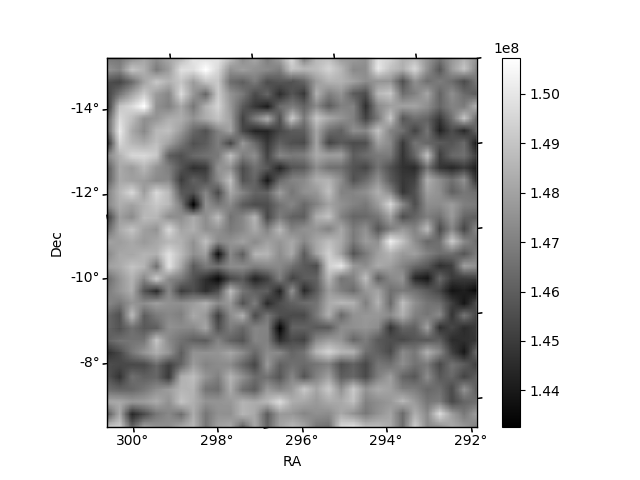
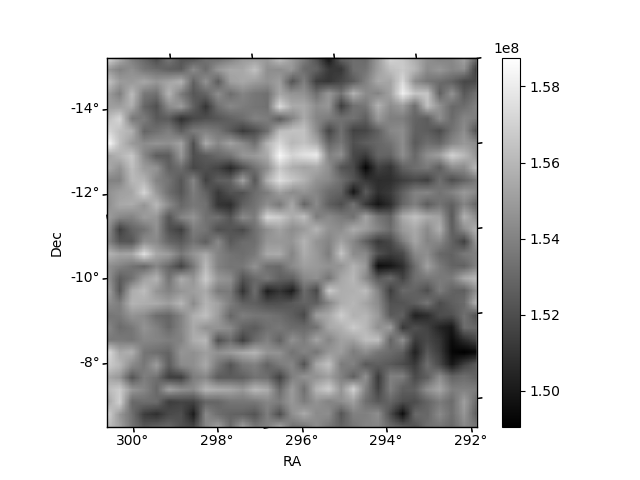
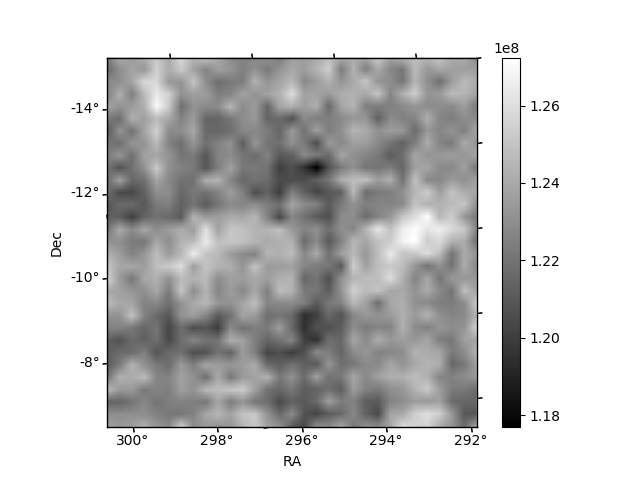
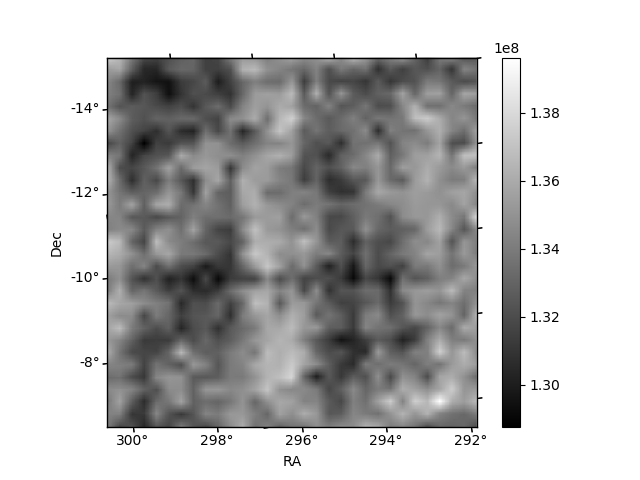
Histogram calculated using DETX and DETY for each event in the final _common_clean file
| Quadrant A | 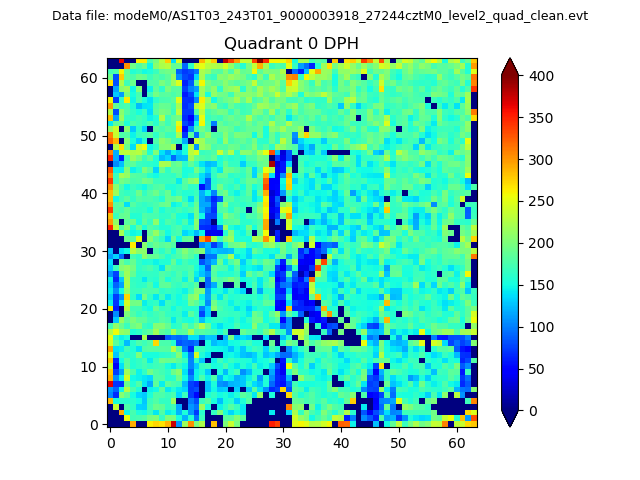 |
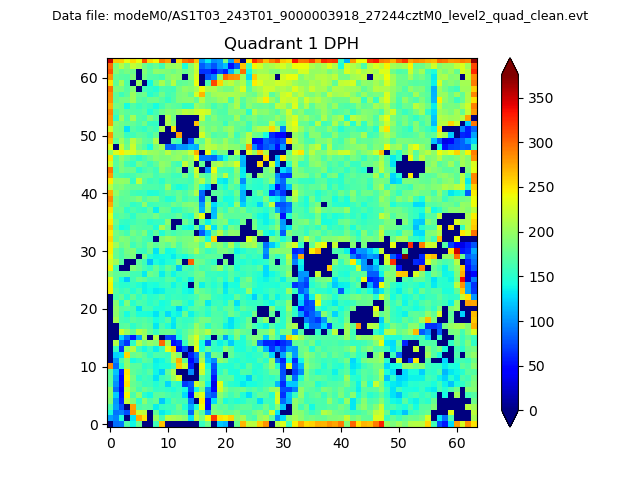 |
Quadrant B |
|---|---|---|---|
| Quadrant D | 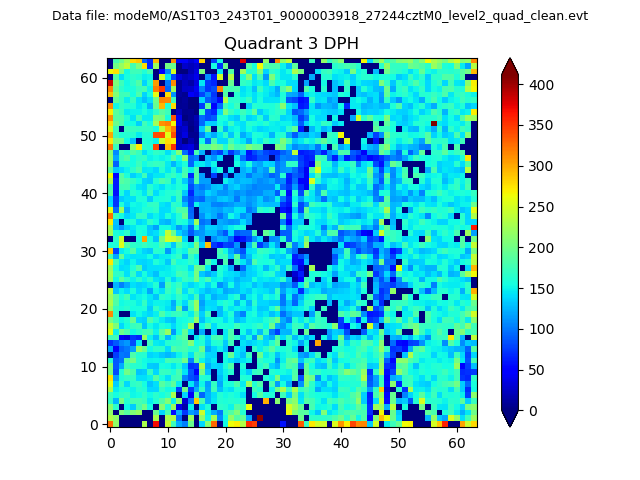 |
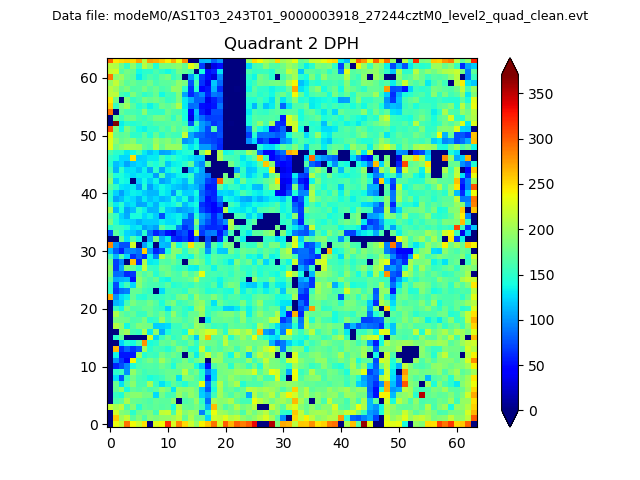 |
Quadrant C |
| Plot type | Count rate plots | Images |
|---|---|---|
| Comparison with Poisson distribution Blue bars denote a histogram of data divided into 1 sec bins. Red curve is a Poisson curve with rate = median count rate of data. |
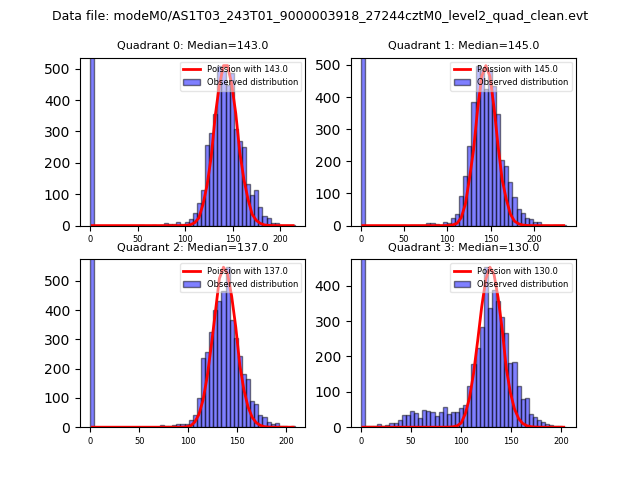 |
 |
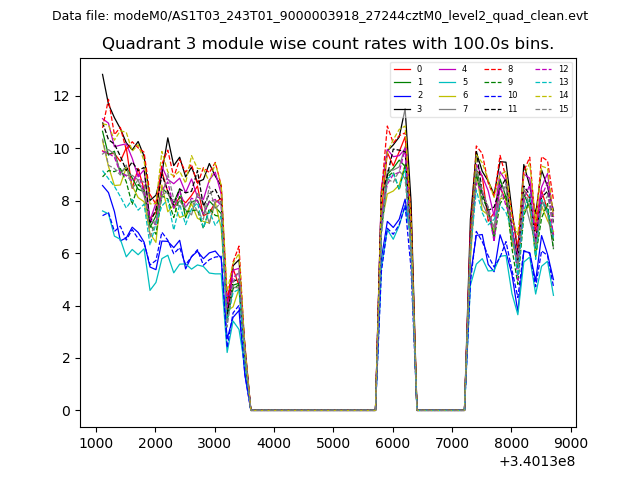
| Quadrant-wise count rates Data is divided into 100 sec bins |
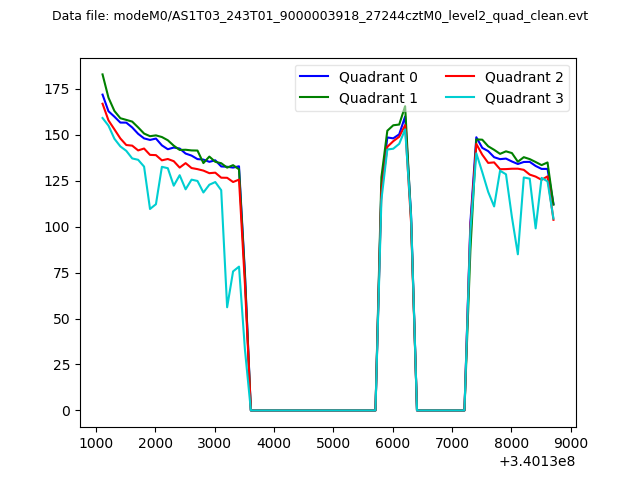 |
|
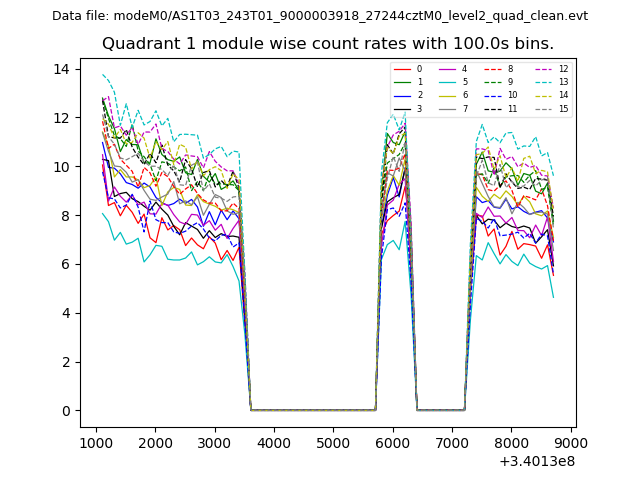
| Module-wise count rates for Quadrant A Data is divided into 100 sec bins |
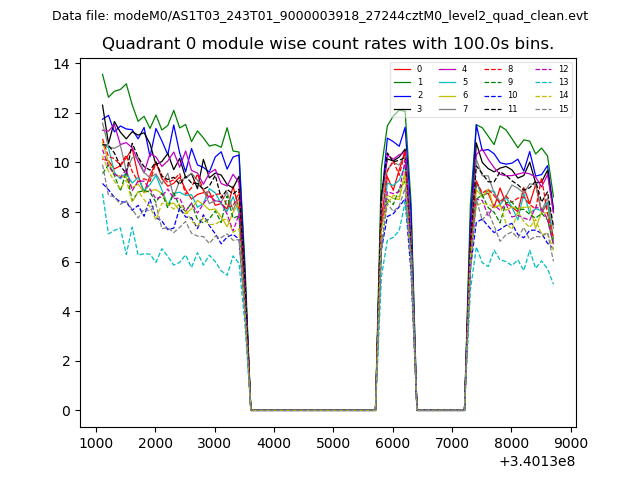 |
 |
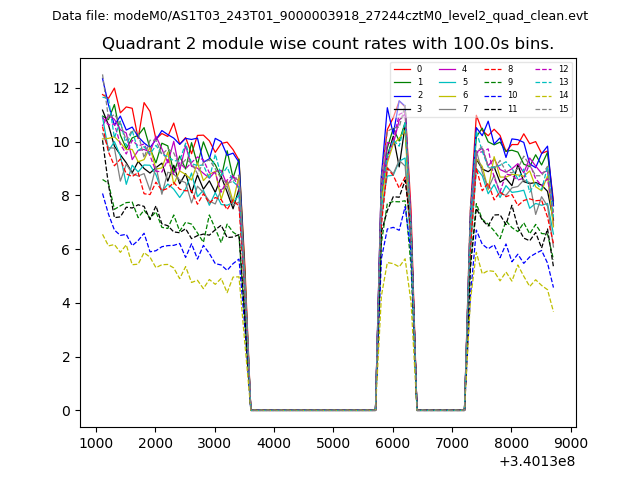
| Module-wise count rates for Quadrant B Data is divided into 100 sec bins |
 |
 |
| Module-wise count rates for Quadrant C Data is divided into 100 sec bins |
 |
 |
| Module-wise count rates for Quadrant D Data is divided into 100 sec bins |
 |
 |
| Parameter | Plot |
|---|---|
| CZT HV Monitor | 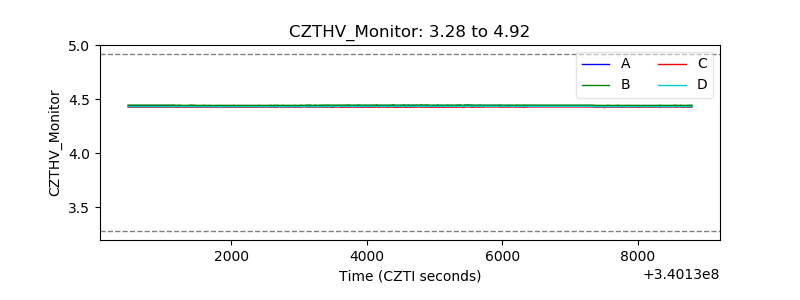 |
| D_VDD | 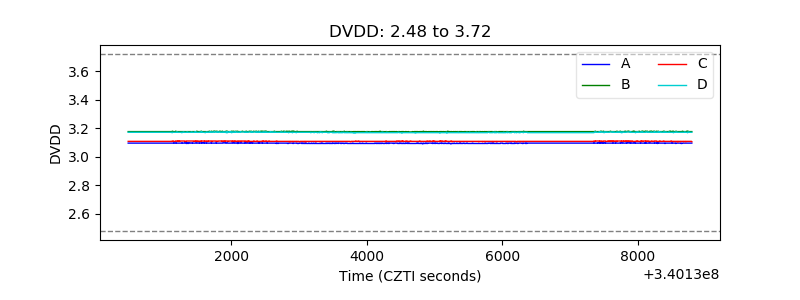 |
| Temperature 1 | 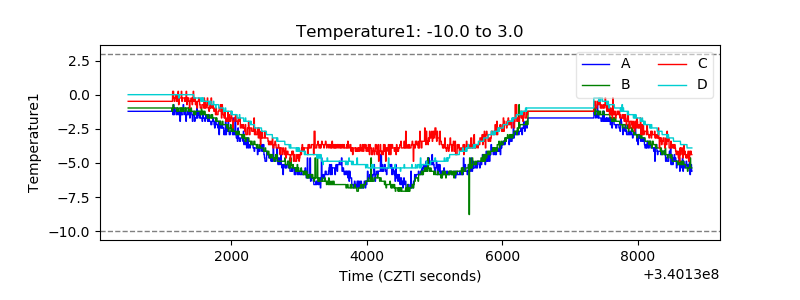 |
| Veto HV Monitor | 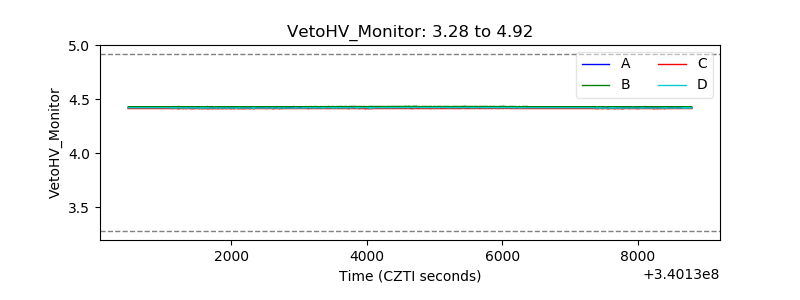 |
| Veto LLD | 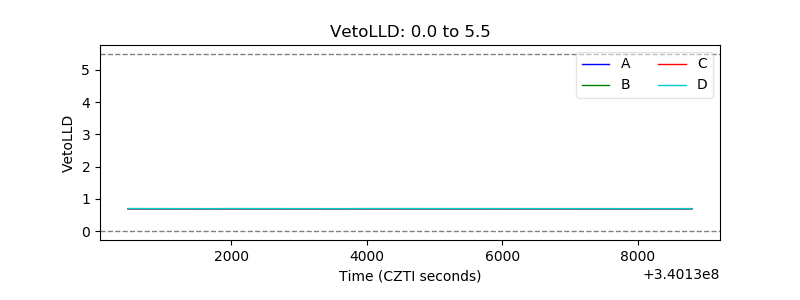 |
| Alpha Counter | 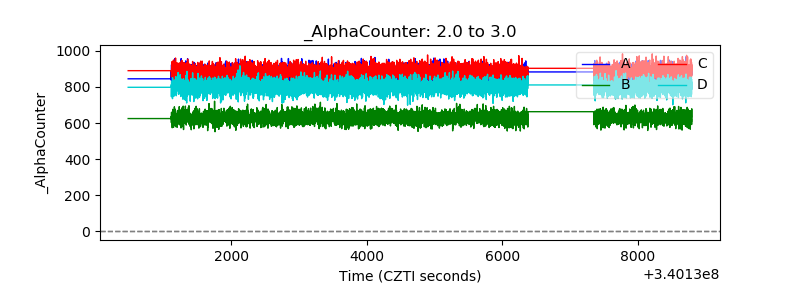 |
| _CPM_Rate | 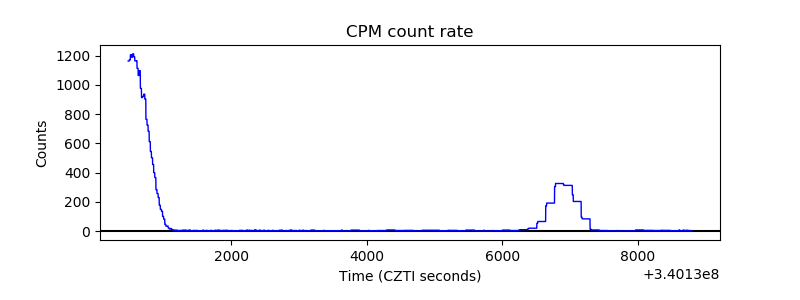 |
| CZT Counter | 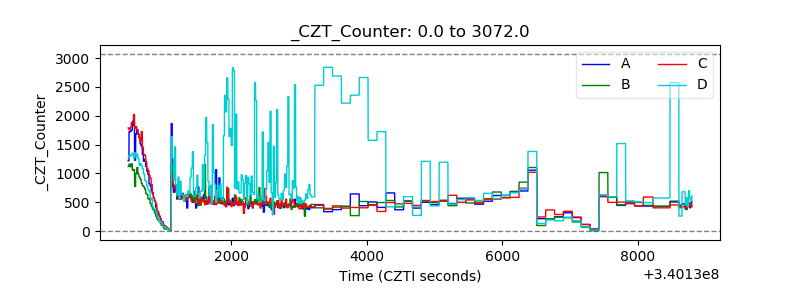 |
| +2.5 Volts monitor |  |
| +5 Volts monitor |  |
| _ROLL_ROT | 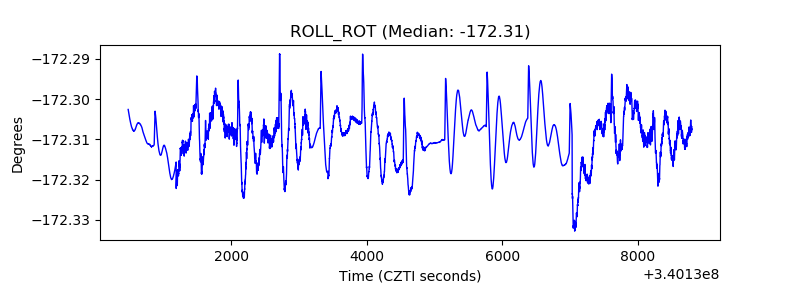 |
| _Roll_DEC | 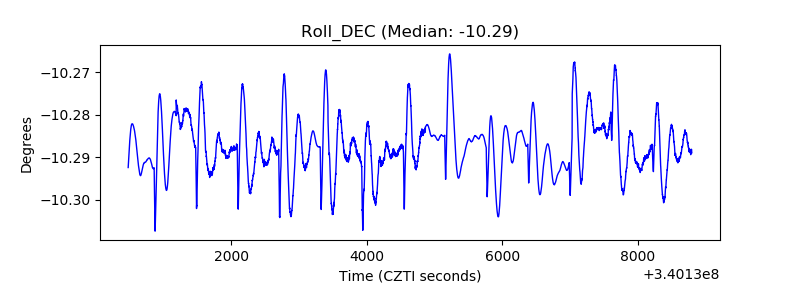 |
| _Roll_RA | 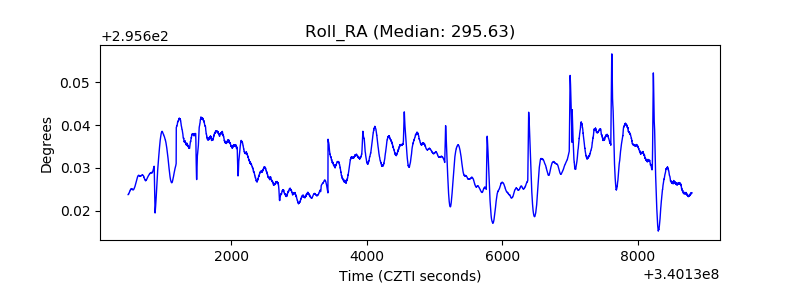 |
| Veto Counter | 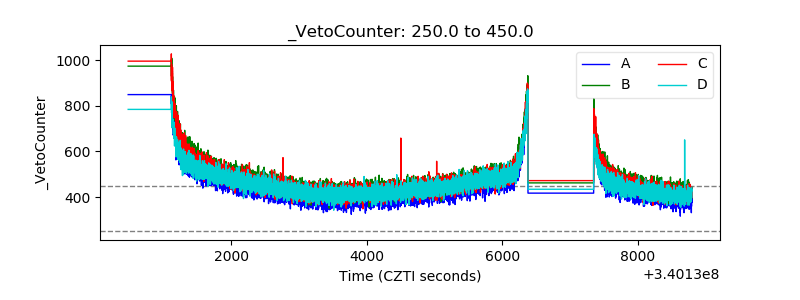 |