| Param | Original file | Final file |
|---|---|---|
| Filename | modeM0/AS1T03_243T01_9000003918_27245cztM0_level2.evt | modeM0/AS1T03_243T01_9000003918_27245cztM0_level2_quad_clean.evt |
| Size (bytes) | 517,518,720 | 100,621,440 |
| Size | 493.5 MB | 96.0 MB |
| Events in quadrant A | 3,435,927 | 655,875 |
| Events in quadrant B | 3,660,279 | 661,416 |
| Events in quadrant C | 3,453,855 | 631,832 |
| Events in quadrant D | 4,642,389 | 605,132 |
| Mode M9 | |||
|---|---|---|---|
| Quadrant | BADHDUFLAG | Total packets | Discarded packets |
| A | 0 | 6 | 0 |
| B | 0 | 7 | 0 |
| C | 0 | 7 | 0 |
| D | 0 | 7 | 0 |
| Mode M0 | |||
|---|---|---|---|
| Quadrant | BADHDUFLAG | Total packets | Discarded packets |
| A | 0 | 14770 | 0 |
| B | 0 | 15269 | 0 |
| C | 0 | 14775 | 0 |
| D | 0 | 18498 | 0 |
| Quadrant | Total seconds | Saturated seconds | Saturation percentage |
|---|---|---|---|
| A | 7077 | 52 | 0.734775% |
| B | 7077 | 160 | 2.260845% |
| C | 7077 | 112 | 1.582591% |
| D | 7077 | 295 | 4.168433% |
Noise dominated data is calculated using 1-second bins in cleaned event files. If a bin has >2000 counts, and if more than 50% of those come from <1% of pixels, then it is considered to be noise-dominated and hence unusable.
| Quadrant | # 1 sec bins | Bins with >0 counts | Bins with >2000 counts | High rate bins dominated by noise | Noise dominated (total time) | Noise dominated (detector-on time) | Marked lightcurve |
|---|---|---|---|---|---|---|---|
| A | 7597 | 7079 | 2 | 2 | 0.03% | 0.03% |  |
| B | 7597 | 7079 | 12 | 12 | 0.16% | 0.17% |  |
| C | 7597 | 7079 | 5 | 5 | 0.07% | 0.07% |  |
| D | 7597 | 7079 | 249 | 249 | 3.28% | 3.52% |  |
Top three noisy pixels from each quadrant. If the there are fewer than three noisy pixels in the level2.evt file, extra rows are filled as -1
| Pixel properties | Quadrant properties | ||||||
|---|---|---|---|---|---|---|---|
| Quadrant | DetID | PixID | Counts | Sigma | Mean | Median | Sigma |
| A | 13 | 248 | 19793 | 106.33 | 882 | 865 | 178.0 |
| A | 8 | 192 | 12205 | 63.7 | 882 | 865 | 178.0 |
| A | 13 | 254 | 11116 | 57.58 | 882 | 865 | 178.0 |
| B | 15 | 33 | 155759 | 925.79 | 875 | 855 | 167.3 |
| B | 0 | 245 | 20447 | 117.09 | 875 | 855 | 167.3 |
| B | 12 | 111 | 20133 | 115.22 | 875 | 855 | 167.3 |
| C | 14 | 238 | 135152 | 681.18 | 838 | 841 | 197.2 |
| C | 15 | 208 | 43505 | 216.38 | 838 | 841 | 197.2 |
| C | 13 | 61 | 5832 | 25.31 | 838 | 841 | 197.2 |
| D | 1 | 52 | 1051553 | 4896.09 | 830 | 812 | 214.6 |
| D | 2 | 250 | 225913 | 1048.89 | 830 | 812 | 214.6 |
| D | 7 | 38 | 78074 | 360.01 | 830 | 812 | 214.6 |
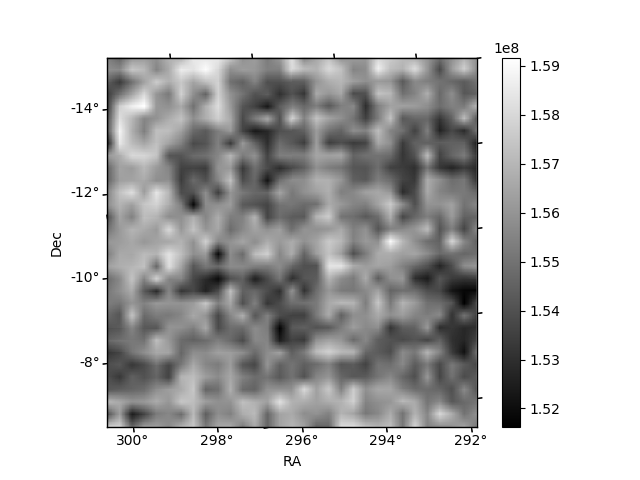
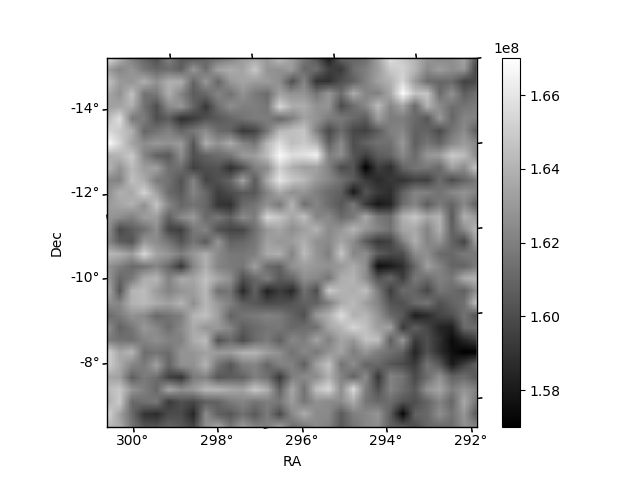
Histogram calculated using DETX and DETY for each event in the final _common_clean file
| Quadrant A | 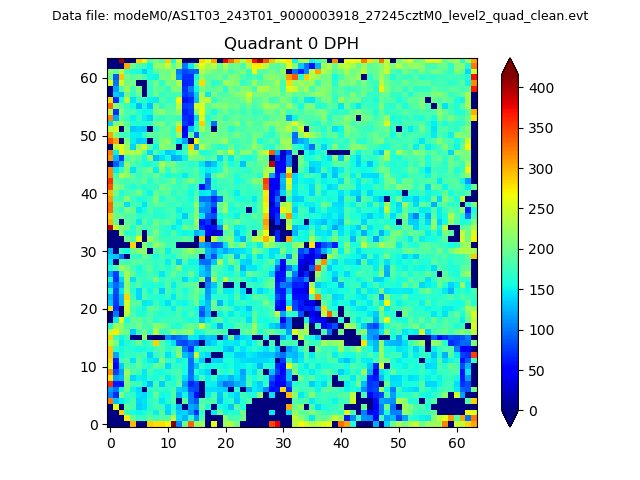 |
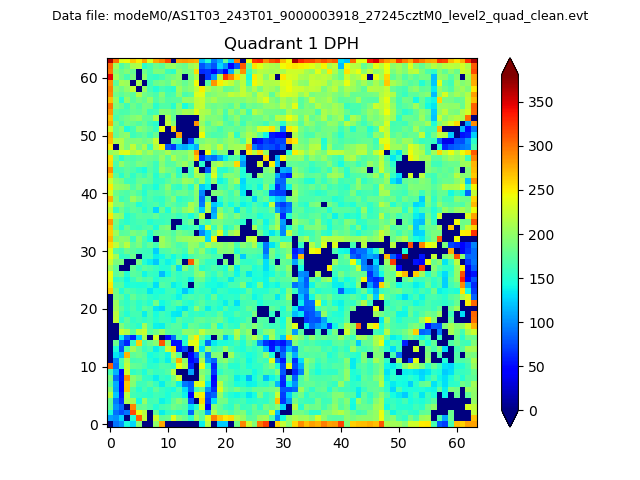 |
Quadrant B |
|---|---|---|---|
| Quadrant D | 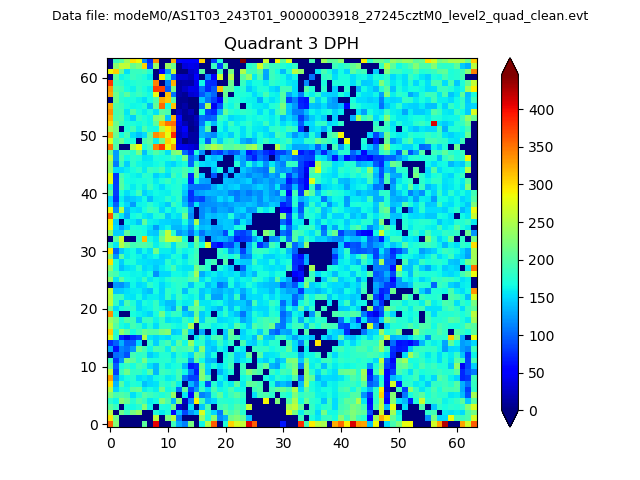 |
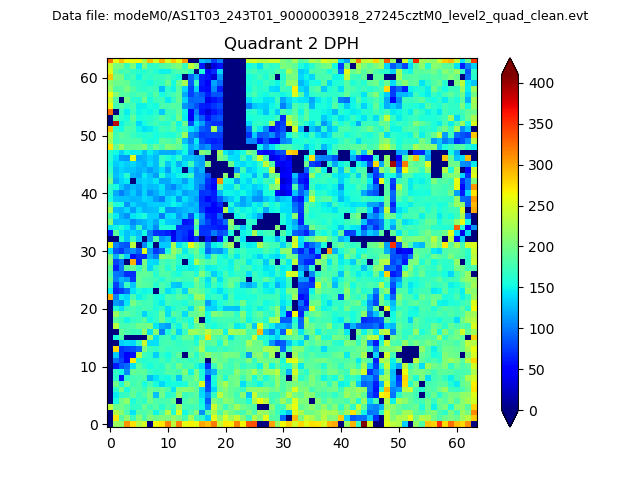 |
Quadrant C |
| Plot type | Count rate plots | Images |
|---|---|---|
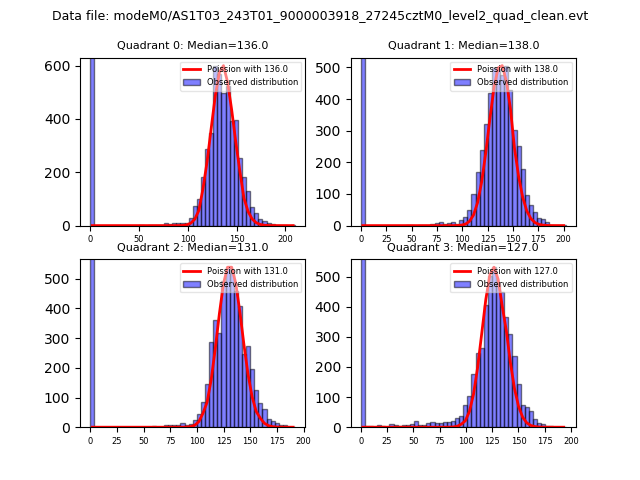
| Comparison with Poisson distribution Blue bars denote a histogram of data divided into 1 sec bins. Red curve is a Poisson curve with rate = median count rate of data. |
 |
 |
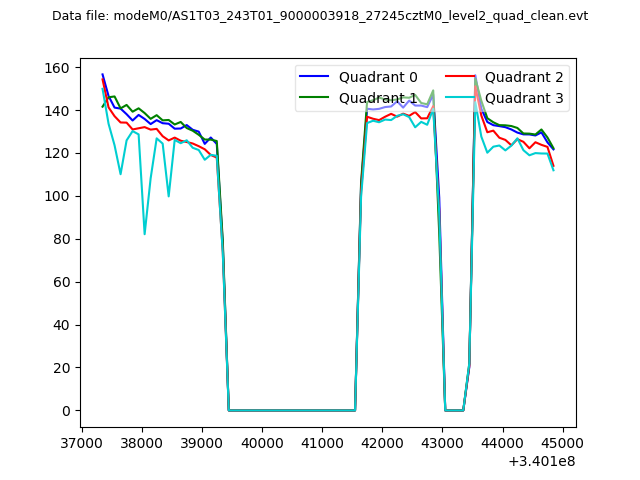
| Quadrant-wise count rates Data is divided into 100 sec bins |
 |
|
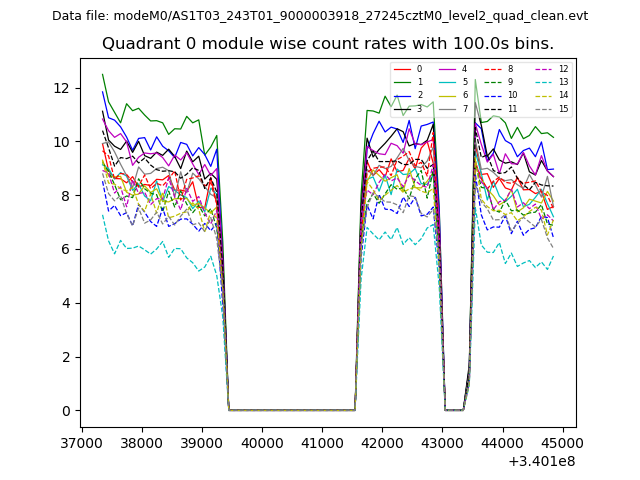
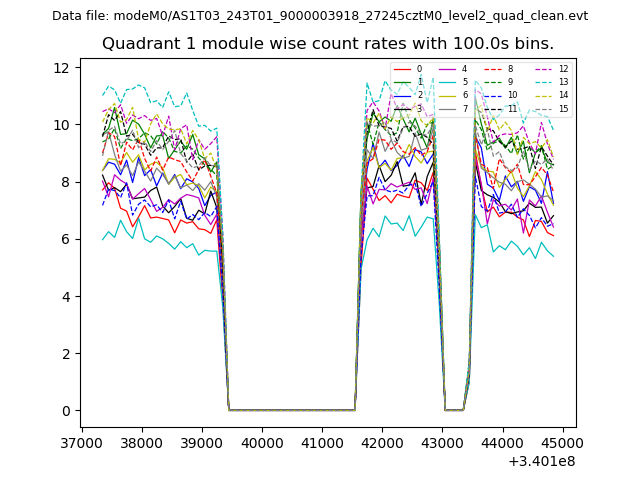
| Module-wise count rates for Quadrant A Data is divided into 100 sec bins |
 |
 |
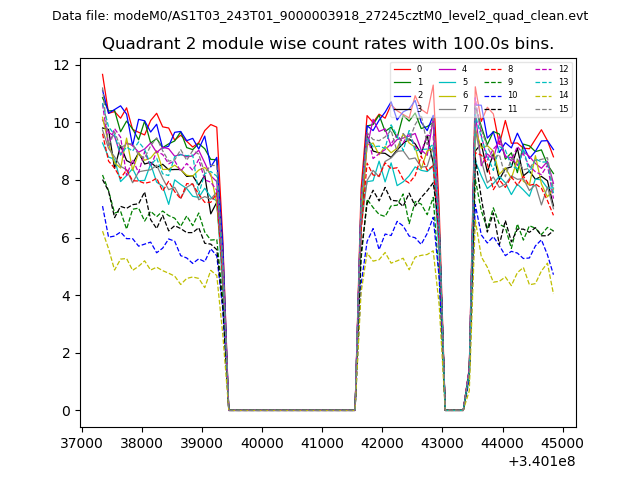
| Module-wise count rates for Quadrant B Data is divided into 100 sec bins |
 |
 |
| Module-wise count rates for Quadrant C Data is divided into 100 sec bins |
 |
 |
| Module-wise count rates for Quadrant D Data is divided into 100 sec bins |
 |
 |
| Parameter | Plot |
|---|---|
| CZT HV Monitor | 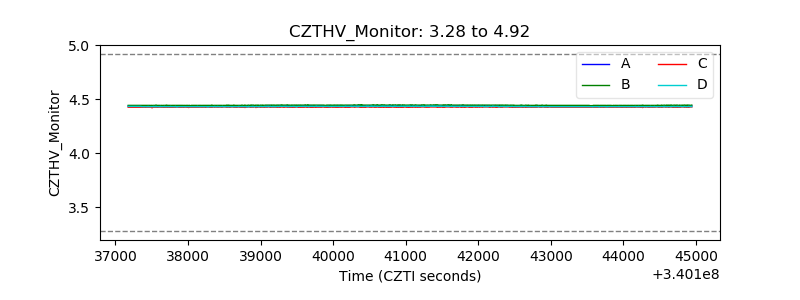 |
| D_VDD | 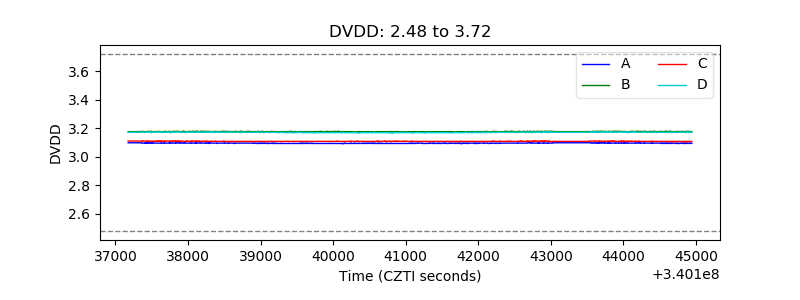 |
| Temperature 1 | 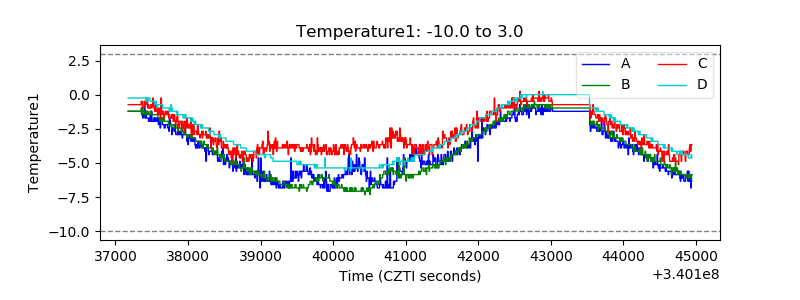 |
| Veto HV Monitor | 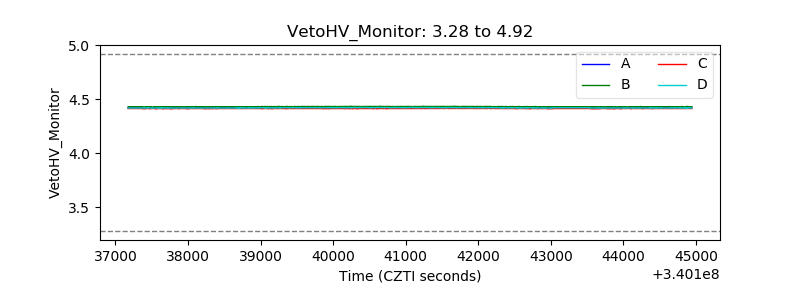 |
| Veto LLD | 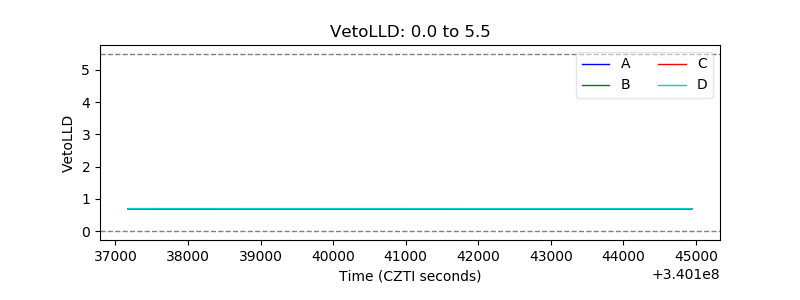 |
| Alpha Counter | 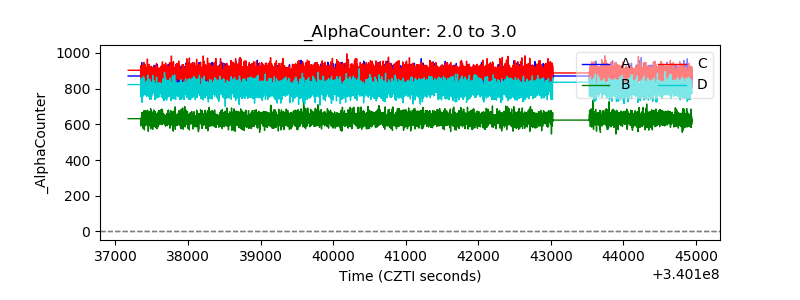 |
| _CPM_Rate | 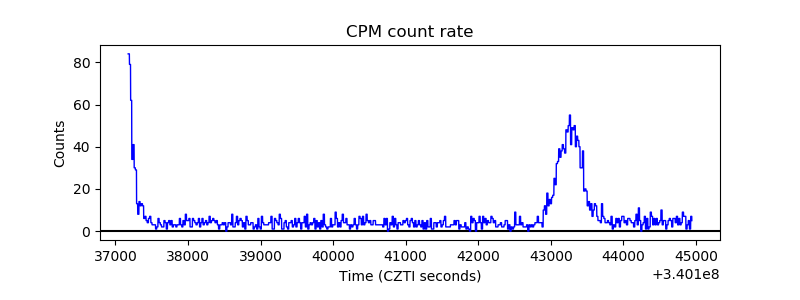 |
| CZT Counter | 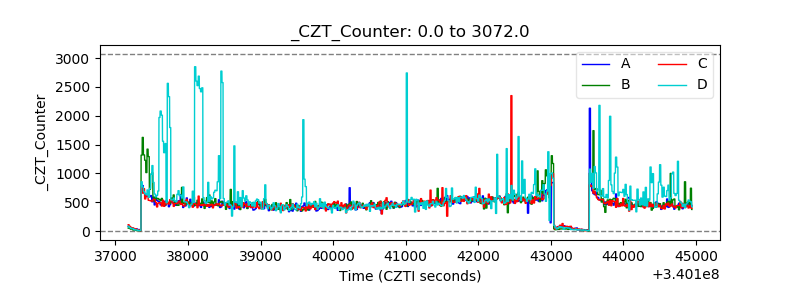 |
| +2.5 Volts monitor |  |
| +5 Volts monitor |  |
| _ROLL_ROT | 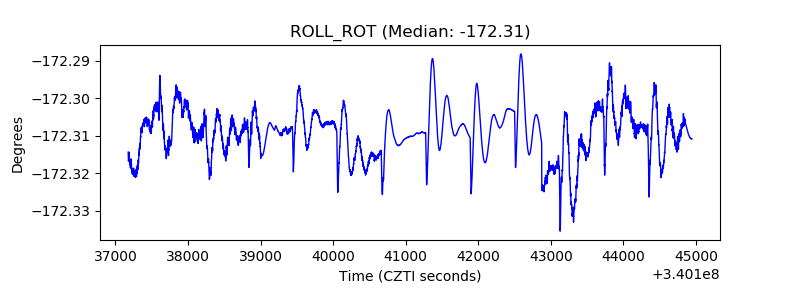 |
| _Roll_DEC | 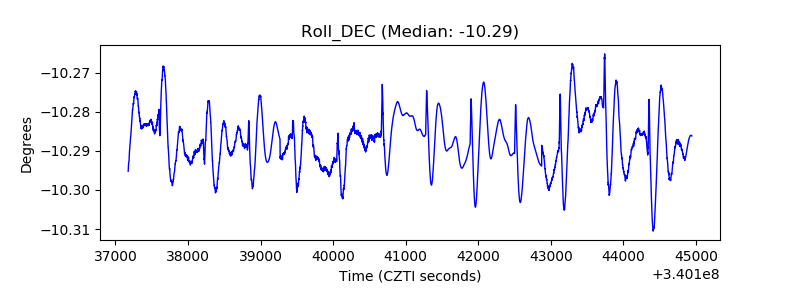 |
| _Roll_RA | 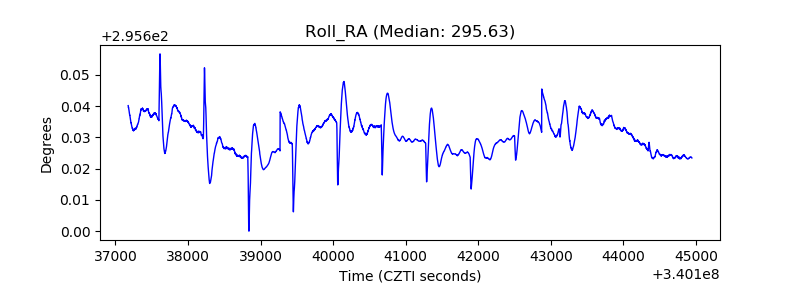 |
| Veto Counter |  |