| Param | Original file | Final file |
|---|---|---|
| Filename | modeM0/AS1T03_243T01_9000003918_27246cztM0_level2.evt | modeM0/AS1T03_243T01_9000003918_27246cztM0_level2_quad_clean.evt |
| Size (bytes) | 559,635,840 | 109,886,400 |
| Size | 533.7 MB | 104.8 MB |
| Events in quadrant A | 3,871,512 | 713,968 |
| Events in quadrant B | 4,154,645 | 718,106 |
| Events in quadrant C | 3,749,762 | 688,688 |
| Events in quadrant D | 4,648,768 | 670,108 |
| Mode M9 | |||
|---|---|---|---|
| Quadrant | BADHDUFLAG | Total packets | Discarded packets |
| A | 0 | 6 | 0 |
| B | 0 | 6 | 0 |
| C | 0 | 6 | 0 |
| D | 0 | 6 | 0 |
| Mode M0 | |||
|---|---|---|---|
| Quadrant | BADHDUFLAG | Total packets | Discarded packets |
| A | 0 | 16485 | 0 |
| B | 0 | 17240 | 0 |
| C | 0 | 16073 | 0 |
| D | 0 | 19100 | 0 |
| Quadrant | Total seconds | Saturated seconds | Saturation percentage |
|---|---|---|---|
| A | 7712 | 145 | 1.880187% |
| B | 7713 | 250 | 3.241281% |
| C | 7712 | 169 | 2.191390% |
| D | 7712 | 207 | 2.684129% |
Noise dominated data is calculated using 1-second bins in cleaned event files. If a bin has >2000 counts, and if more than 50% of those come from <1% of pixels, then it is considered to be noise-dominated and hence unusable.
| Quadrant | # 1 sec bins | Bins with >0 counts | Bins with >2000 counts | High rate bins dominated by noise | Noise dominated (total time) | Noise dominated (detector-on time) | Marked lightcurve |
|---|---|---|---|---|---|---|---|
| A | 8407 | 7716 | 13 | 13 | 0.15% | 0.17% | 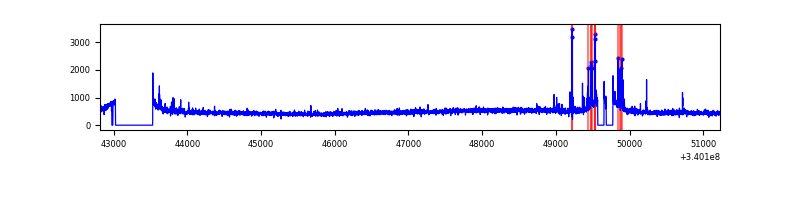 |
| B | 8408 | 7717 | 30 | 30 | 0.36% | 0.39% | 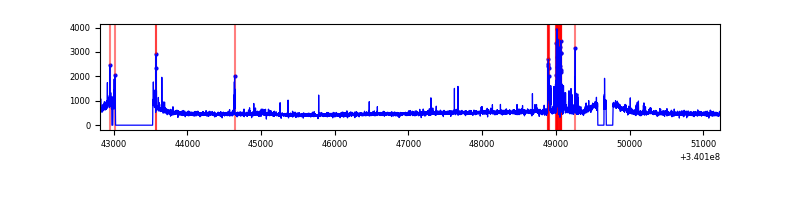 |
| C | 8407 | 7716 | 0 | 0 | 0.00% | 0.00% | 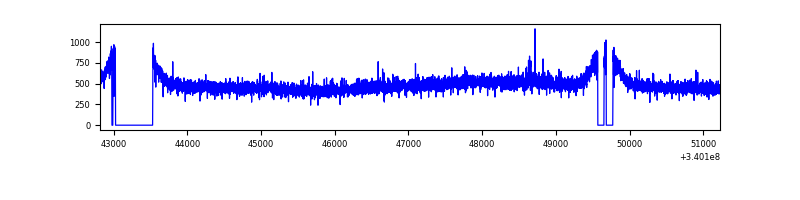 |
| D | 8407 | 7716 | 94 | 94 | 1.12% | 1.22% | 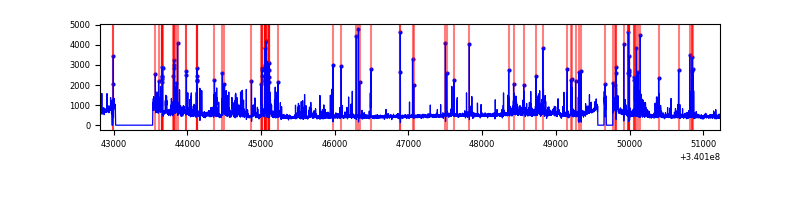 |
Top three noisy pixels from each quadrant. If the there are fewer than three noisy pixels in the level2.evt file, extra rows are filled as -1
| Pixel properties | Quadrant properties | ||||||
|---|---|---|---|---|---|---|---|
| Quadrant | DetID | PixID | Counts | Sigma | Mean | Median | Sigma |
| A | 13 | 248 | 117490 | 598.64 | 963 | 942 | 194.7 |
| A | 0 | 13 | 16815 | 81.53 | 963 | 942 | 194.7 |
| A | 8 | 192 | 12897 | 61.41 | 963 | 942 | 194.7 |
| B | 15 | 33 | 219167 | 1192.16 | 957 | 934 | 183.1 |
| B | 3 | 64 | 77055 | 415.83 | 957 | 934 | 183.1 |
| B | 5 | 172 | 58512 | 314.54 | 957 | 934 | 183.1 |
| C | 14 | 238 | 146659 | 670.37 | 920 | 925 | 217.4 |
| C | 15 | 208 | 14506 | 62.47 | 920 | 925 | 217.4 |
| C | 13 | 61 | 6288 | 24.67 | 920 | 925 | 217.4 |
| D | 1 | 52 | 688483 | 2815.73 | 915 | 897 | 244.2 |
| D | 2 | 250 | 206916 | 843.67 | 915 | 897 | 244.2 |
| D | 12 | 233 | 135785 | 552.38 | 915 | 897 | 244.2 |
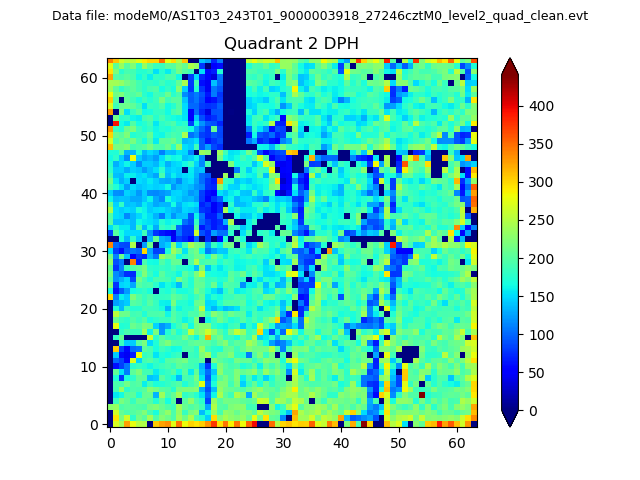
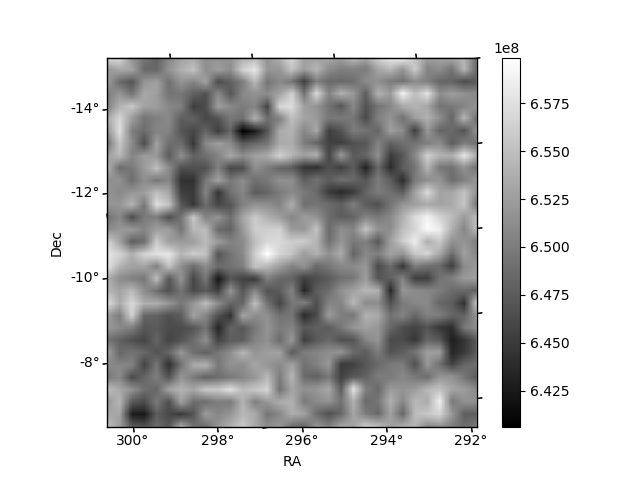
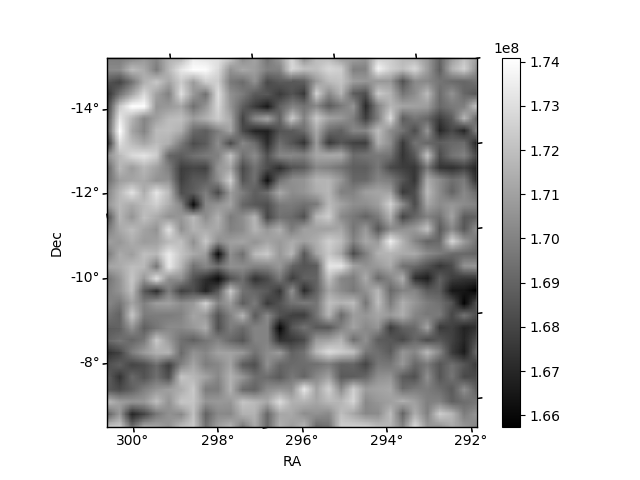
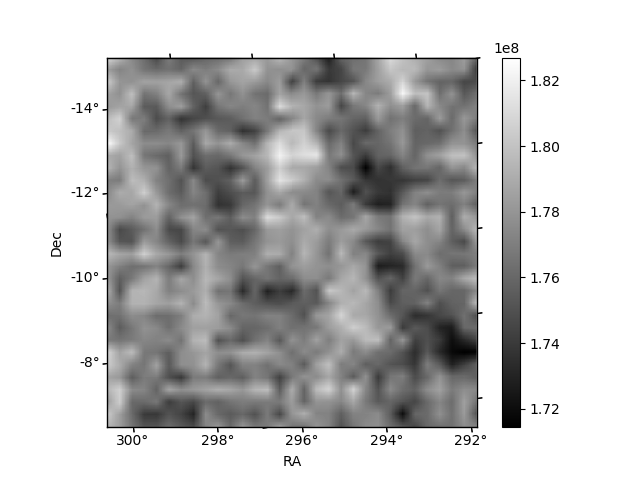
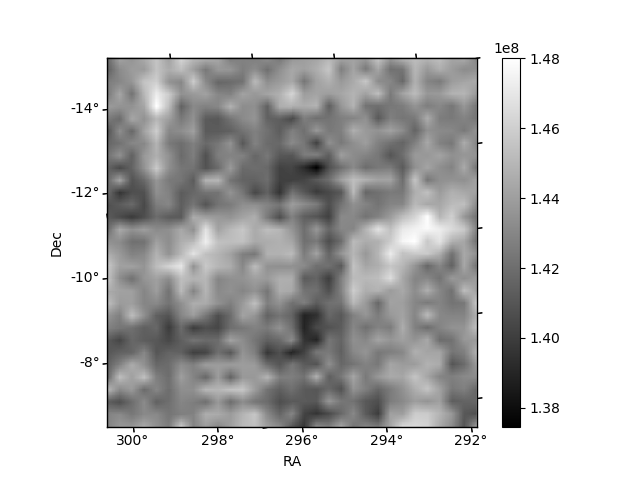
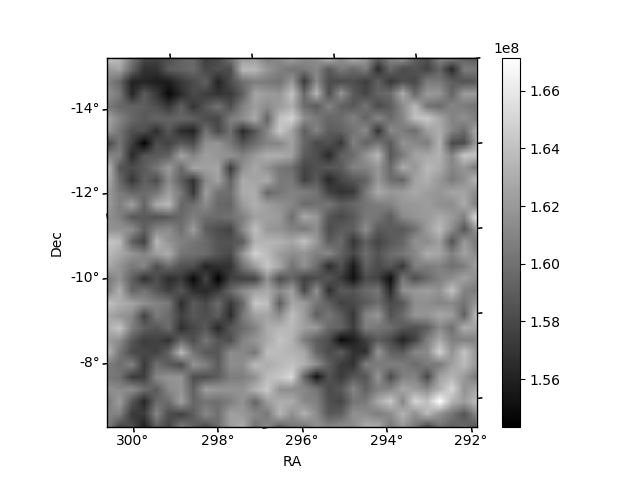
Histogram calculated using DETX and DETY for each event in the final _common_clean file
| Quadrant A | 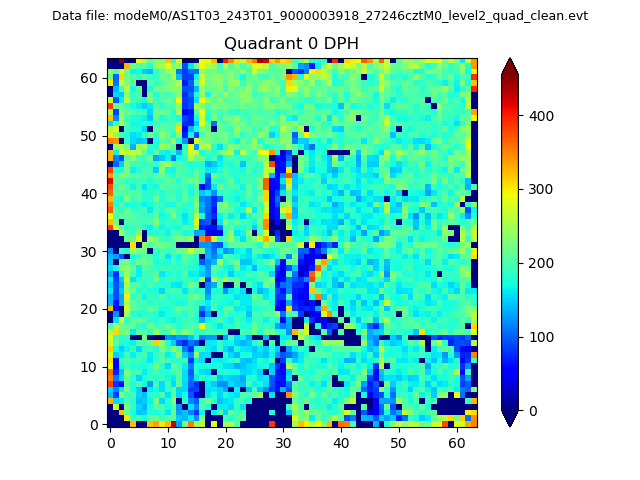 |
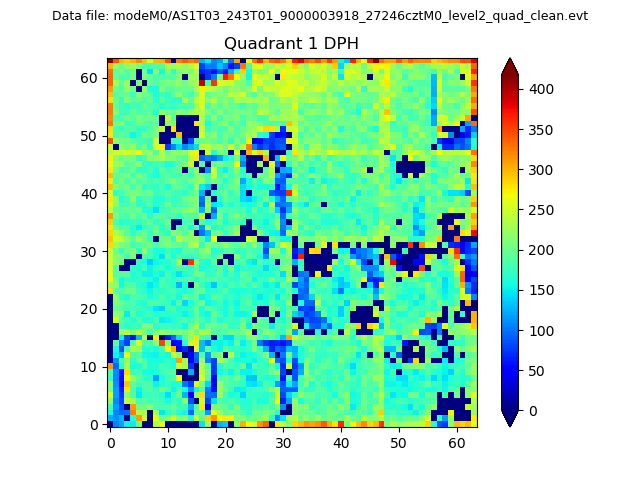 |
Quadrant B |
|---|---|---|---|
| Quadrant D | 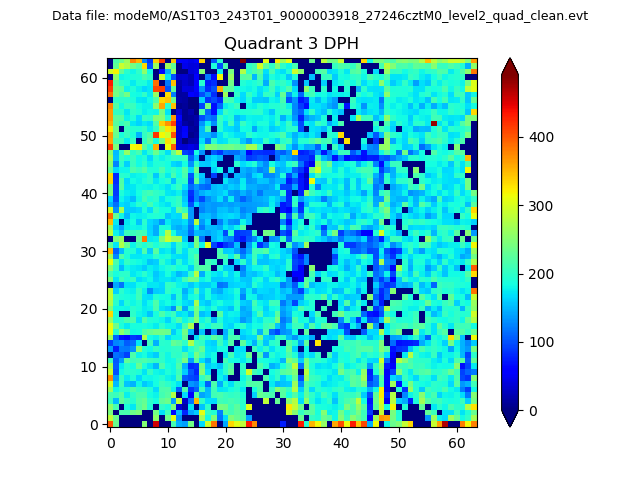 |
 |
Quadrant C |
| Plot type | Count rate plots | Images |
|---|---|---|
| Comparison with Poisson distribution Blue bars denote a histogram of data divided into 1 sec bins. Red curve is a Poisson curve with rate = median count rate of data. |
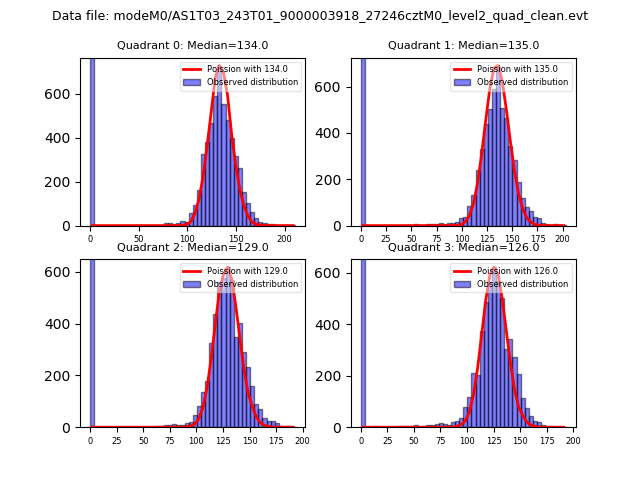 |
 |
| Quadrant-wise count rates Data is divided into 100 sec bins |
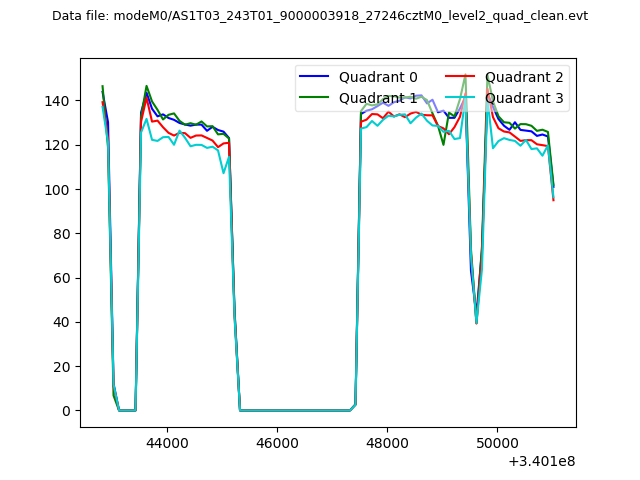 |
|
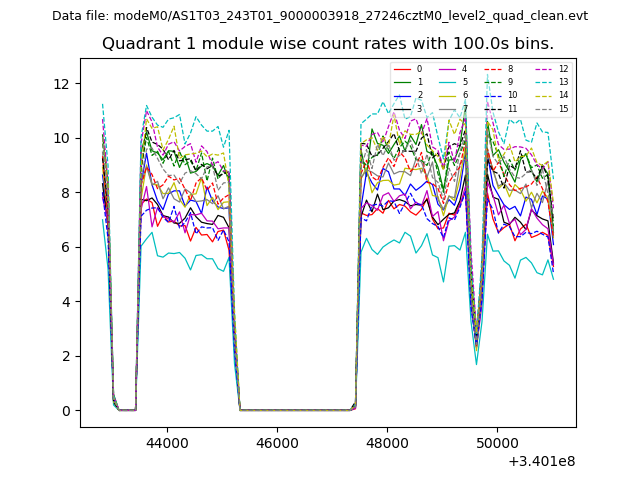
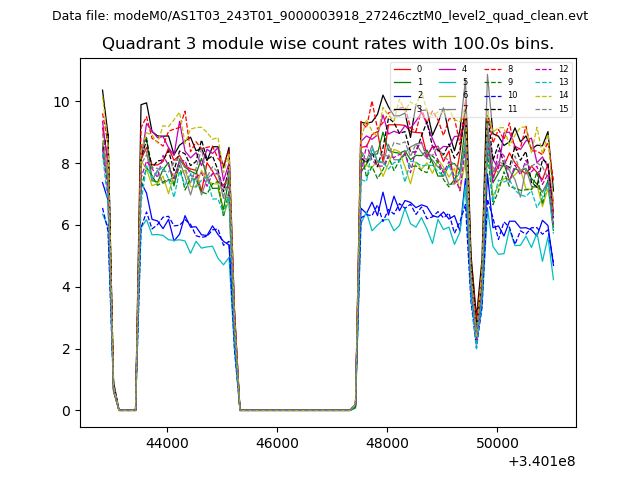
| Module-wise count rates for Quadrant A Data is divided into 100 sec bins |
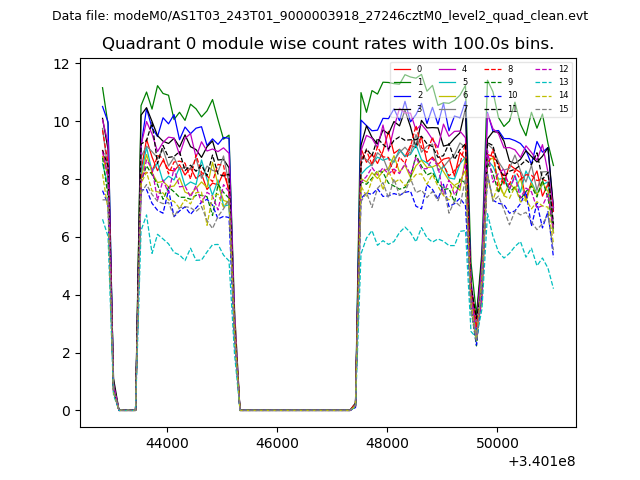 |
 |
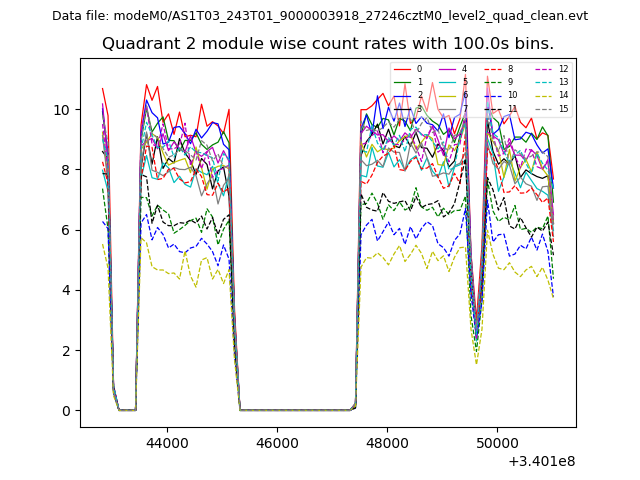
| Module-wise count rates for Quadrant B Data is divided into 100 sec bins |
 |
 |
| Module-wise count rates for Quadrant C Data is divided into 100 sec bins |
 |
 |
| Module-wise count rates for Quadrant D Data is divided into 100 sec bins |
 |
 |
| Parameter | Plot |
|---|---|
| CZT HV Monitor | 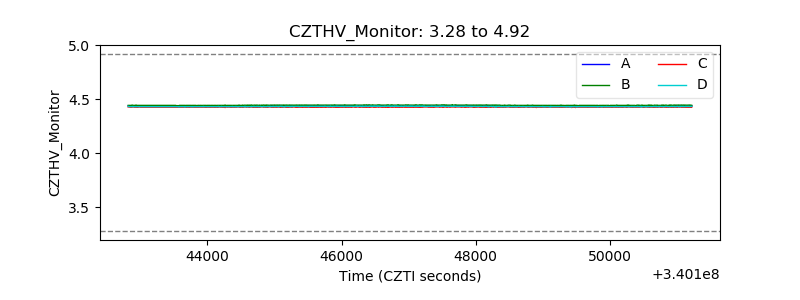 |
| D_VDD | 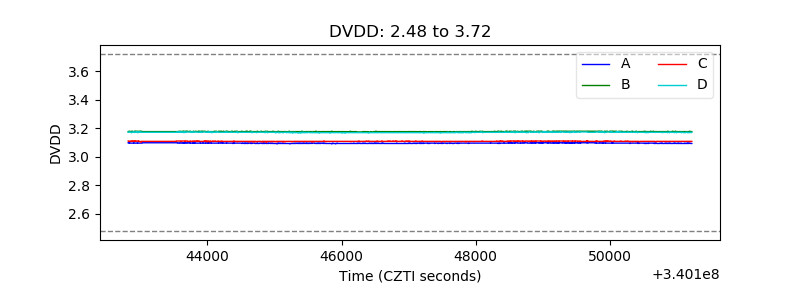 |
| Temperature 1 | 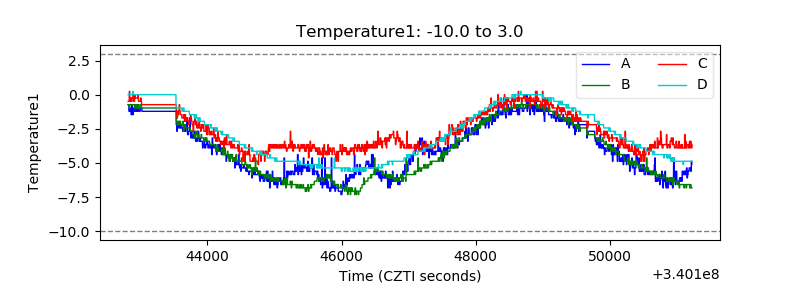 |
| Veto HV Monitor | 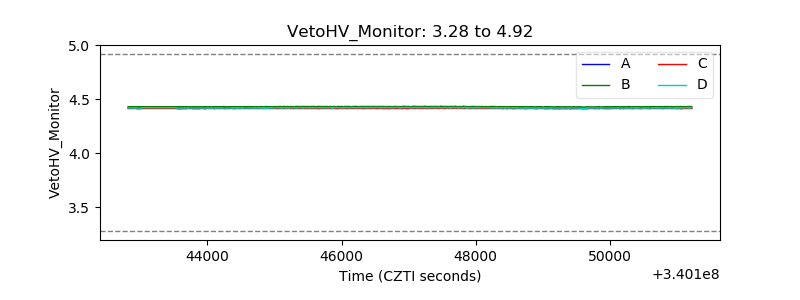 |
| Veto LLD | 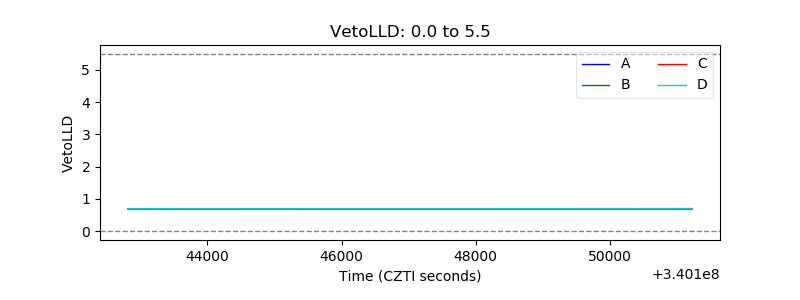 |
| Alpha Counter | 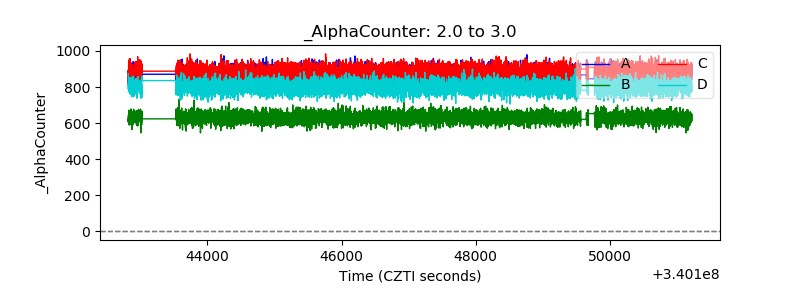 |
| _CPM_Rate | 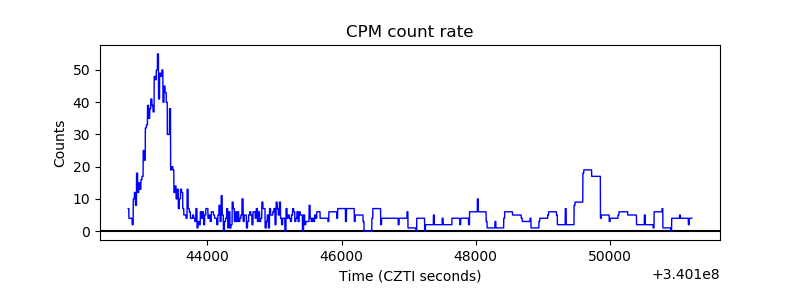 |
| CZT Counter | 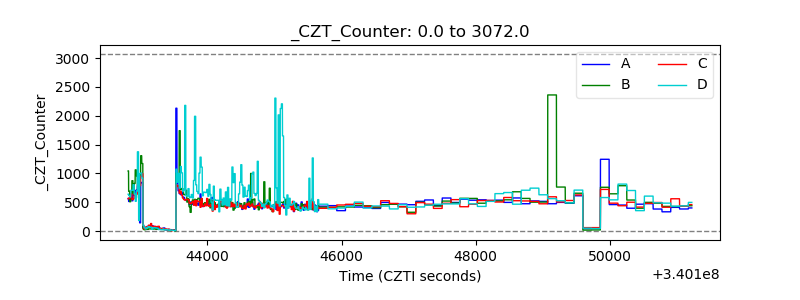 |
| +2.5 Volts monitor | 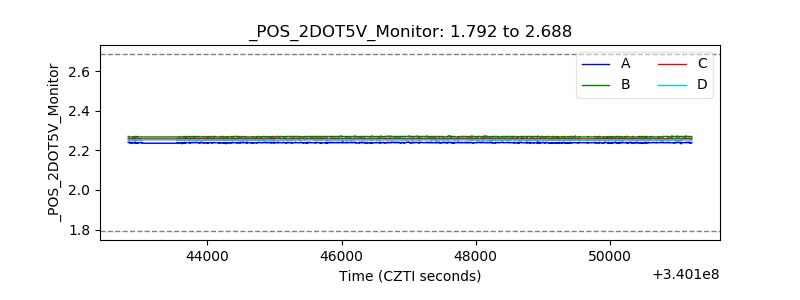 |
| +5 Volts monitor | 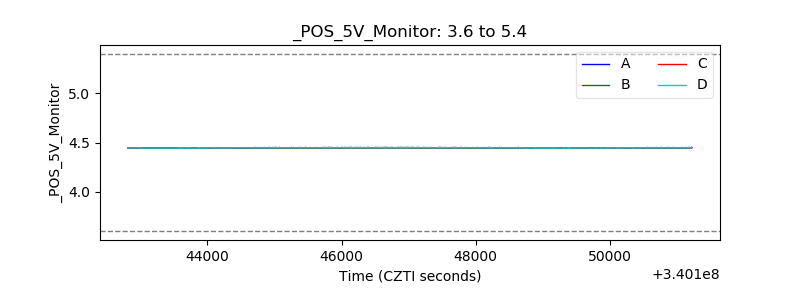 |
| _ROLL_ROT | 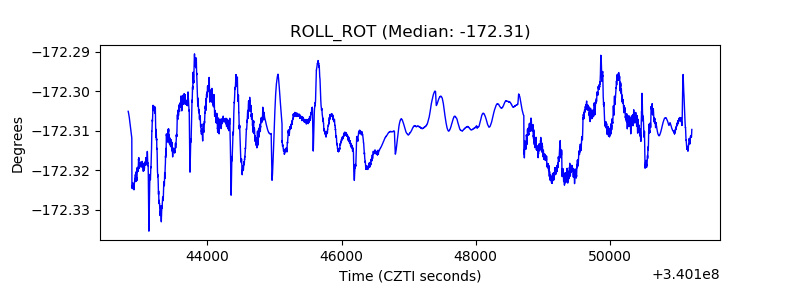 |
| _Roll_DEC | 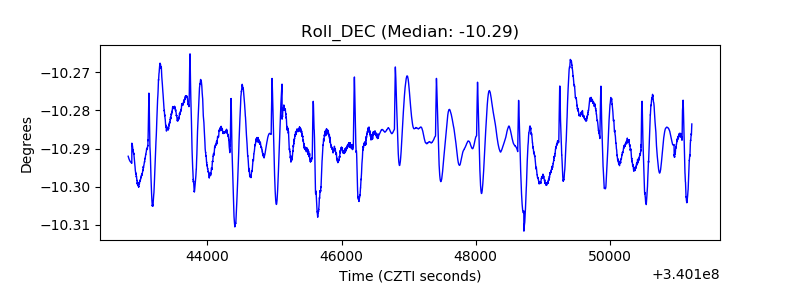 |
| _Roll_RA | 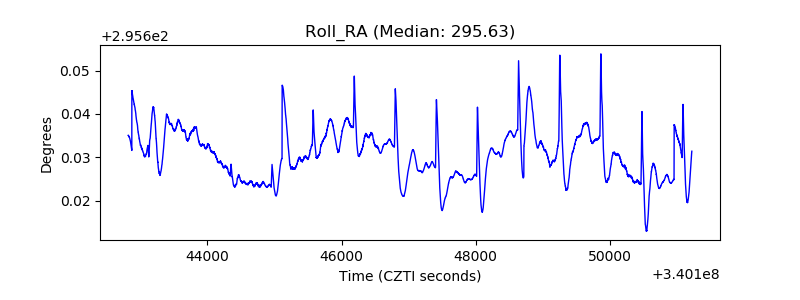 |
| Veto Counter | 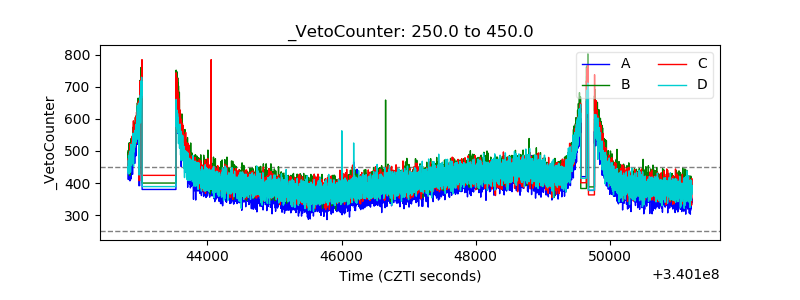 |