| Param | Original file | Final file |
|---|---|---|
| Filename | modeM0/AS1T03_243T01_9000003918cztM0_level2.fits | modeM0/AS1T03_243T01_9000003918cztM0_level2_quad_clean.evt |
| Size (bytes) | 2,148,600,960 | 1,687,991,040 |
| Size | 2.0 GB | 1.6 GB |
| Events in quadrant A | 13,583,044 | 9,744,033 |
| Events in quadrant B | 12,821,546 | 9,669,350 |
| Events in quadrant C | 12,950,942 | 9,178,849 |
| Events in quadrant D | 11,286,734 | 8,099,662 |
| Mode SS | |||
|---|---|---|---|
| Quadrant | BADHDUFLAG | Total packets | Discarded packets |
| A | 0 | 4288 | 0 |
| B | 0 | 4290 | 0 |
| C | 0 | 4290 | 0 |
| D | 0 | 4288 | 0 |
| Mode M9 | |||
|---|---|---|---|
| Quadrant | BADHDUFLAG | Total packets | Discarded packets |
| A | 0 | 351 | 0 |
| B | 0 | 351 | 0 |
| C | 0 | 351 | 0 |
| D | 0 | 351 | 0 |
| Mode M0 | |||
|---|---|---|---|
| Quadrant | BADHDUFLAG | Total packets | Discarded packets |
| A | 0 | 450956 | 0 |
| B | 0 | 495000 | 0 |
| C | 0 | 444476 | 0 |
| D | 0 | 594980 | 0 |
| Quadrant | Total seconds | Saturated seconds | Saturation percentage |
|---|---|---|---|
| A | 210589 | 2766 | 1.313459% |
| B | 210585 | 6411 | 3.044376% |
| C | 210571 | 3517 | 1.670220% |
| D | 210581 | 11394 | 5.410745% |
Noise dominated data is calculated using 1-second bins in cleaned event files. If a bin has >2000 counts, and if more than 50% of those come from <1% of pixels, then it is considered to be noise-dominated and hence unusable.
| Quadrant | # 1 sec bins | Bins with >0 counts | Bins with >2000 counts | High rate bins dominated by noise | Noise dominated (total time) | Noise dominated (detector-on time) | Marked lightcurve |
|---|---|---|---|---|---|---|---|
| A | 245962 | 210618 | 0 | 0 | 0.00% | 0.00% | 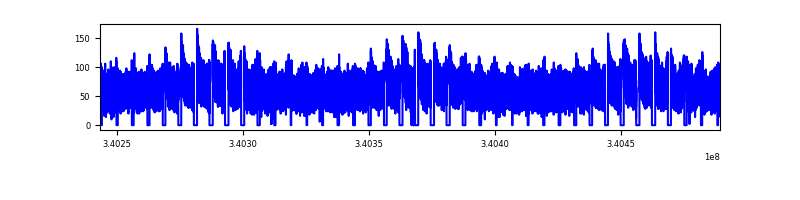 |
| B | 245962 | 210571 | 0 | 0 | 0.00% | 0.00% | 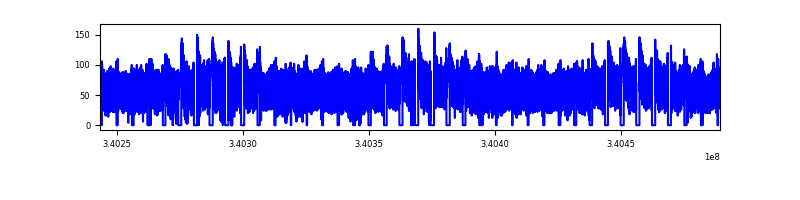 |
| C | 245962 | 210605 | 0 | 0 | 0.00% | 0.00% | 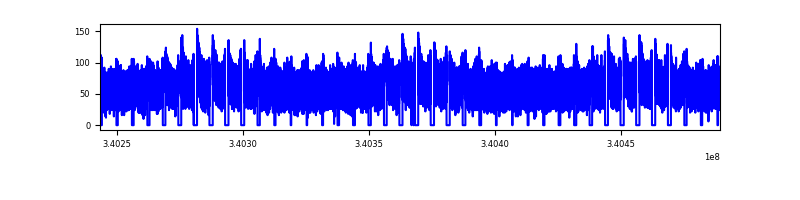 |
| D | 245962 | 210439 | 0 | 0 | 0.00% | 0.00% | 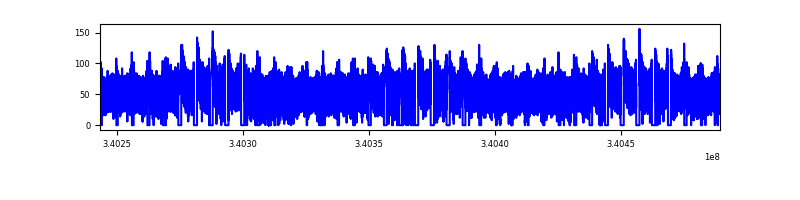 |
Top three noisy pixels from each quadrant. If the there are fewer than three noisy pixels in the level2.evt file, extra rows are filled as -1
| Pixel properties | Quadrant properties | ||||||
|---|---|---|---|---|---|---|---|
| Quadrant | DetID | PixID | Counts | Sigma | Mean | Median | Sigma |
| A | 0 | 29 | 11370 | 9.54 | 3544 | 3343 | 841.4 |
| A | 7 | 110 | 10572 | 8.59 | 3544 | 3343 | 841.4 |
| A | 9 | 19 | 10181 | 8.13 | 3544 | 3343 | 841.4 |
| B | 2 | 9 | 9960 | 10.25 | 3391 | 3243 | 655.1 |
| B | 2 | 8 | 8399 | 7.87 | 3391 | 3243 | 655.1 |
| B | 5 | 128 | 8331 | 7.77 | 3391 | 3243 | 655.1 |
| C | 12 | 241 | 8829 | 6.54 | 3425 | 3206 | 859.4 |
| C | 9 | 209 | 8753 | 6.45 | 3425 | 3206 | 859.4 |
| C | 3 | 126 | 8633 | 6.31 | 3425 | 3206 | 859.4 |
| D | 3 | 14 | 8187 | 6.19 | 3222 | 2942 | 848.0 |
| D | 7 | 3 | 7983 | 5.94 | 3222 | 2942 | 848.0 |
| D | 6 | 231 | 7965 | 5.92 | 3222 | 2942 | 848.0 |
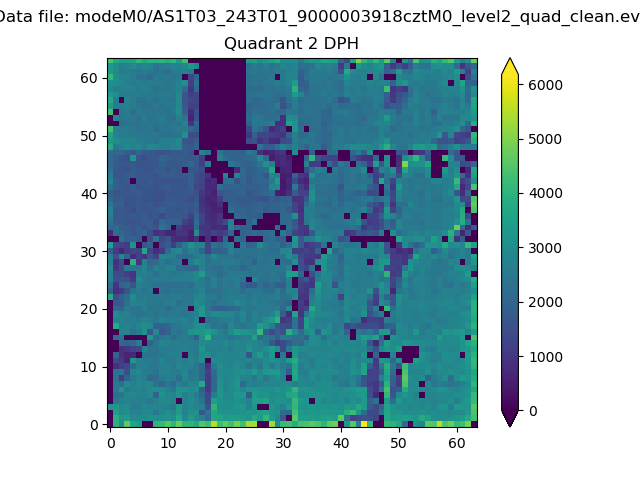
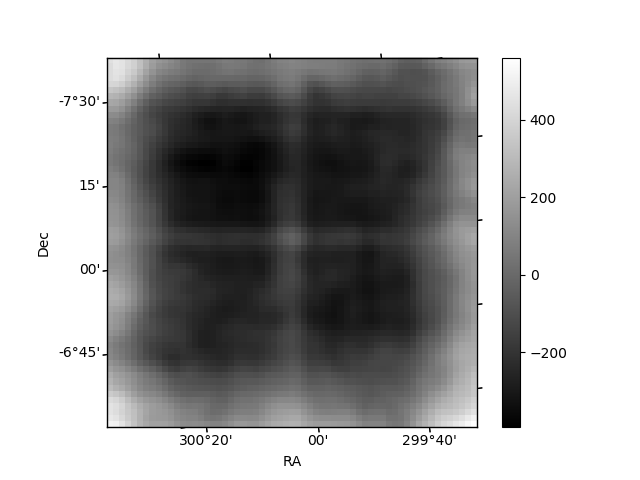
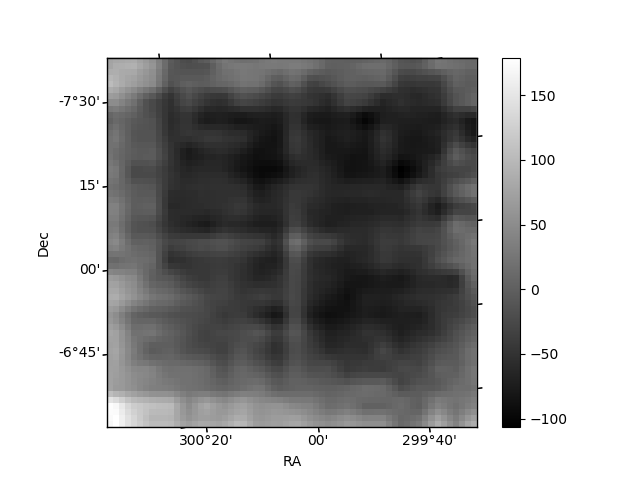
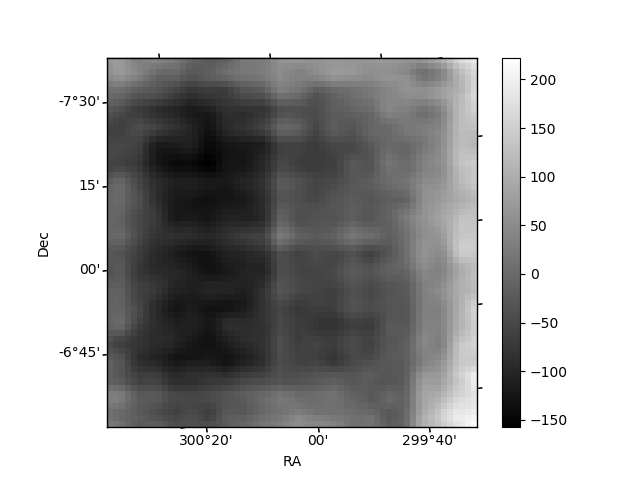
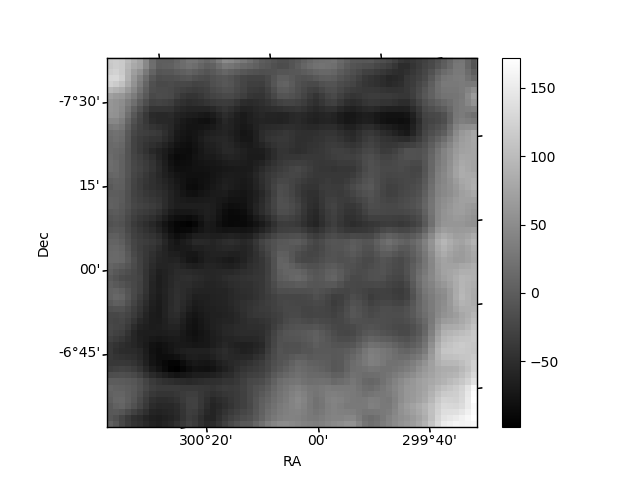
Histogram calculated using DETX and DETY for each event in the final _common_clean file
| Quadrant A | 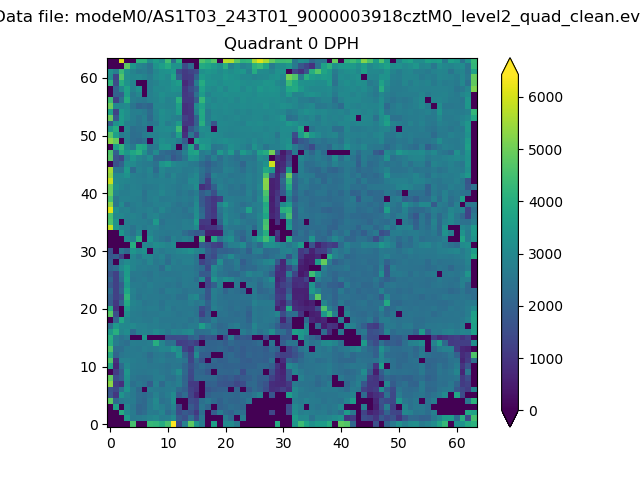 |
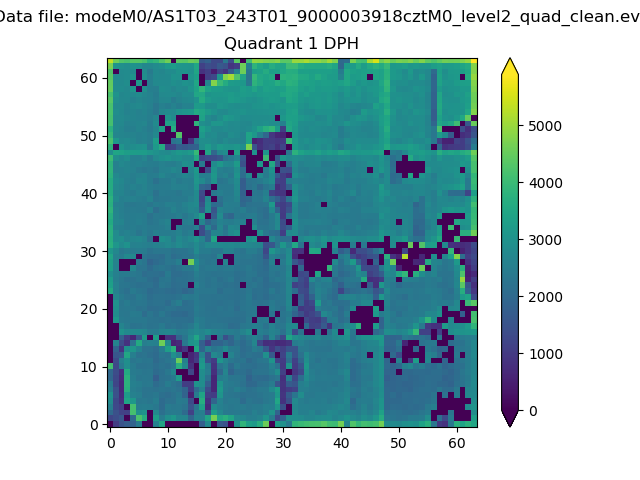 |
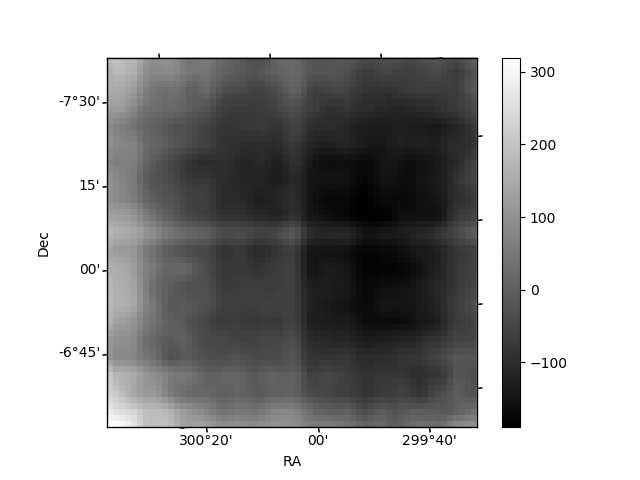
Quadrant B |
|---|---|---|---|
| Quadrant D | 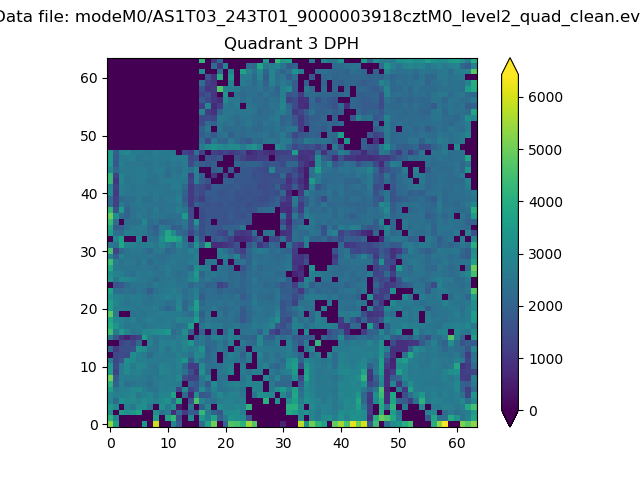 |
 |
Quadrant C |
| Plot type | Count rate plots | Images |
|---|---|---|
| Comparison with Poisson distribution Blue bars denote a histogram of data divided into 1 sec bins. Red curve is a Poisson curve with rate = median count rate of data. |
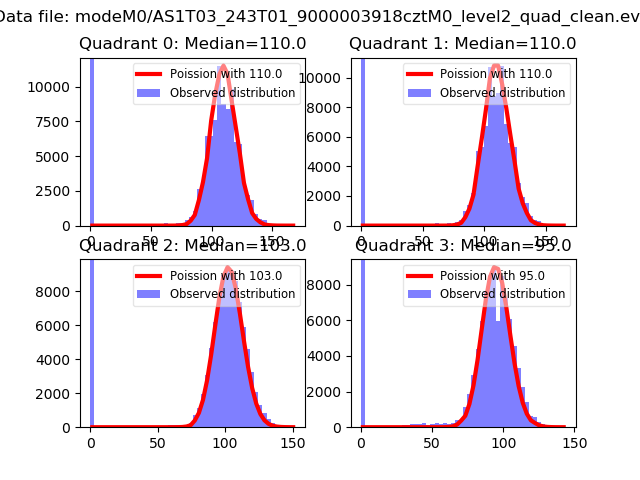 |
 |
| Quadrant-wise count rates Data is divided into 100 sec bins |
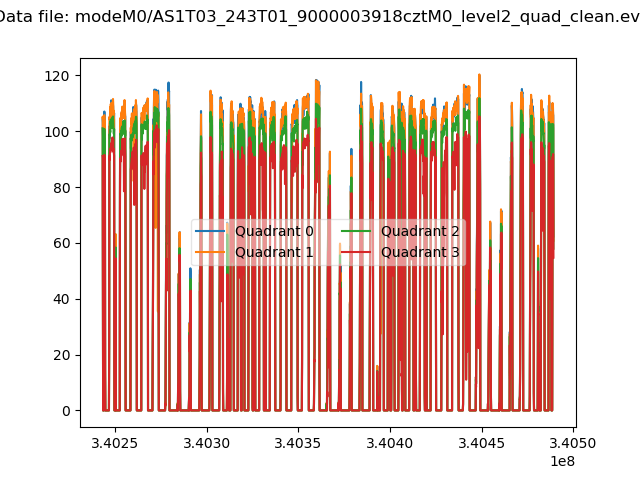 |
|
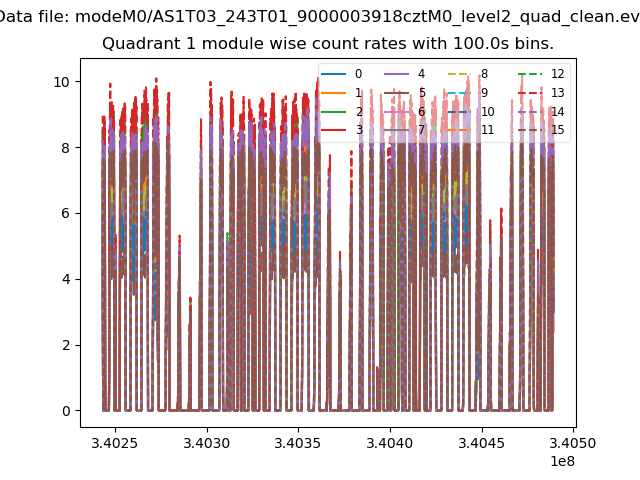
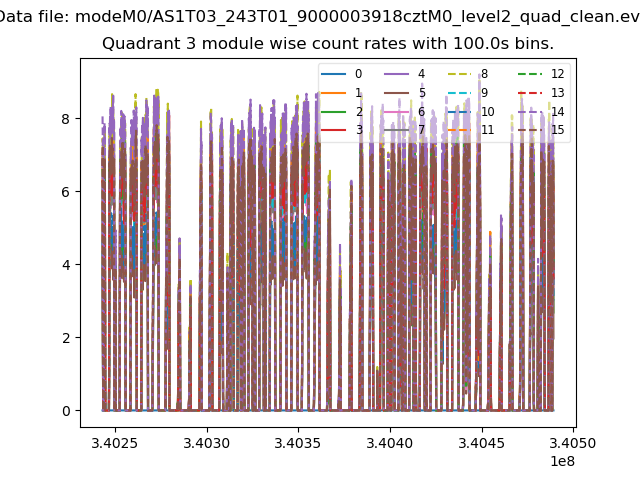
| Module-wise count rates for Quadrant A Data is divided into 100 sec bins |
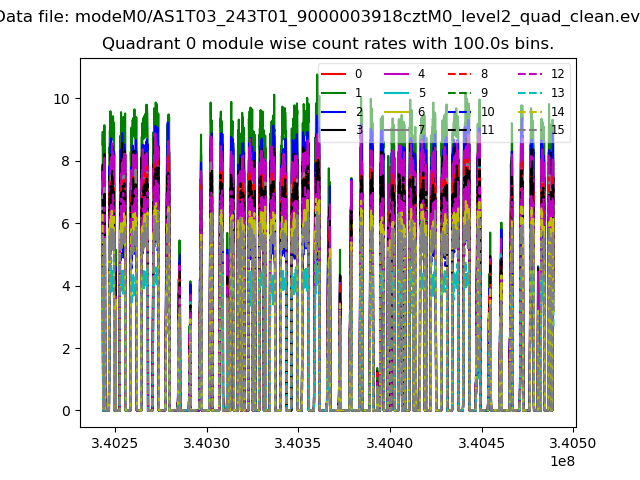 |
 |
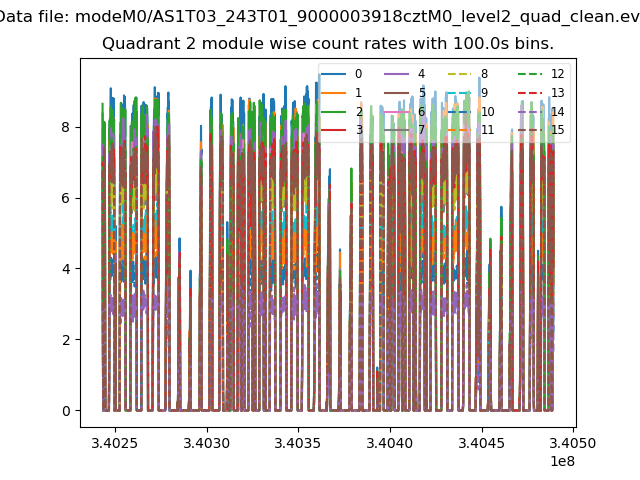
| Module-wise count rates for Quadrant B Data is divided into 100 sec bins |
 |
 |
| Module-wise count rates for Quadrant C Data is divided into 100 sec bins |
 |
 |
| Module-wise count rates for Quadrant D Data is divided into 100 sec bins |
 |
 |
| Parameter | Plot |
|---|---|
| CZT HV Monitor | 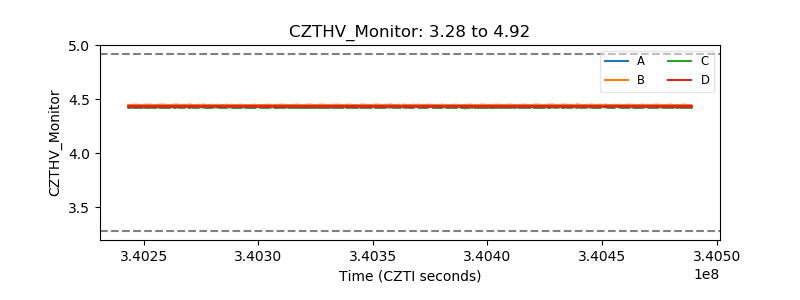 |
| D_VDD | 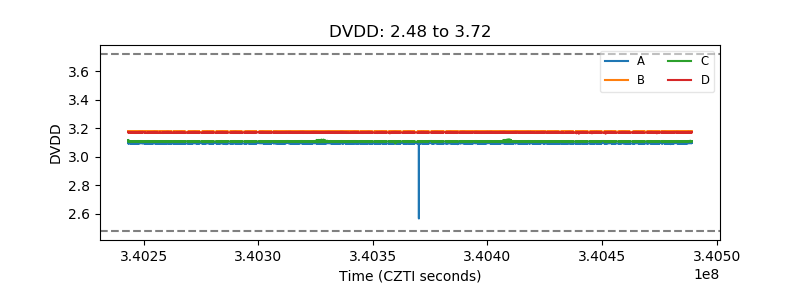 |
| Temperature 1 | 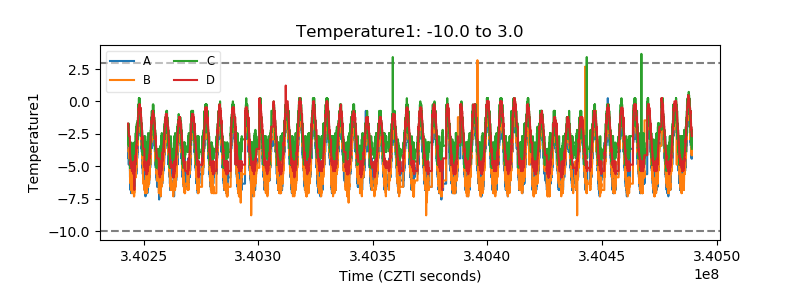 |
| Veto HV Monitor | 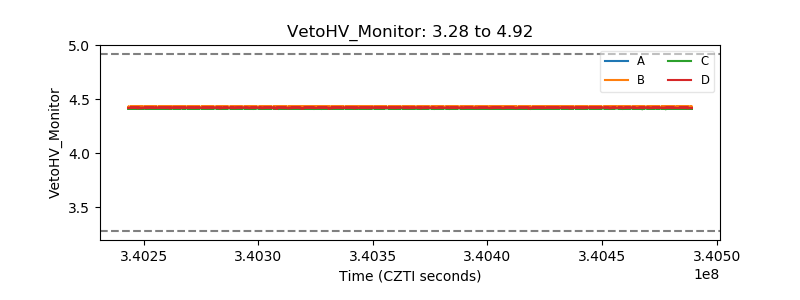 |
| Veto LLD | 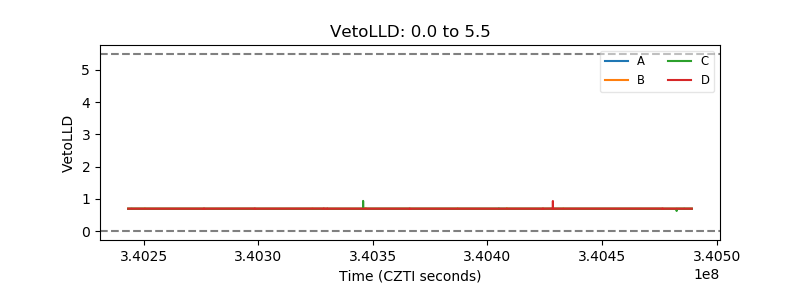 |
| Alpha Counter | 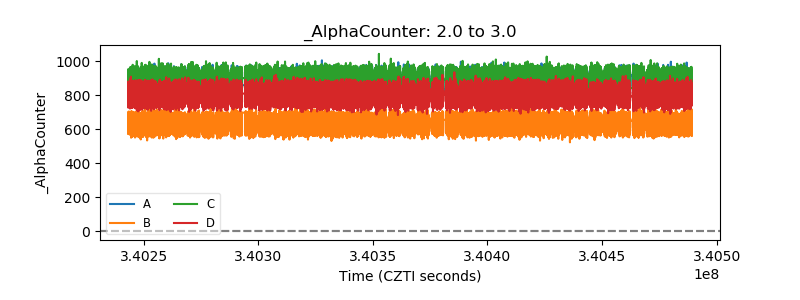 |
| _CPM_Rate | 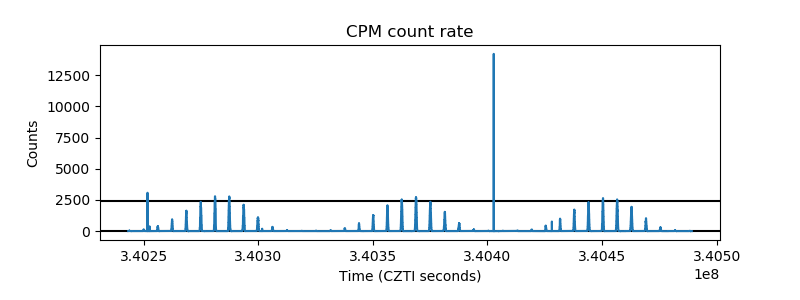 |
| CZT Counter | 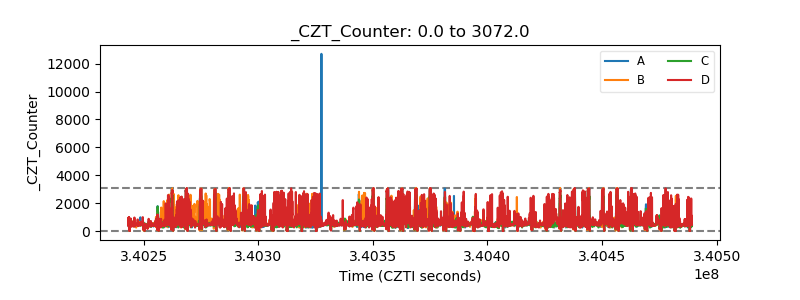 |
| +2.5 Volts monitor | 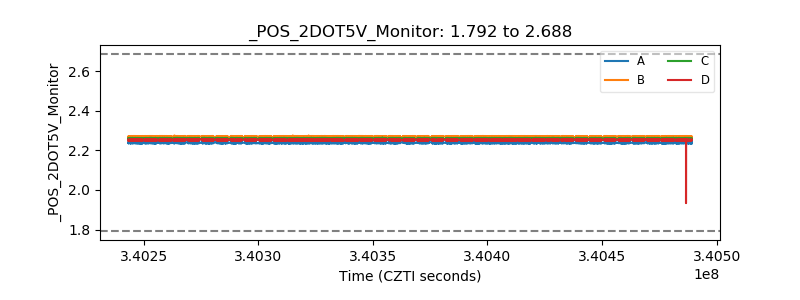 |
| +5 Volts monitor | 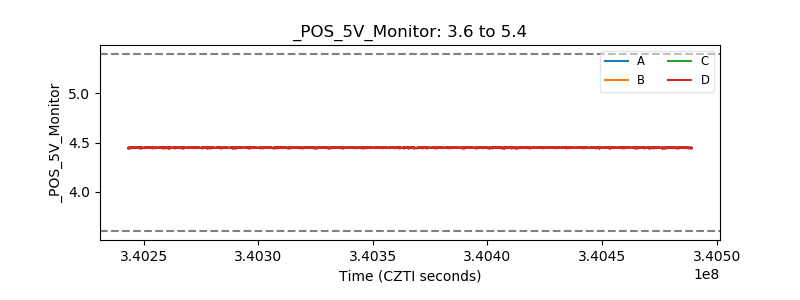 |
| _ROLL_ROT | 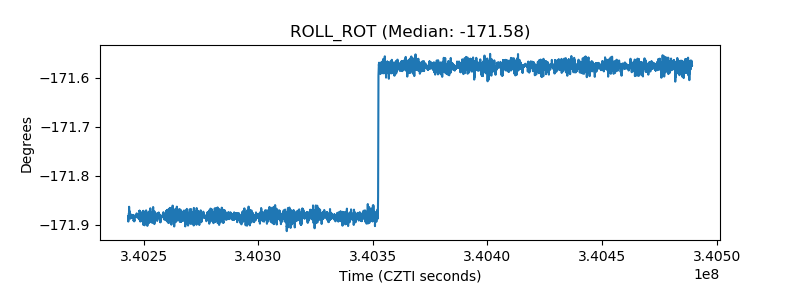 |
| _Roll_DEC | 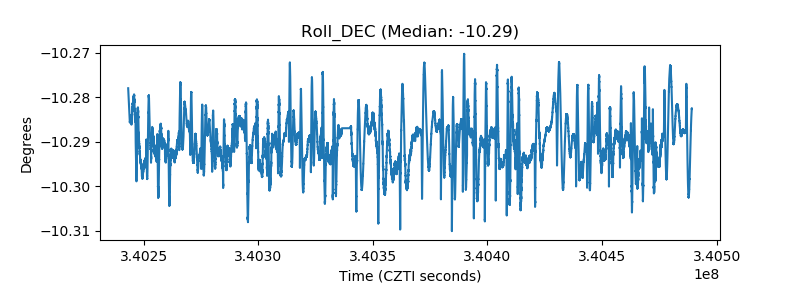 |
| _Roll_RA |  |
| Veto Counter | 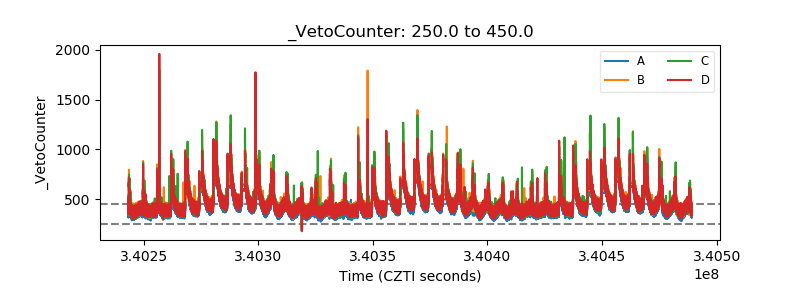 |