| Param | Original file | Final file |
|---|---|---|
| Filename | modeM0/AS1T03_243T01_9000003918_27264cztM0_level2.evt | modeM0/AS1T03_243T01_9000003918_27264cztM0_level2_quad_clean.evt |
| Size (bytes) | 892,961,280 | 151,093,440 |
| Size | 851.6 MB | 144.1 MB |
| Events in quadrant A | 6,486,075 | 928,687 |
| Events in quadrant B | 6,683,753 | 941,553 |
| Events in quadrant C | 6,314,194 | 901,052 |
| Events in quadrant D | 6,660,600 | 887,243 |
| Mode M9 | |||
|---|---|---|---|
| Quadrant | BADHDUFLAG | Total packets | Discarded packets |
| A | 0 | 16 | 0 |
| B | 0 | 16 | 0 |
| C | 0 | 16 | 0 |
| D | 0 | 16 | 0 |
| Mode M0 | |||
|---|---|---|---|
| Quadrant | BADHDUFLAG | Total packets | Discarded packets |
| A | 0 | 27726 | 0 |
| B | 0 | 28172 | 0 |
| C | 0 | 27142 | 0 |
| D | 0 | 28897 | 0 |
| Quadrant | Total seconds | Saturated seconds | Saturation percentage |
|---|---|---|---|
| A | 13273 | 148 | 1.115046% |
| B | 13273 | 160 | 1.205455% |
| C | 13273 | 200 | 1.506818% |
| D | 13273 | 139 | 1.047239% |
Noise dominated data is calculated using 1-second bins in cleaned event files. If a bin has >2000 counts, and if more than 50% of those come from <1% of pixels, then it is considered to be noise-dominated and hence unusable.
| Quadrant | # 1 sec bins | Bins with >0 counts | Bins with >2000 counts | High rate bins dominated by noise | Noise dominated (total time) | Noise dominated (detector-on time) | Marked lightcurve |
|---|---|---|---|---|---|---|---|
| A | 14938 | 13276 | 21 | 21 | 0.14% | 0.16% | 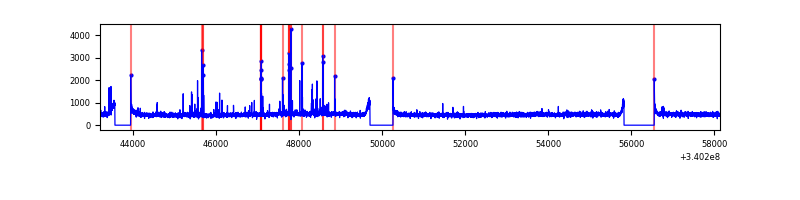 |
| B | 14938 | 13276 | 8 | 8 | 0.05% | 0.06% | 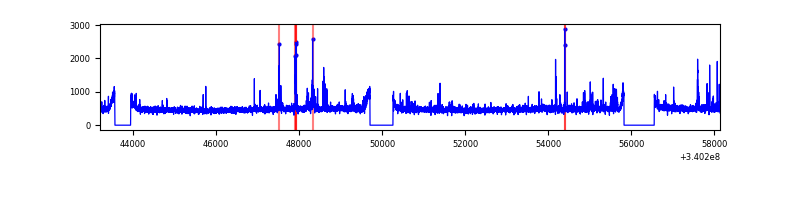 |
| C | 14938 | 13276 | 1 | 1 | 0.01% | 0.01% | 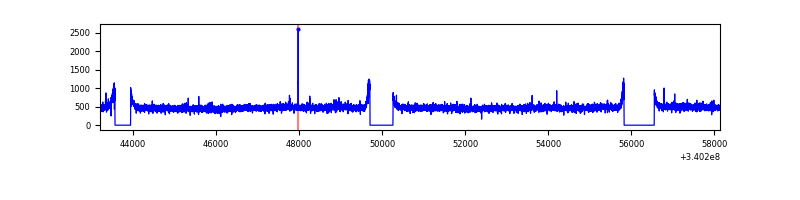 |
| D | 14938 | 13276 | 51 | 51 | 0.34% | 0.38% | 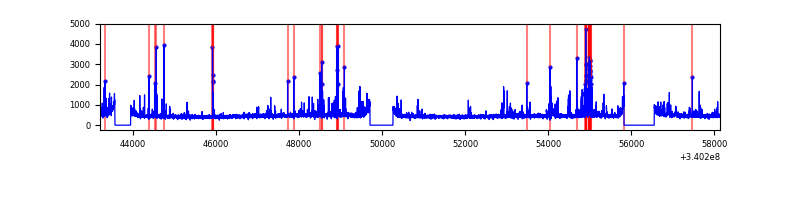 |
Top three noisy pixels from each quadrant. If the there are fewer than three noisy pixels in the level2.evt file, extra rows are filled as -1
| Pixel properties | Quadrant properties | ||||||
|---|---|---|---|---|---|---|---|
| Quadrant | DetID | PixID | Counts | Sigma | Mean | Median | Sigma |
| A | 12 | 96 | 175153 | 532.34 | 1621 | 1584 | 326.1 |
| A | 0 | 13 | 22781 | 65.01 | 1621 | 1584 | 326.1 |
| A | 8 | 192 | 21508 | 61.11 | 1621 | 1584 | 326.1 |
| B | 10 | 245 | 160557 | 508.09 | 1619 | 1575 | 312.9 |
| B | 0 | 245 | 79105 | 247.78 | 1619 | 1575 | 312.9 |
| B | 15 | 33 | 42793 | 131.73 | 1619 | 1575 | 312.9 |
| C | 14 | 238 | 246237 | 670.3 | 1550 | 1559 | 365.0 |
| C | 8 | 222 | 13616 | 33.03 | 1550 | 1559 | 365.0 |
| C | 15 | 208 | 12175 | 29.08 | 1550 | 1559 | 365.0 |
| D | 1 | 52 | 418032 | 1046.33 | 1555 | 1523 | 398.1 |
| D | 12 | 233 | 141443 | 351.5 | 1555 | 1523 | 398.1 |
| D | 2 | 250 | 108155 | 267.87 | 1555 | 1523 | 398.1 |
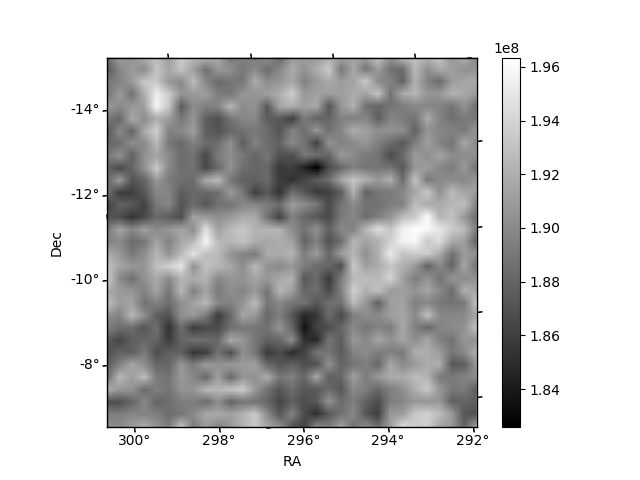
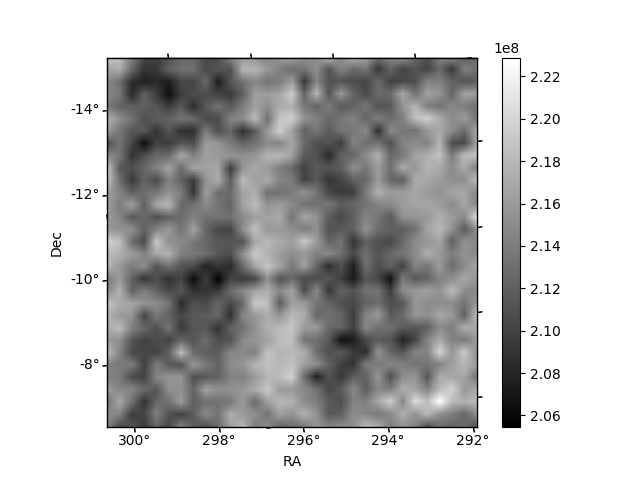
Histogram calculated using DETX and DETY for each event in the final _common_clean file
| Quadrant A |  |
 |
Quadrant B |
|---|---|---|---|
| Quadrant D |  |
 |
Quadrant C |
| Plot type | Count rate plots | Images |
|---|---|---|
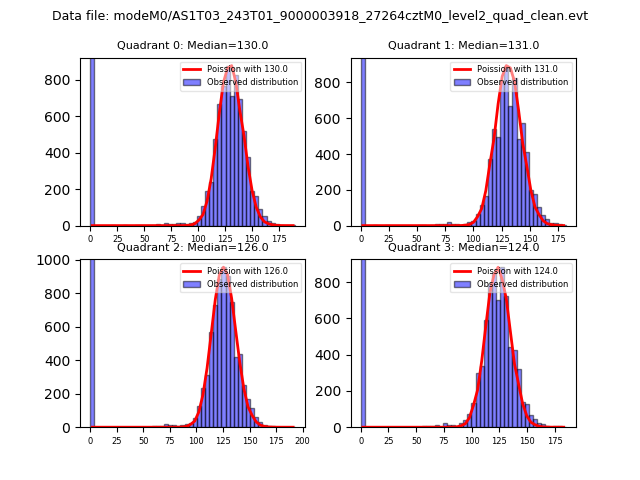
| Comparison with Poisson distribution Blue bars denote a histogram of data divided into 1 sec bins. Red curve is a Poisson curve with rate = median count rate of data. |
 |
 |
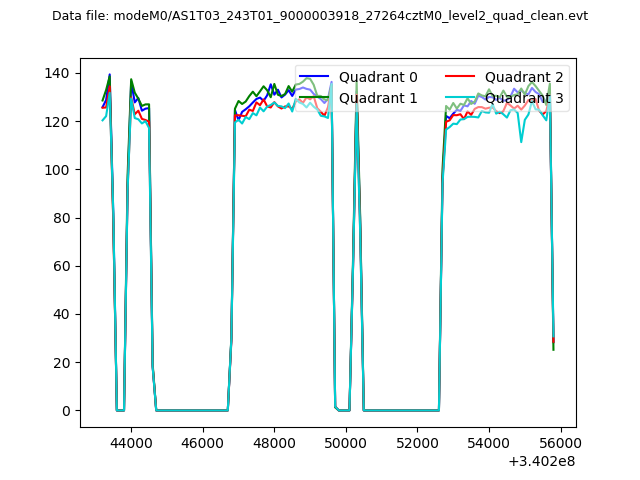
| Quadrant-wise count rates Data is divided into 100 sec bins |
 |
|
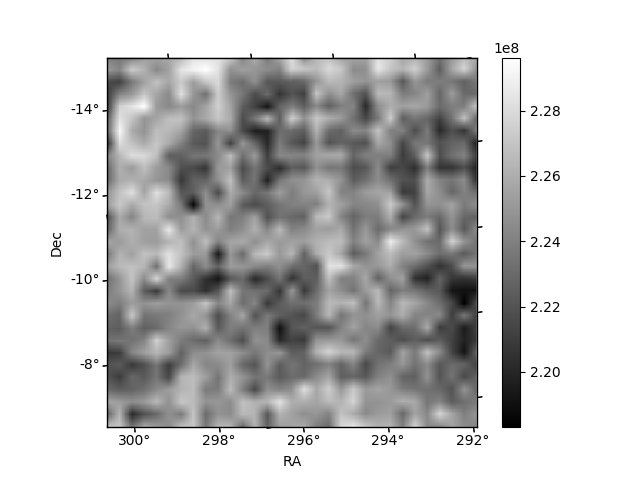
| Module-wise count rates for Quadrant A Data is divided into 100 sec bins |
 |
 |
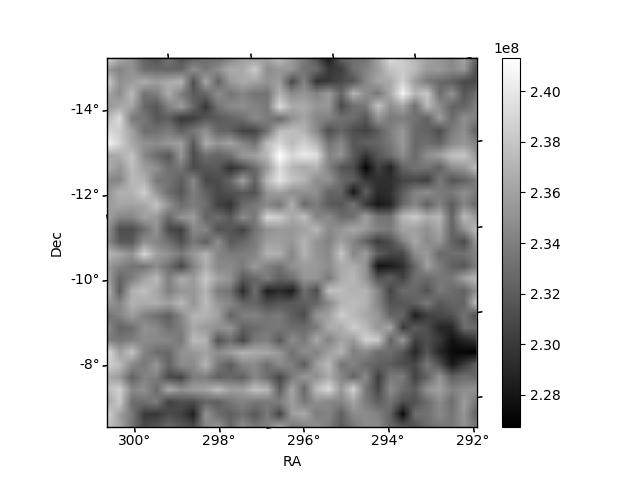
| Module-wise count rates for Quadrant B Data is divided into 100 sec bins |
 |
 |
| Module-wise count rates for Quadrant C Data is divided into 100 sec bins |
 |
 |
| Module-wise count rates for Quadrant D Data is divided into 100 sec bins |
 |
 |
| Parameter | Plot |
|---|---|
| CZT HV Monitor |  |
| D_VDD | 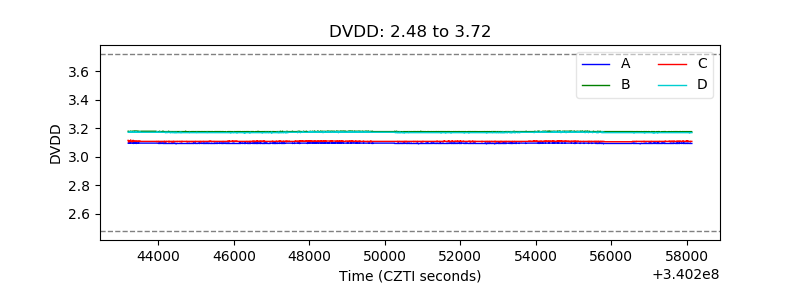 |
| Temperature 1 |  |
| Veto HV Monitor |  |
| Veto LLD |  |
| Alpha Counter | 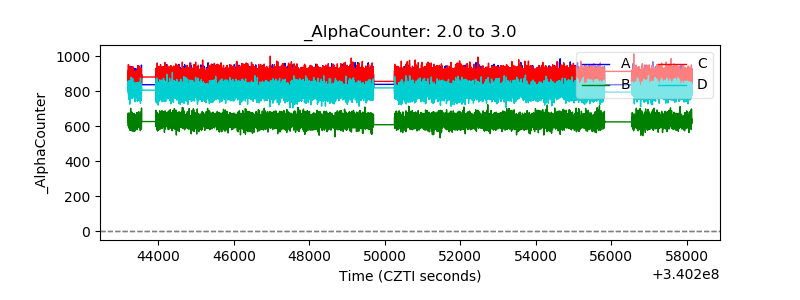 |
| _CPM_Rate | 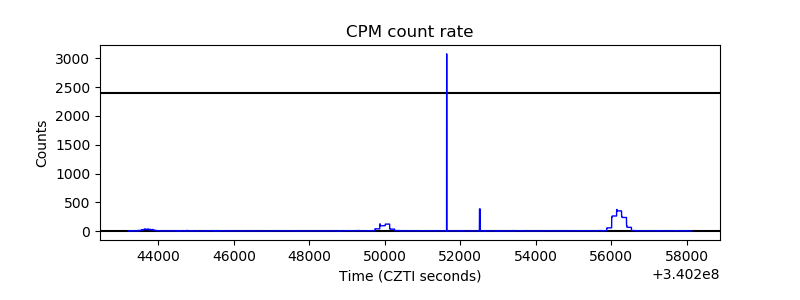 |
| CZT Counter |  |
| +2.5 Volts monitor |  |
| +5 Volts monitor |  |
| _ROLL_ROT |  |
| _Roll_DEC |  |
| _Roll_RA |  |
| Veto Counter |  |