| Param | Original file | Final file |
|---|---|---|
| Filename | modeM0/AS1T03_243T01_9000003918_27265cztM0_level2.evt | modeM0/AS1T03_243T01_9000003918_27265cztM0_level2_quad_clean.evt |
| Size (bytes) | 510,811,200 | 72,815,040 |
| Size | 487.1 MB | 69.4 MB |
| Events in quadrant A | 3,351,674 | 440,852 |
| Events in quadrant B | 3,998,125 | 442,369 |
| Events in quadrant C | 3,366,574 | 427,394 |
| Events in quadrant D | 4,286,695 | 414,728 |
| Mode M9 | |||
|---|---|---|---|
| Quadrant | BADHDUFLAG | Total packets | Discarded packets |
| A | 0 | 16 | 0 |
| B | 0 | 16 | 0 |
| C | 0 | 16 | 0 |
| D | 0 | 16 | 0 |
| Mode M0 | |||
|---|---|---|---|
| Quadrant | BADHDUFLAG | Total packets | Discarded packets |
| A | 0 | 14190 | 0 |
| B | 0 | 16108 | 0 |
| C | 0 | 14203 | 0 |
| D | 0 | 17185 | 0 |
| Quadrant | Total seconds | Saturated seconds | Saturation percentage |
|---|---|---|---|
| A | 6883 | 78 | 1.133227% |
| B | 6883 | 251 | 3.646666% |
| C | 6883 | 125 | 1.816069% |
| D | 6884 | 187 | 2.716444% |
Noise dominated data is calculated using 1-second bins in cleaned event files. If a bin has >2000 counts, and if more than 50% of those come from <1% of pixels, then it is considered to be noise-dominated and hence unusable.
| Quadrant | # 1 sec bins | Bins with >0 counts | Bins with >2000 counts | High rate bins dominated by noise | Noise dominated (total time) | Noise dominated (detector-on time) | Marked lightcurve |
|---|---|---|---|---|---|---|---|
| A | 8498 | 6884 | 1 | 1 | 0.01% | 0.01% | 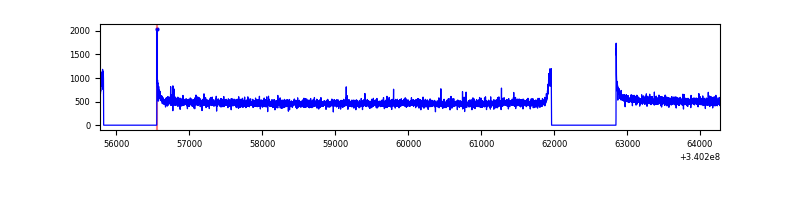 |
| B | 8498 | 6884 | 91 | 91 | 1.07% | 1.32% | 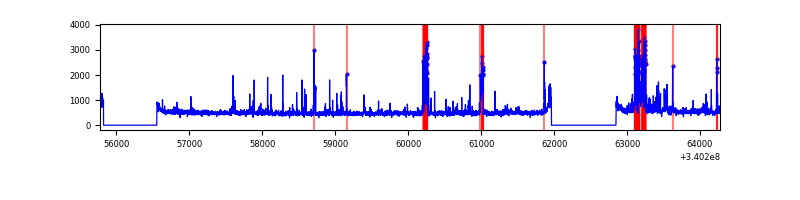 |
| C | 8498 | 6885 | 0 | 0 | 0.00% | 0.00% | 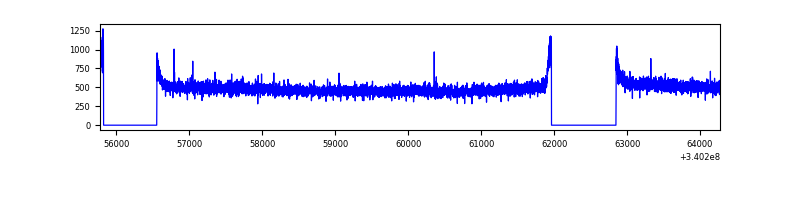 |
| D | 8499 | 6886 | 111 | 111 | 1.31% | 1.61% | 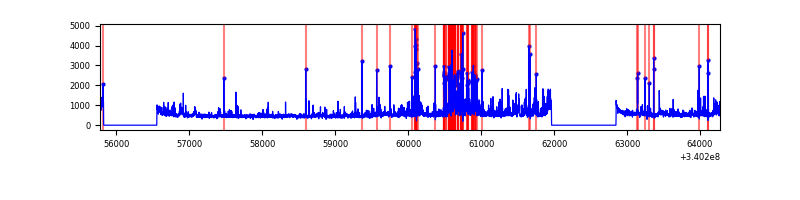 |
Top three noisy pixels from each quadrant. If the there are fewer than three noisy pixels in the level2.evt file, extra rows are filled as -1
| Pixel properties | Quadrant properties | ||||||
|---|---|---|---|---|---|---|---|
| Quadrant | DetID | PixID | Counts | Sigma | Mean | Median | Sigma |
| A | 8 | 192 | 12071 | 64.26 | 865 | 846 | 174.7 |
| A | 13 | 254 | 9253 | 48.13 | 865 | 846 | 174.7 |
| A | 3 | 137 | 8185 | 42.01 | 865 | 846 | 174.7 |
| B | 10 | 245 | 493524 | 2985.61 | 855 | 833 | 165.0 |
| B | 3 | 64 | 97681 | 586.88 | 855 | 833 | 165.0 |
| B | 0 | 182 | 24963 | 146.22 | 855 | 833 | 165.0 |
| C | 14 | 238 | 132097 | 673.28 | 828 | 833 | 195.0 |
| C | 4 | 224 | 7183 | 32.57 | 828 | 833 | 195.0 |
| C | 13 | 61 | 5649 | 24.7 | 828 | 833 | 195.0 |
| D | 1 | 52 | 991436 | 4867.87 | 825 | 804 | 203.5 |
| D | 12 | 233 | 78368 | 381.14 | 825 | 804 | 203.5 |
| D | 12 | 227 | 36942 | 177.58 | 825 | 804 | 203.5 |
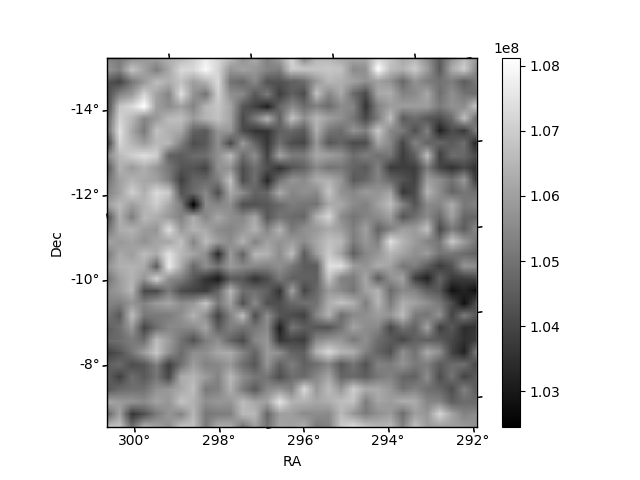
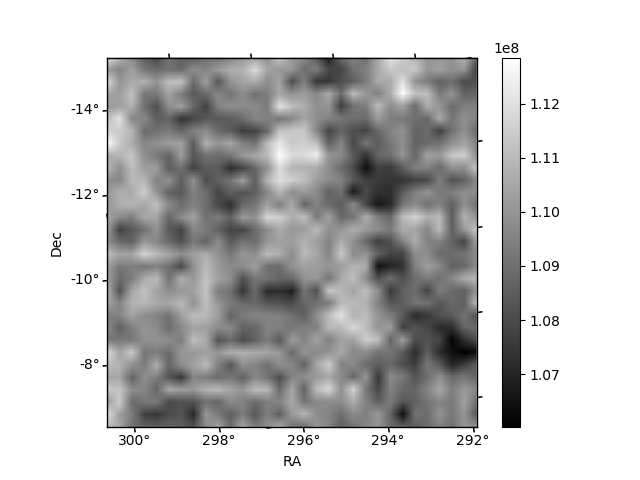
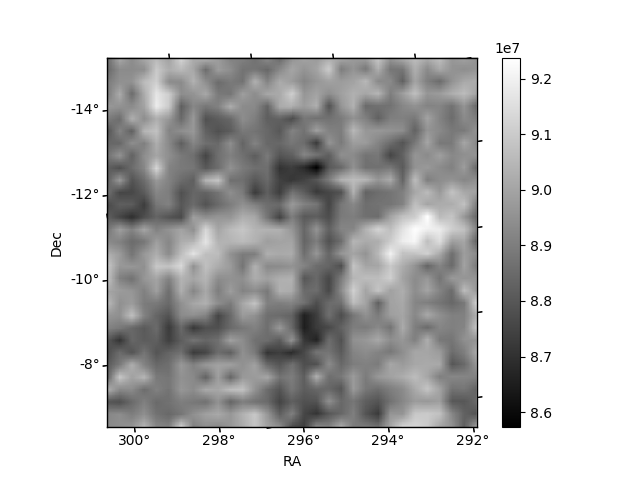
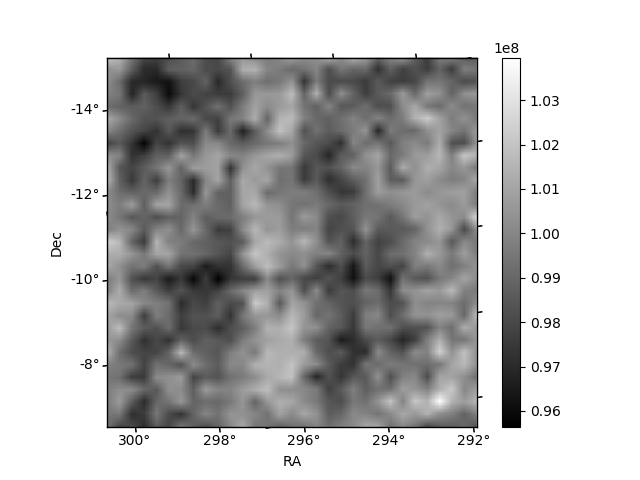
Histogram calculated using DETX and DETY for each event in the final _common_clean file
| Quadrant A | 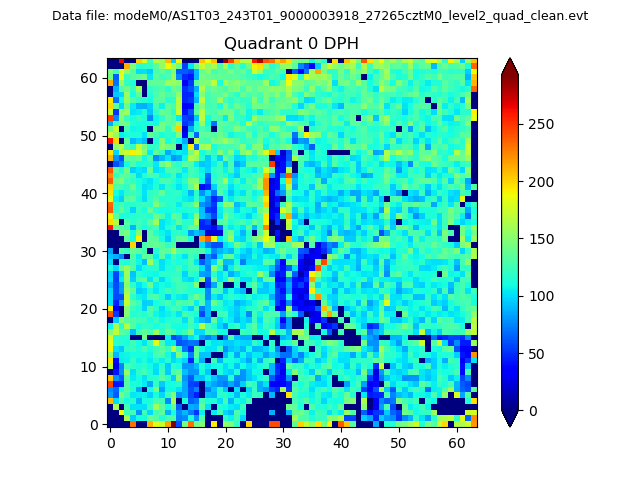 |
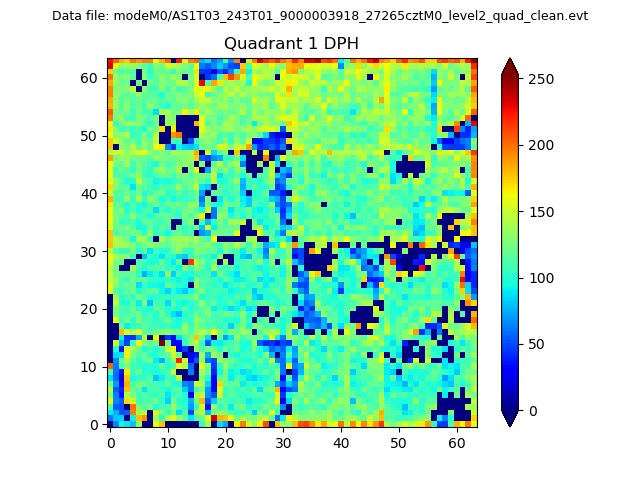 |
Quadrant B |
|---|---|---|---|
| Quadrant D |  |
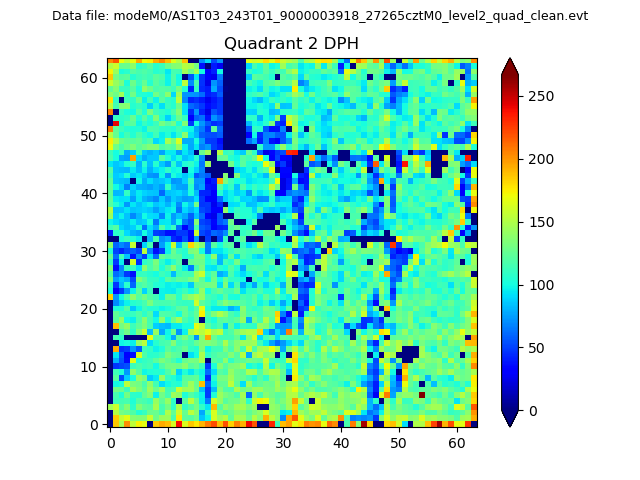 |
Quadrant C |
| Plot type | Count rate plots | Images |
|---|---|---|
| Comparison with Poisson distribution Blue bars denote a histogram of data divided into 1 sec bins. Red curve is a Poisson curve with rate = median count rate of data. |
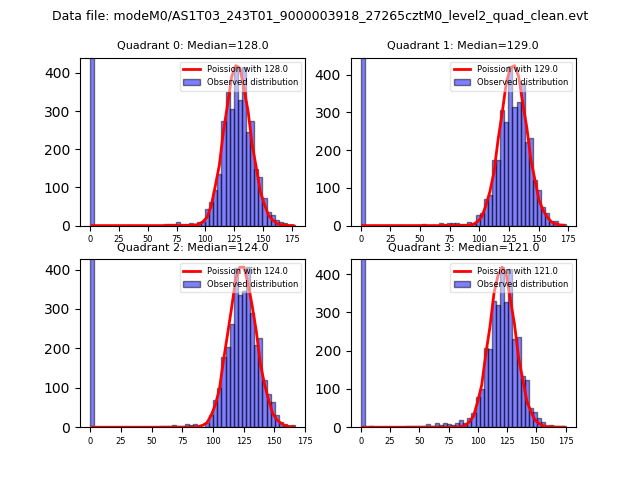 |
 |
| Quadrant-wise count rates Data is divided into 100 sec bins |
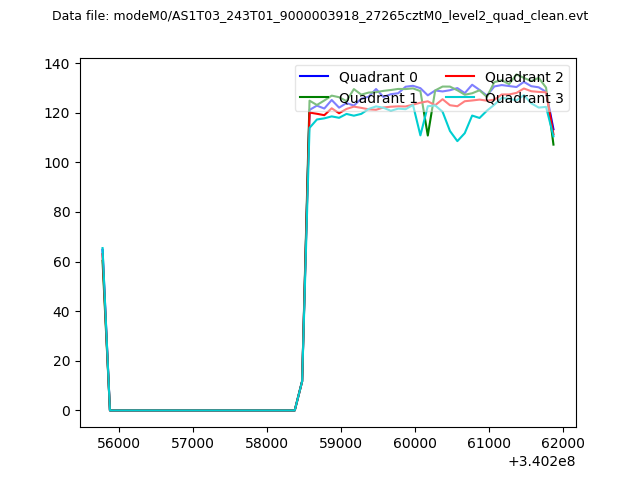 |
|
| Module-wise count rates for Quadrant A Data is divided into 100 sec bins |
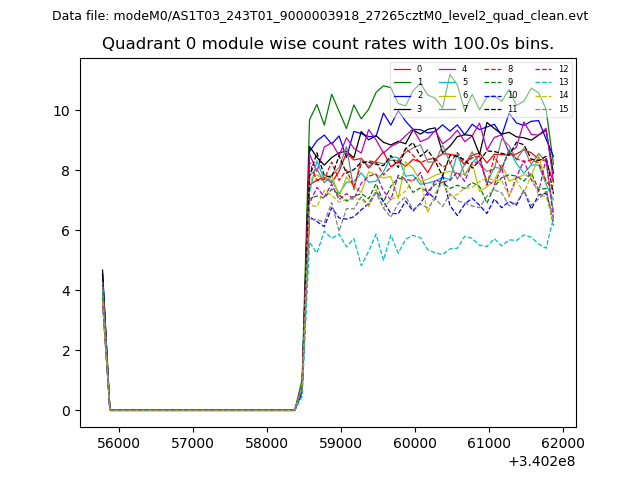 |
 |
| Module-wise count rates for Quadrant B Data is divided into 100 sec bins |
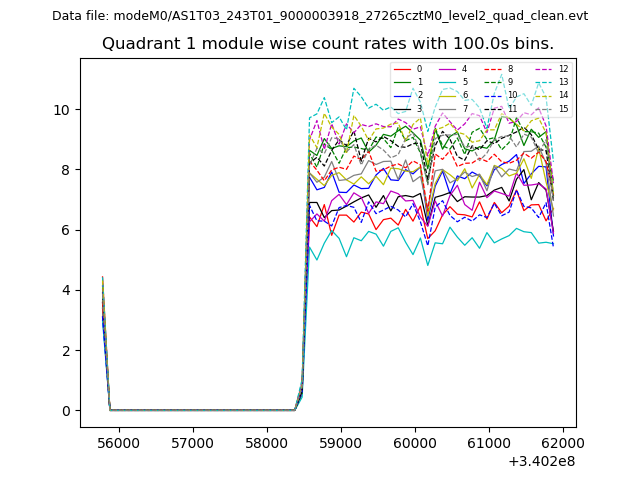 |
 |
| Module-wise count rates for Quadrant C Data is divided into 100 sec bins |
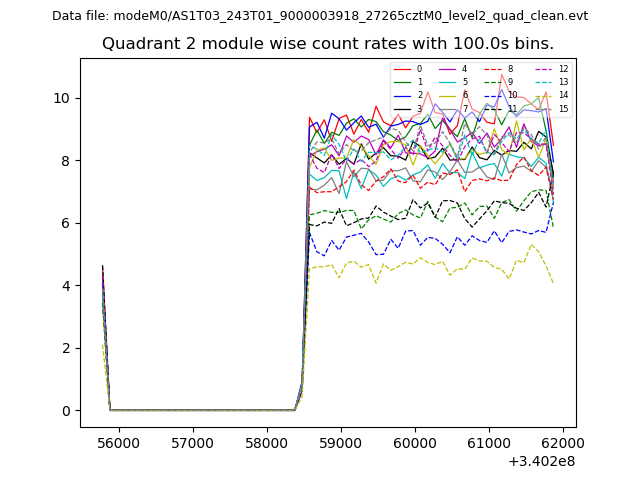 |
 |
| Module-wise count rates for Quadrant D Data is divided into 100 sec bins |
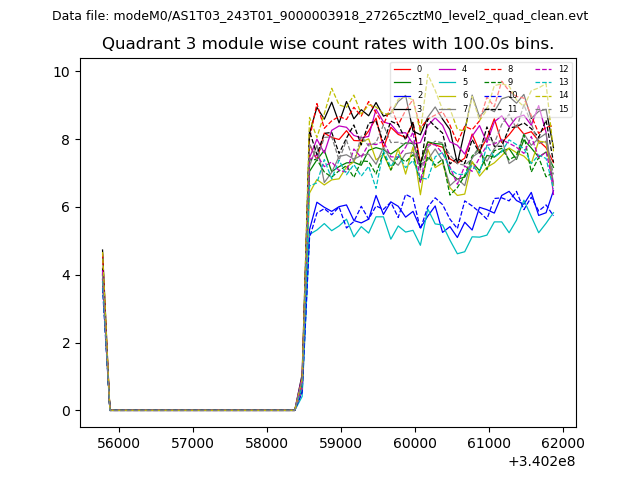 |
 |
| Parameter | Plot |
|---|---|
| CZT HV Monitor | 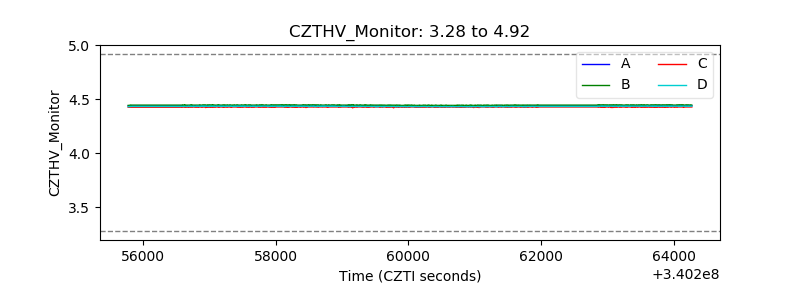 |
| D_VDD | 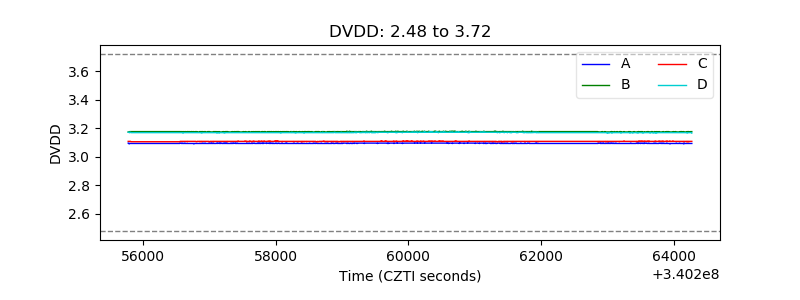 |
| Temperature 1 | 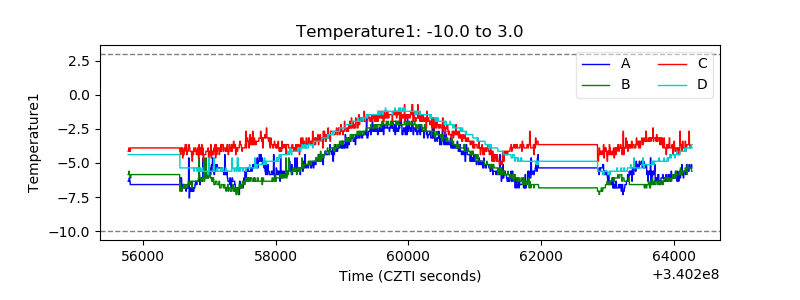 |
| Veto HV Monitor |  |
| Veto LLD | 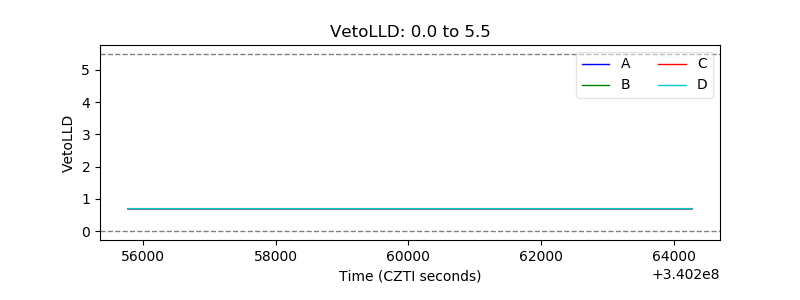 |
| Alpha Counter | 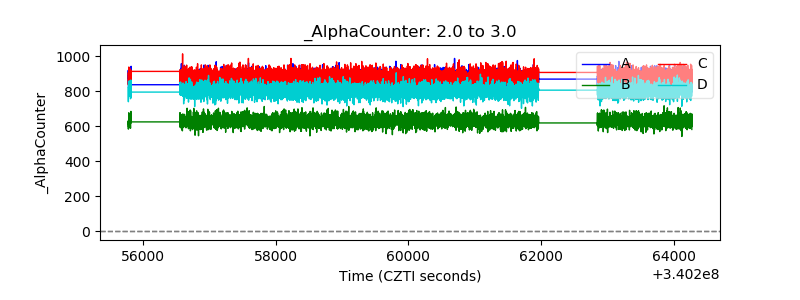 |
| _CPM_Rate | 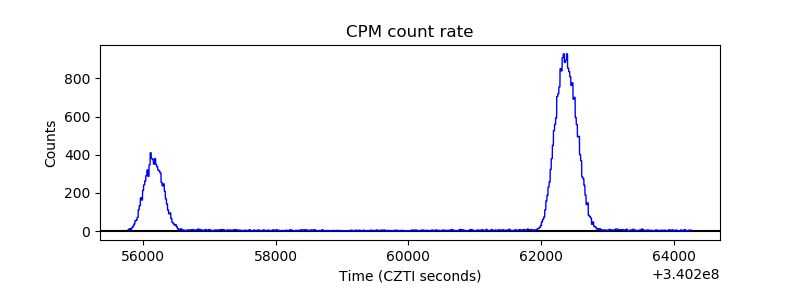 |
| CZT Counter | 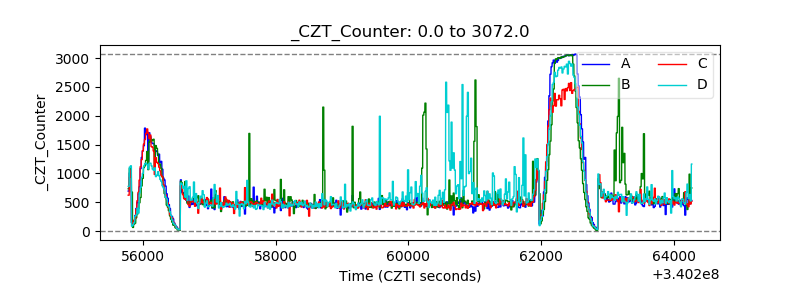 |
| +2.5 Volts monitor | 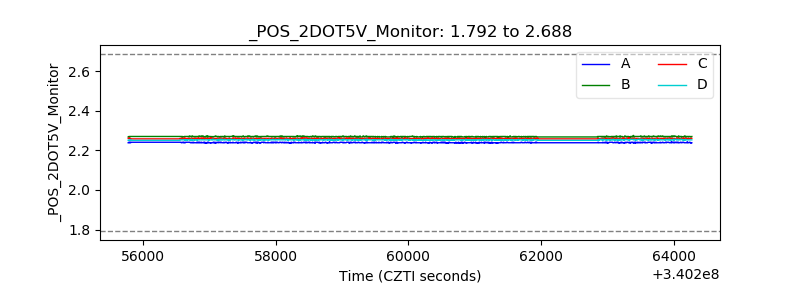 |
| +5 Volts monitor |  |
| _ROLL_ROT | 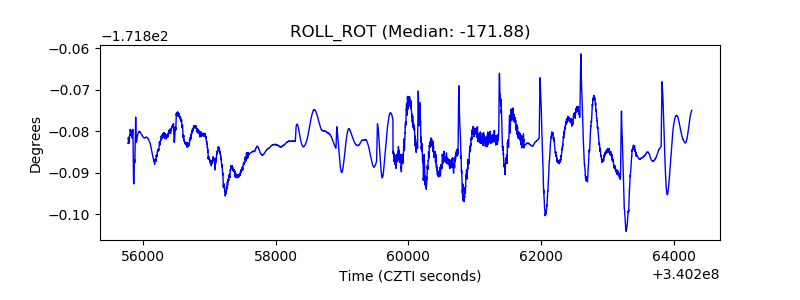 |
| _Roll_DEC | 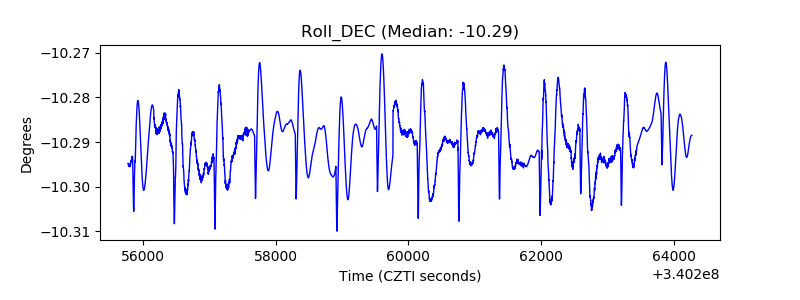 |
| _Roll_RA | 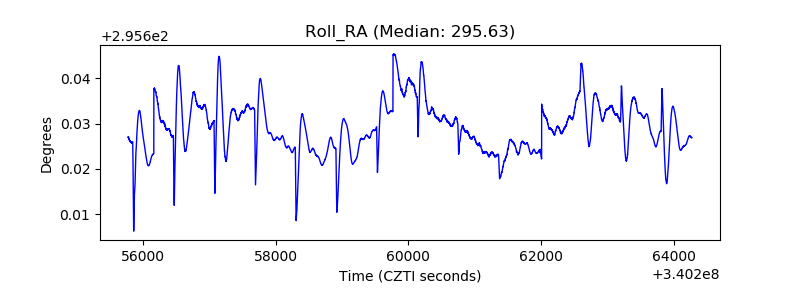 |
| Veto Counter | 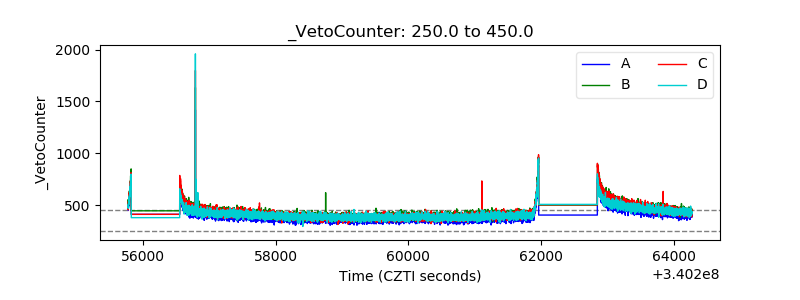 |