| Param | Original file | Final file |
|---|---|---|
| Filename | modeM0/AS1T03_243T01_9000003918_27266cztM0_level2.evt | modeM0/AS1T03_243T01_9000003918_27266cztM0_level2_quad_clean.evt |
| Size (bytes) | 555,563,520 | 80,064,000 |
| Size | 529.8 MB | 76.4 MB |
| Events in quadrant A | 3,337,906 | 503,950 |
| Events in quadrant B | 4,273,199 | 506,882 |
| Events in quadrant C | 3,324,224 | 487,275 |
| Events in quadrant D | 5,441,117 | 464,534 |
| Mode M9 | |||
|---|---|---|---|
| Quadrant | BADHDUFLAG | Total packets | Discarded packets |
| A | 0 | 10 | 0 |
| B | 0 | 10 | 0 |
| C | 0 | 10 | 0 |
| D | 0 | 10 | 0 |
| Mode M0 | |||
|---|---|---|---|
| Quadrant | BADHDUFLAG | Total packets | Discarded packets |
| A | 0 | 13999 | 0 |
| B | 0 | 16943 | 0 |
| C | 0 | 13968 | 0 |
| D | 0 | 20738 | 0 |
| Quadrant | Total seconds | Saturated seconds | Saturation percentage |
|---|---|---|---|
| A | 6617 | 63 | 0.952093% |
| B | 6617 | 276 | 4.171075% |
| C | 6617 | 120 | 1.813511% |
| D | 6617 | 397 | 5.999698% |
Noise dominated data is calculated using 1-second bins in cleaned event files. If a bin has >2000 counts, and if more than 50% of those come from <1% of pixels, then it is considered to be noise-dominated and hence unusable.
| Quadrant | # 1 sec bins | Bins with >0 counts | Bins with >2000 counts | High rate bins dominated by noise | Noise dominated (total time) | Noise dominated (detector-on time) | Marked lightcurve |
|---|---|---|---|---|---|---|---|
| A | 7652 | 6618 | 0 | 0 | 0.00% | 0.00% |  |
| B | 7652 | 6618 | 112 | 112 | 1.46% | 1.69% |  |
| C | 7652 | 6618 | 0 | 0 | 0.00% | 0.00% |  |
| D | 7652 | 6617 | 225 | 225 | 2.94% | 3.40% |  |
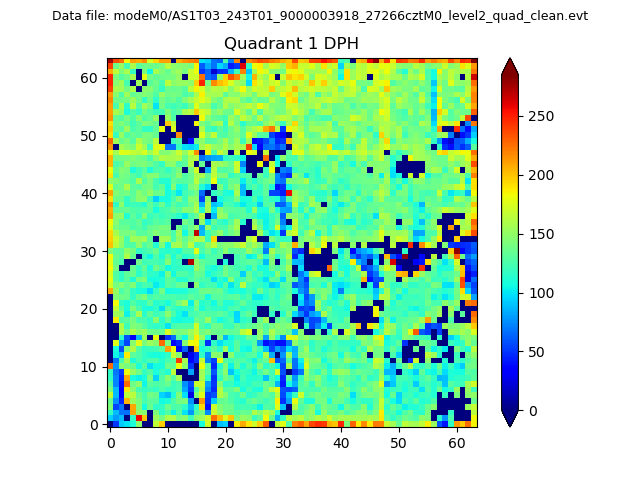
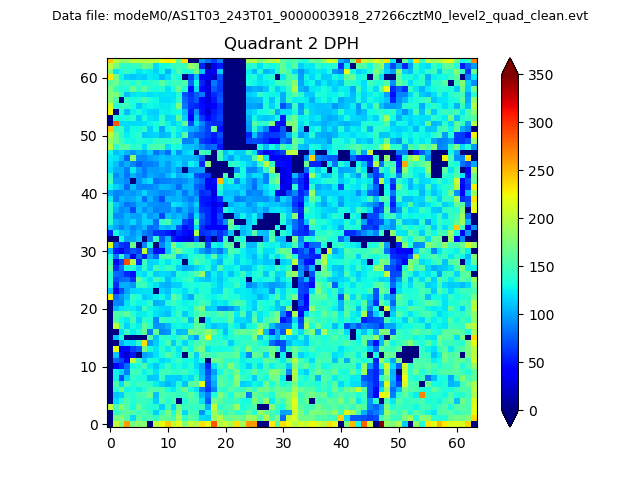
Top three noisy pixels from each quadrant. If the there are fewer than three noisy pixels in the level2.evt file, extra rows are filled as -1
| Pixel properties | Quadrant properties | ||||||
|---|---|---|---|---|---|---|---|
| Quadrant | DetID | PixID | Counts | Sigma | Mean | Median | Sigma |
| A | 8 | 192 | 9947 | 52.87 | 863 | 846 | 172.1 |
| A | 13 | 254 | 9907 | 52.64 | 863 | 846 | 172.1 |
| A | 3 | 137 | 8035 | 41.77 | 863 | 846 | 172.1 |
| B | 10 | 245 | 694250 | 4269.45 | 847 | 825 | 162.4 |
| B | 3 | 64 | 232337 | 1425.43 | 847 | 825 | 162.4 |
| B | 12 | 111 | 19659 | 115.96 | 847 | 825 | 162.4 |
| C | 14 | 238 | 133823 | 694.79 | 819 | 823 | 191.4 |
| C | 13 | 61 | 5551 | 24.7 | 819 | 823 | 191.4 |
| C | 15 | 78 | 2017 | 6.23 | 819 | 823 | 191.4 |
| D | 1 | 52 | 2307749 | 11288.32 | 810 | 793 | 204.4 |
| D | 2 | 250 | 38717 | 185.57 | 810 | 793 | 204.4 |
| D | 2 | 234 | 24408 | 115.55 | 810 | 793 | 204.4 |
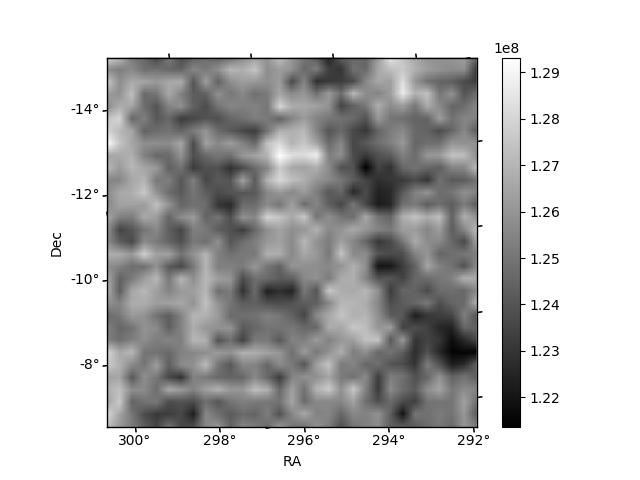
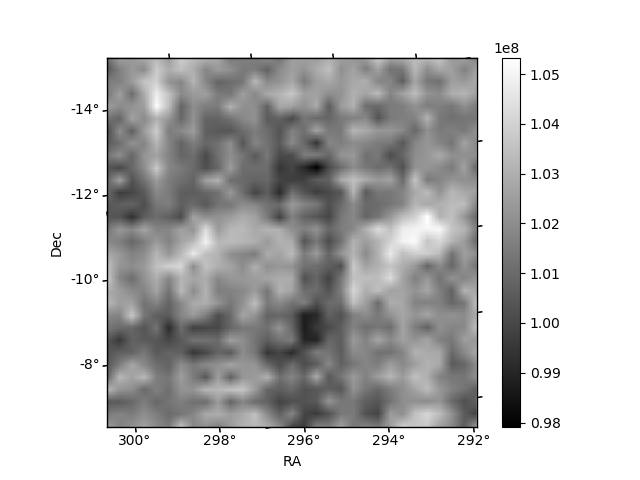
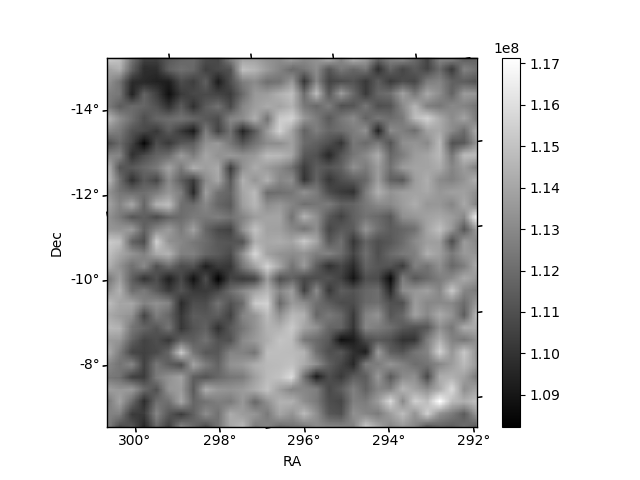
Histogram calculated using DETX and DETY for each event in the final _common_clean file
| Quadrant A |  |
 |
Quadrant B |
|---|---|---|---|
| Quadrant D | 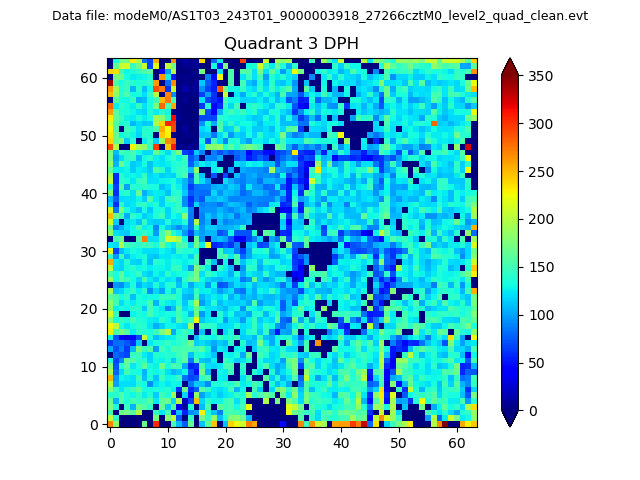 |
 |
Quadrant C |
| Plot type | Count rate plots | Images |
|---|---|---|
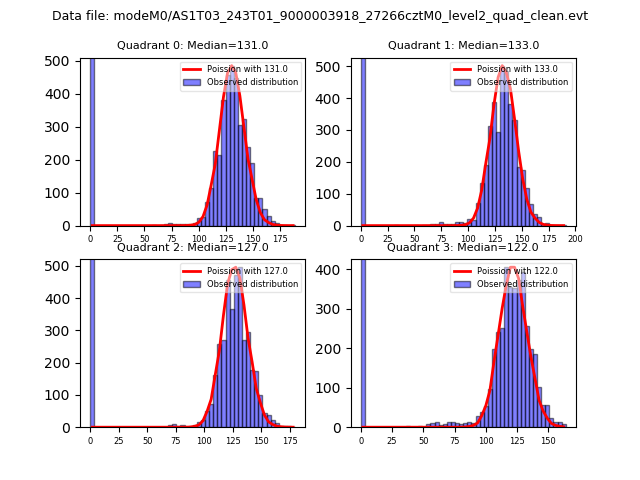
| Comparison with Poisson distribution Blue bars denote a histogram of data divided into 1 sec bins. Red curve is a Poisson curve with rate = median count rate of data. |
 |
 |
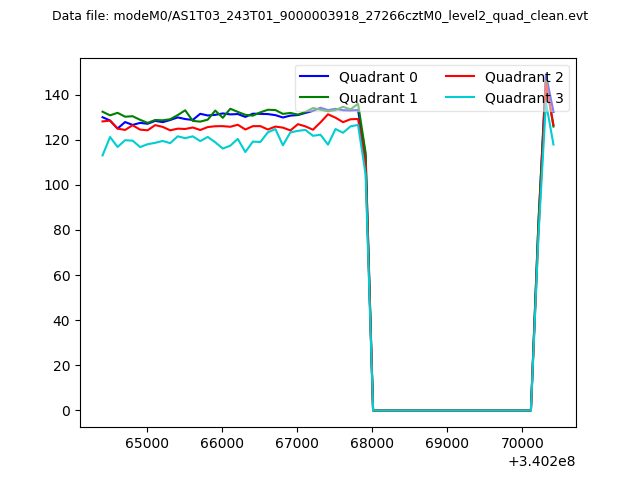
| Quadrant-wise count rates Data is divided into 100 sec bins |
 |
|
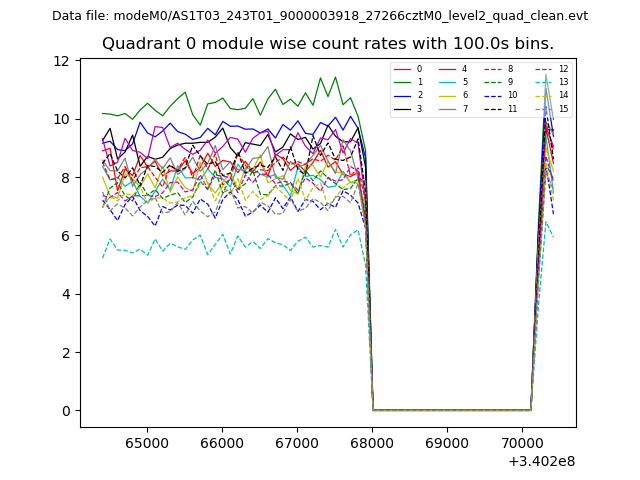
| Module-wise count rates for Quadrant A Data is divided into 100 sec bins |
 |
 |
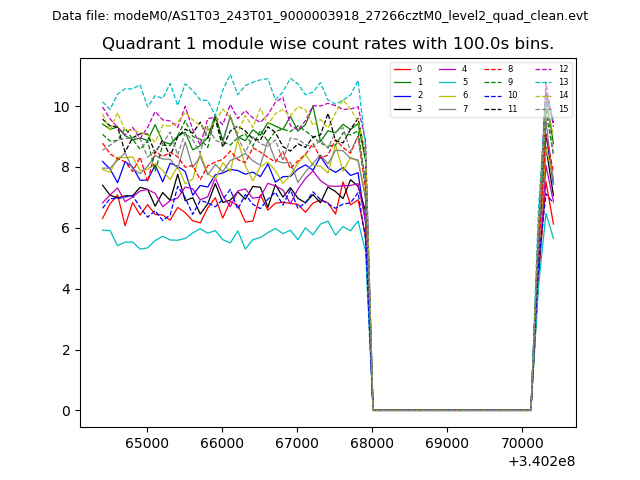
| Module-wise count rates for Quadrant B Data is divided into 100 sec bins |
 |
 |
| Module-wise count rates for Quadrant C Data is divided into 100 sec bins |
 |
 |
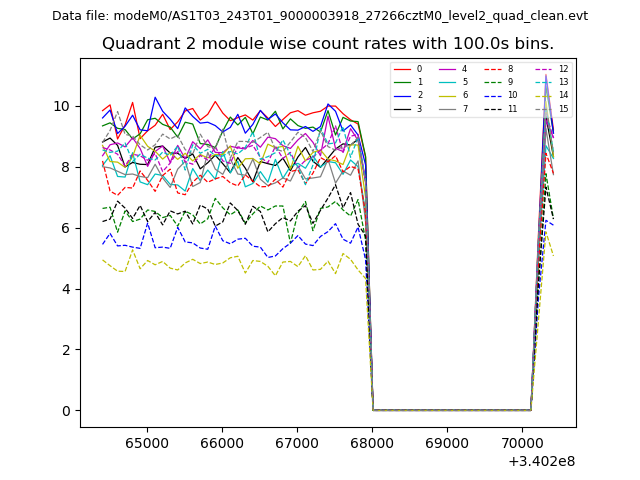
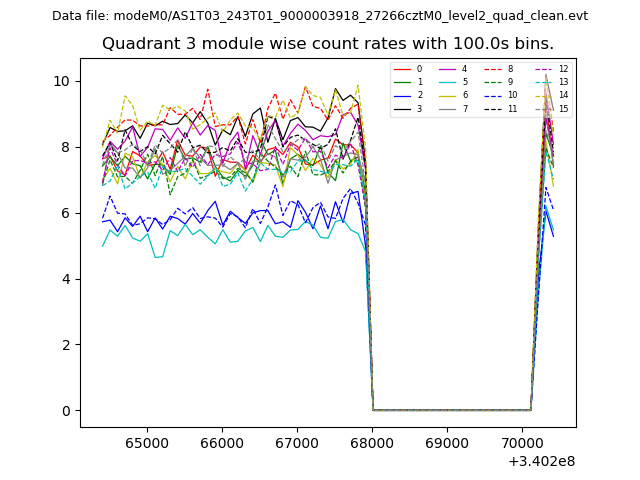
| Module-wise count rates for Quadrant D Data is divided into 100 sec bins |
 |
 |
| Parameter | Plot |
|---|---|
| CZT HV Monitor | 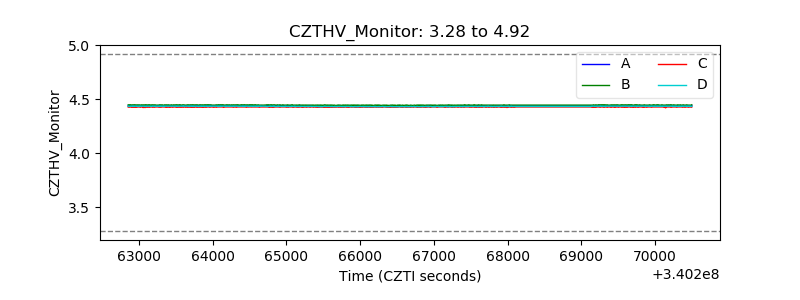 |
| D_VDD | 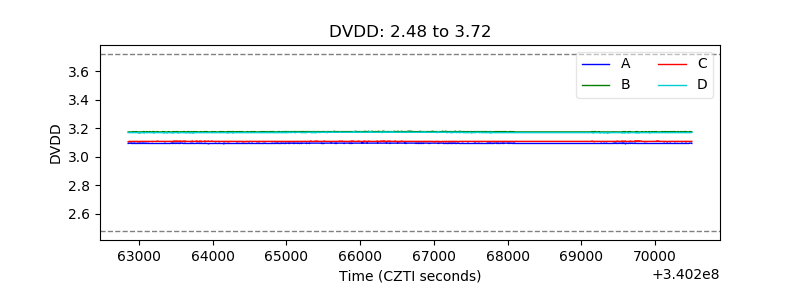 |
| Temperature 1 | 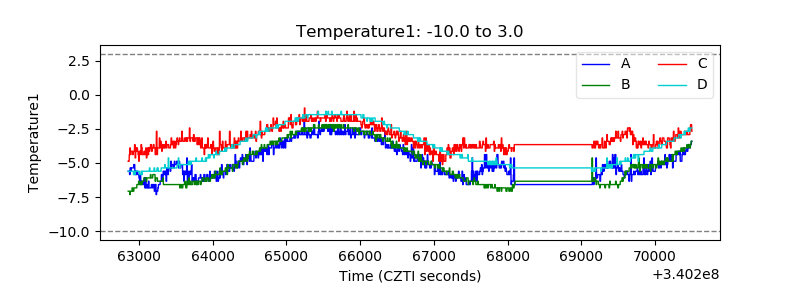 |
| Veto HV Monitor | 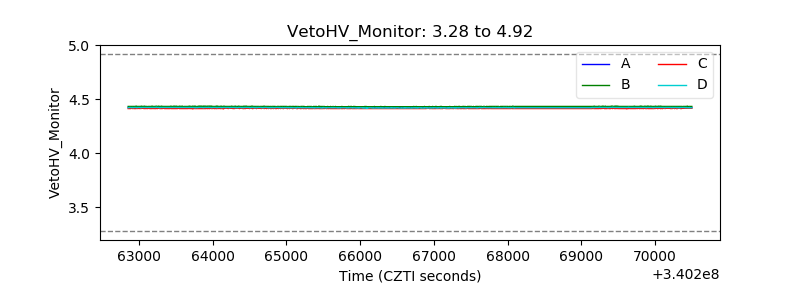 |
| Veto LLD | 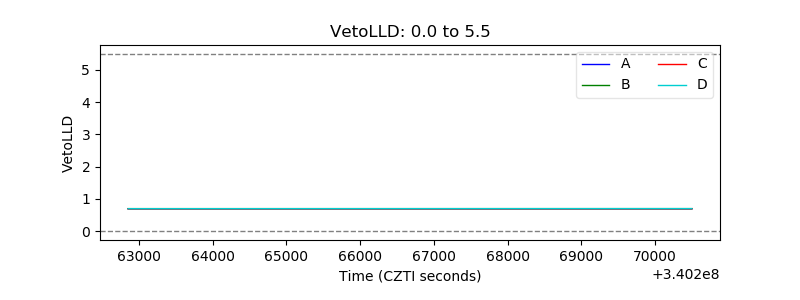 |
| Alpha Counter | 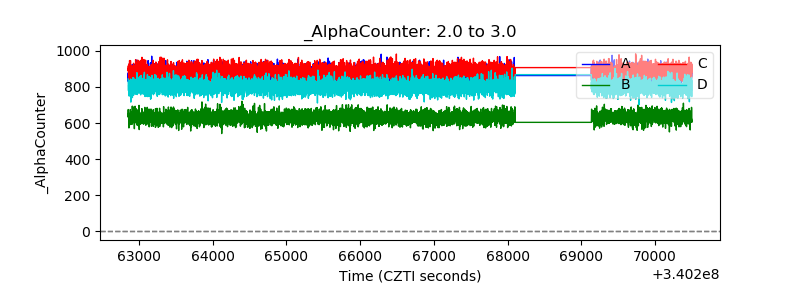 |
| _CPM_Rate | 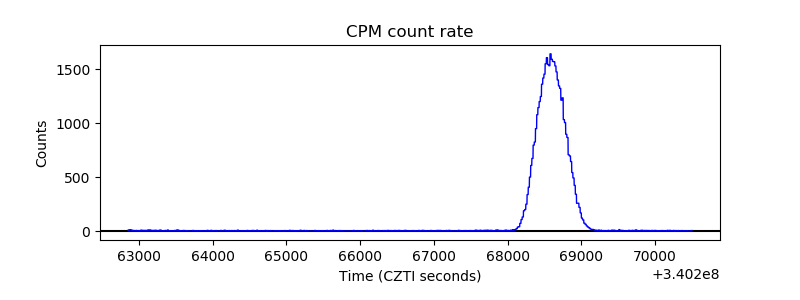 |
| CZT Counter |  |
| +2.5 Volts monitor |  |
| +5 Volts monitor |  |
| _ROLL_ROT | 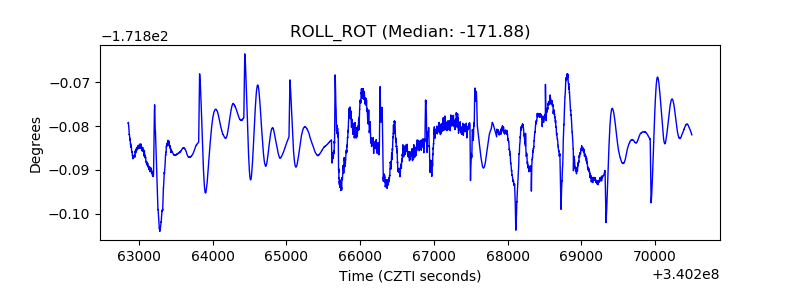 |
| _Roll_DEC | 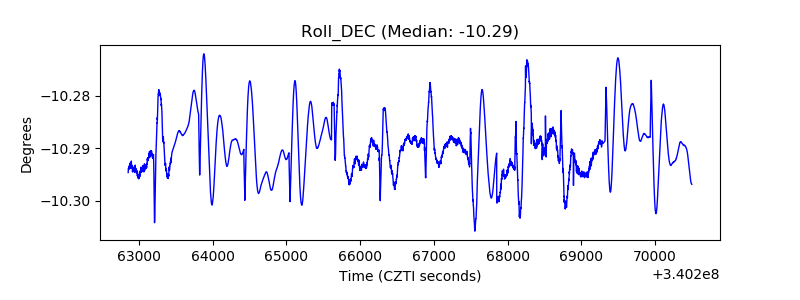 |
| _Roll_RA | 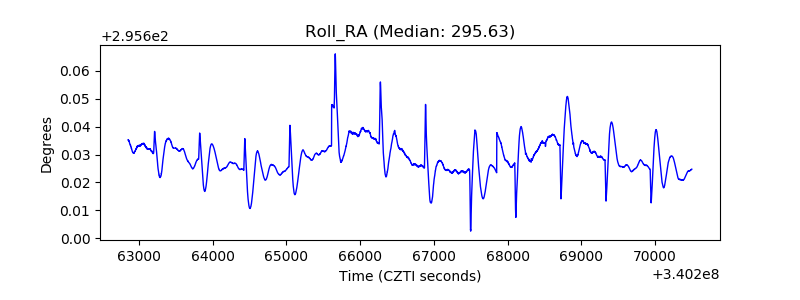 |
| Veto Counter |  |