| Param | Original file | Final file |
|---|---|---|
| Filename | modeM0/AS1T03_243T01_9000003918_27268cztM0_level2.evt | modeM0/AS1T03_243T01_9000003918_27268cztM0_level2_quad_clean.evt |
| Size (bytes) | 532,676,160 | 92,148,480 |
| Size | 508.0 MB | 87.9 MB |
| Events in quadrant A | 3,308,060 | 607,999 |
| Events in quadrant B | 5,038,491 | 590,885 |
| Events in quadrant C | 3,264,638 | 578,869 |
| Events in quadrant D | 4,097,139 | 576,418 |
| Mode M9 | |||
|---|---|---|---|
| Quadrant | BADHDUFLAG | Total packets | Discarded packets |
| A | 0 | 12 | 0 |
| B | 0 | 12 | 0 |
| C | 0 | 12 | 0 |
| D | 0 | 12 | 0 |
| Mode M0 | |||
|---|---|---|---|
| Quadrant | BADHDUFLAG | Total packets | Discarded packets |
| A | 0 | 13860 | 0 |
| B | 0 | 19361 | 0 |
| C | 0 | 13720 | 0 |
| D | 0 | 16400 | 0 |
| Quadrant | Total seconds | Saturated seconds | Saturation percentage |
|---|---|---|---|
| A | 6256 | 46 | 0.735294% |
| B | 6257 | 485 | 7.751319% |
| C | 6257 | 77 | 1.230622% |
| D | 6257 | 188 | 3.004635% |
Noise dominated data is calculated using 1-second bins in cleaned event files. If a bin has >2000 counts, and if more than 50% of those come from <1% of pixels, then it is considered to be noise-dominated and hence unusable.
| Quadrant | # 1 sec bins | Bins with >0 counts | Bins with >2000 counts | High rate bins dominated by noise | Noise dominated (total time) | Noise dominated (detector-on time) | Marked lightcurve |
|---|---|---|---|---|---|---|---|
| A | 7451 | 6257 | 1 | 1 | 0.01% | 0.02% | 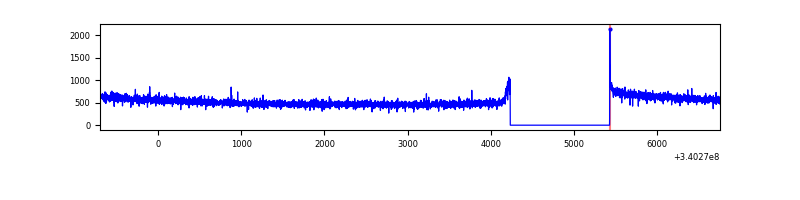 |
| B | 7452 | 6258 | 301 | 301 | 4.04% | 4.81% | 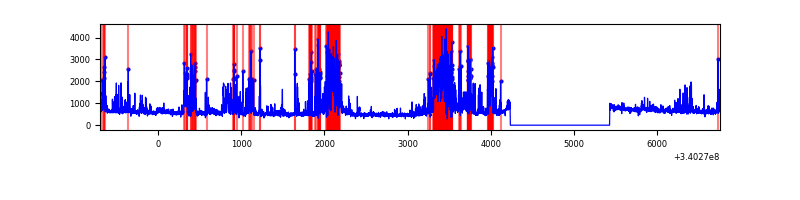 |
| C | 7452 | 6258 | 0 | 0 | 0.00% | 0.00% | 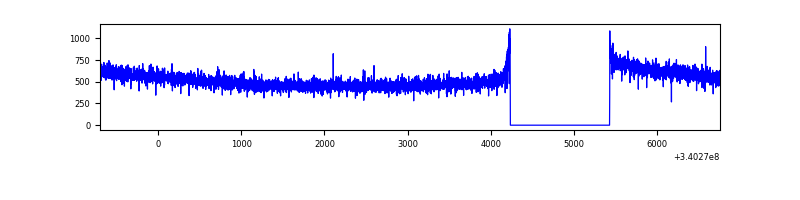 |
| D | 7452 | 6258 | 96 | 96 | 1.29% | 1.53% | 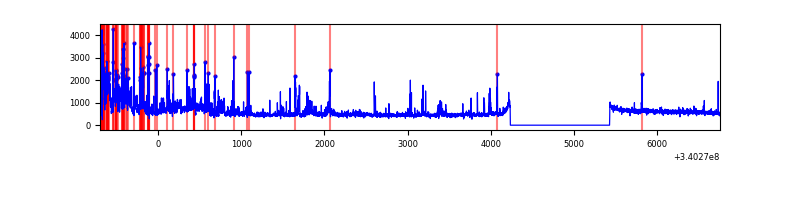 |
Top three noisy pixels from each quadrant. If the there are fewer than three noisy pixels in the level2.evt file, extra rows are filled as -1
| Pixel properties | Quadrant properties | ||||||
|---|---|---|---|---|---|---|---|
| Quadrant | DetID | PixID | Counts | Sigma | Mean | Median | Sigma |
| A | 13 | 254 | 8858 | 46.98 | 856 | 841 | 170.6 |
| A | 3 | 137 | 7585 | 39.52 | 856 | 841 | 170.6 |
| A | 0 | 226 | 7341 | 38.09 | 856 | 841 | 170.6 |
| B | 10 | 245 | 1643104 | 10506.2 | 827 | 808 | 156.3 |
| B | 3 | 64 | 137563 | 874.86 | 827 | 808 | 156.3 |
| B | 12 | 111 | 18375 | 112.38 | 827 | 808 | 156.3 |
| C | 14 | 238 | 130415 | 692.94 | 804 | 812 | 187.0 |
| C | 13 | 61 | 5398 | 24.52 | 804 | 812 | 187.0 |
| C | 3 | 233 | 2651 | 9.83 | 804 | 812 | 187.0 |
| D | 1 | 52 | 899716 | 4474.79 | 810 | 791 | 200.9 |
| D | 12 | 233 | 83300 | 410.72 | 810 | 791 | 200.9 |
| D | 2 | 250 | 29155 | 141.19 | 810 | 791 | 200.9 |
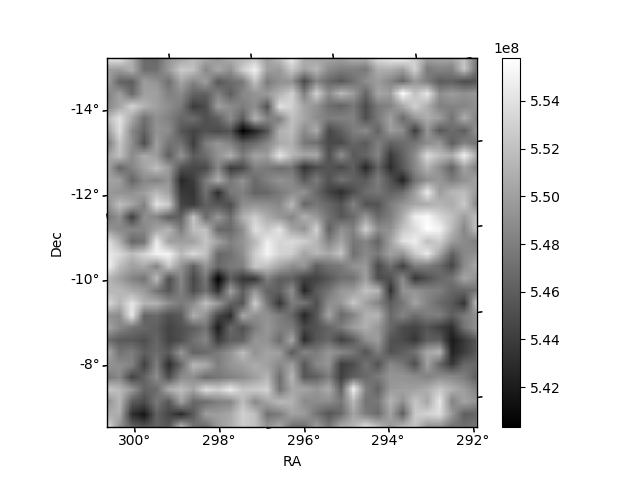
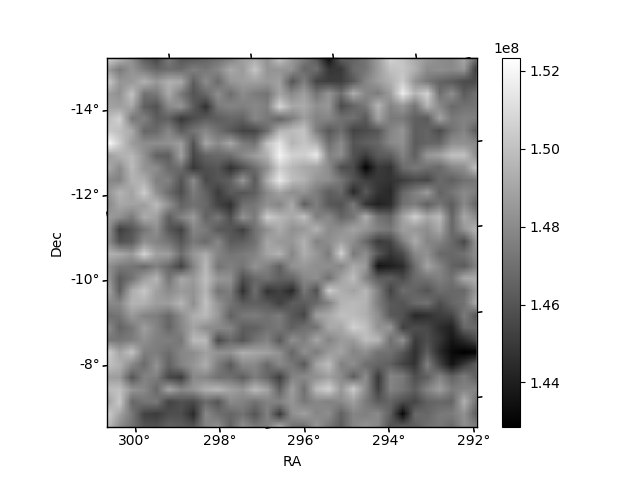
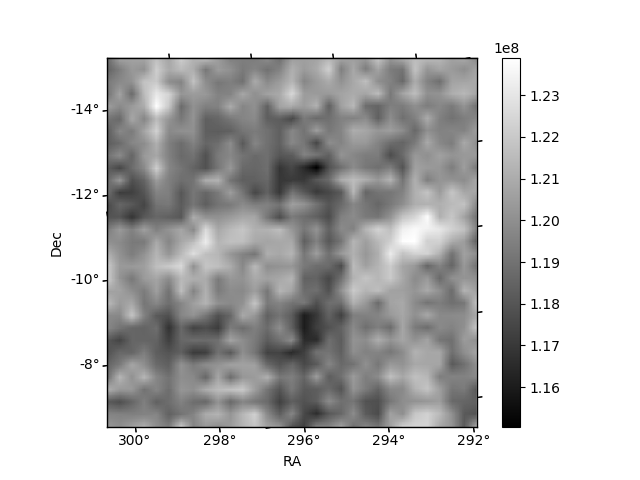
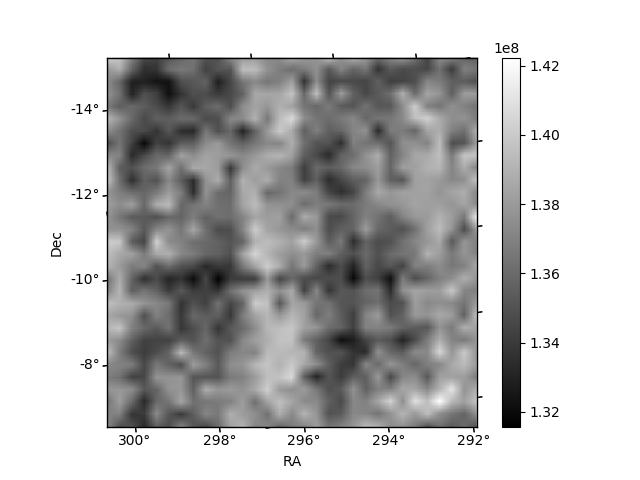
Histogram calculated using DETX and DETY for each event in the final _common_clean file
| Quadrant A | 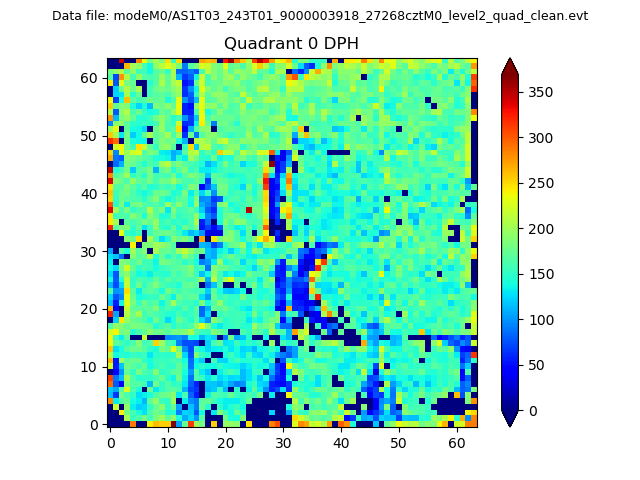 |
 |
Quadrant B |
|---|---|---|---|
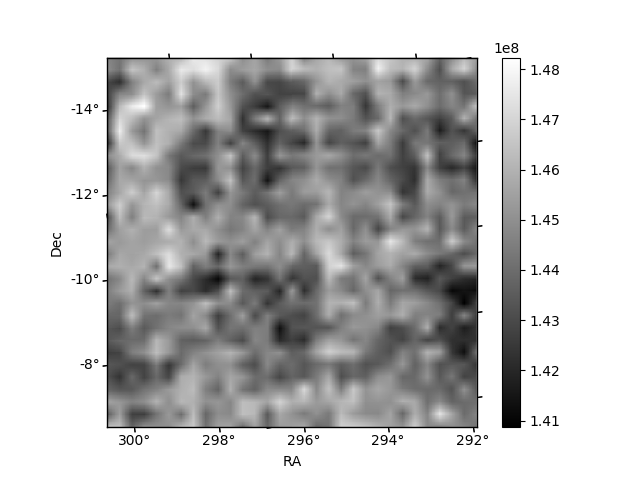
| Quadrant D | 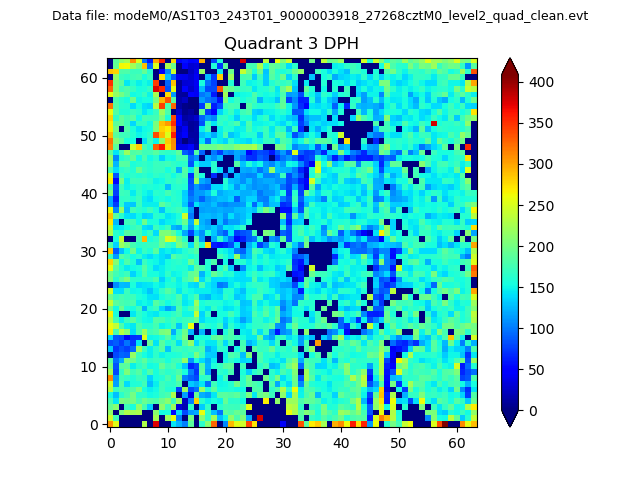 |
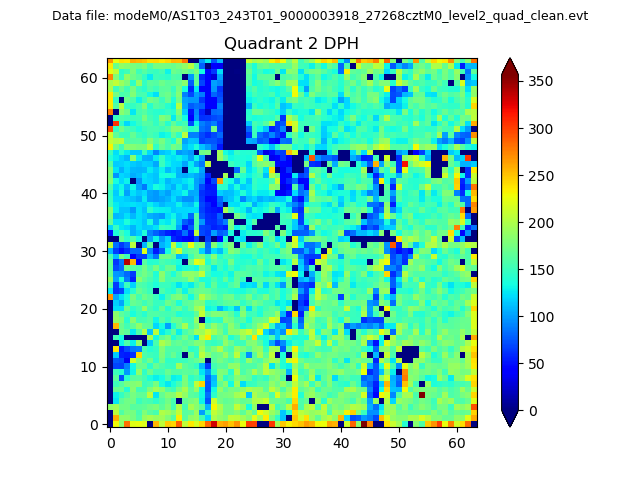 |
Quadrant C |
| Plot type | Count rate plots | Images |
|---|---|---|
| Comparison with Poisson distribution Blue bars denote a histogram of data divided into 1 sec bins. Red curve is a Poisson curve with rate = median count rate of data. |
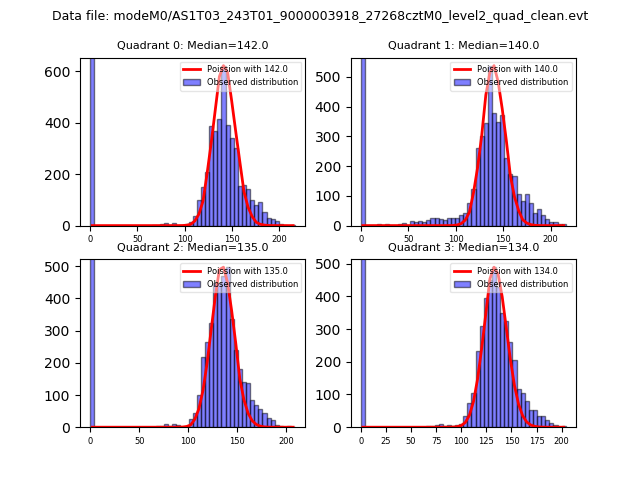 |
 |
| Quadrant-wise count rates Data is divided into 100 sec bins |
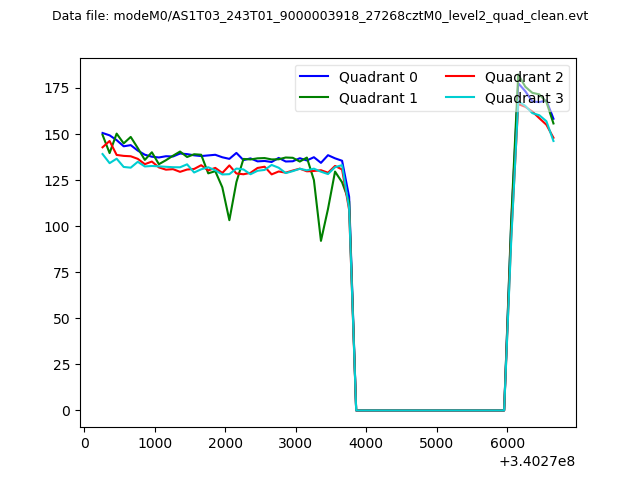 |
|
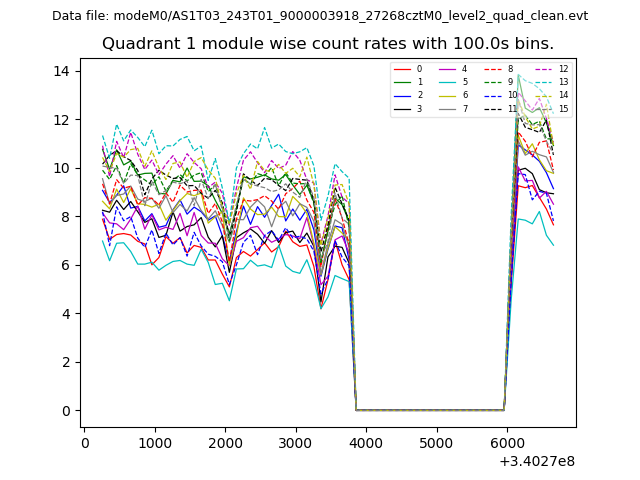
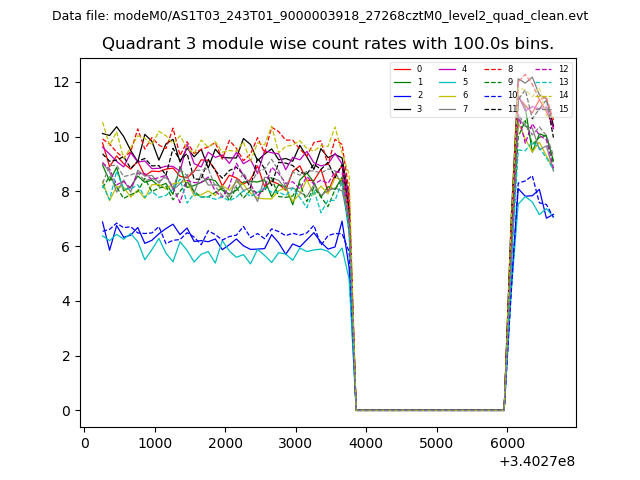
| Module-wise count rates for Quadrant A Data is divided into 100 sec bins |
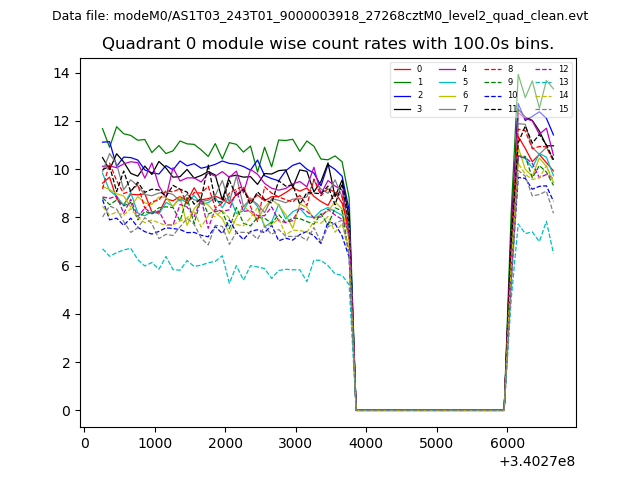 |
 |
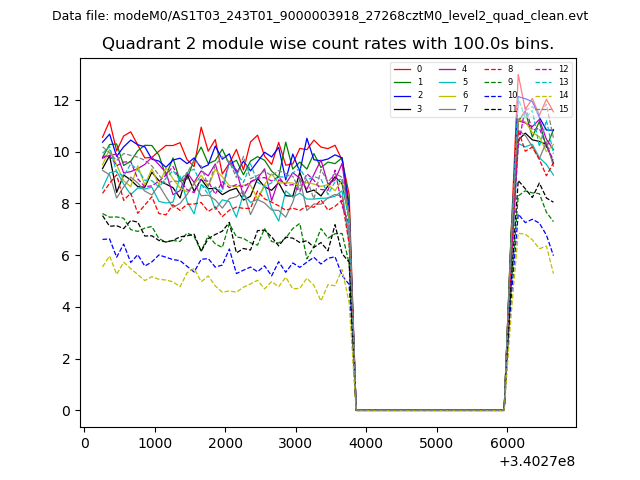
| Module-wise count rates for Quadrant B Data is divided into 100 sec bins |
 |
 |
| Module-wise count rates for Quadrant C Data is divided into 100 sec bins |
 |
 |
| Module-wise count rates for Quadrant D Data is divided into 100 sec bins |
 |
 |
| Parameter | Plot |
|---|---|
| CZT HV Monitor | 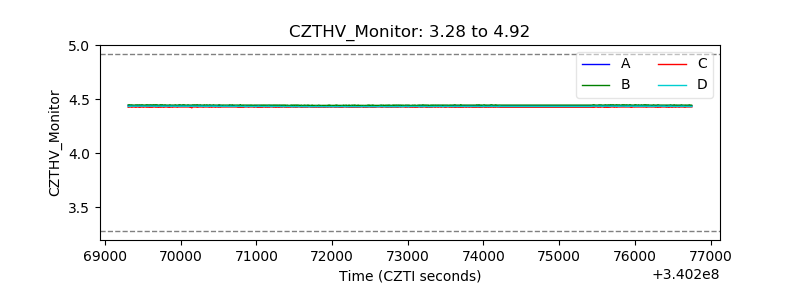 |
| D_VDD | 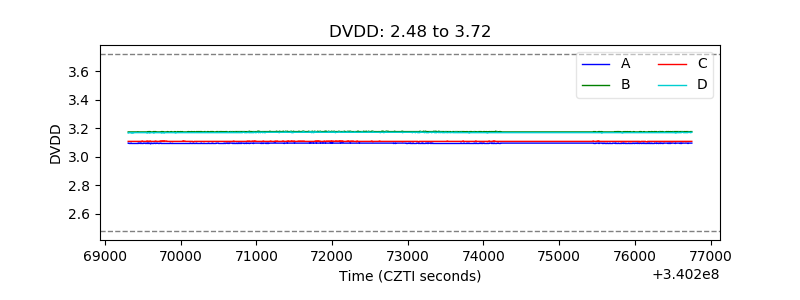 |
| Temperature 1 | 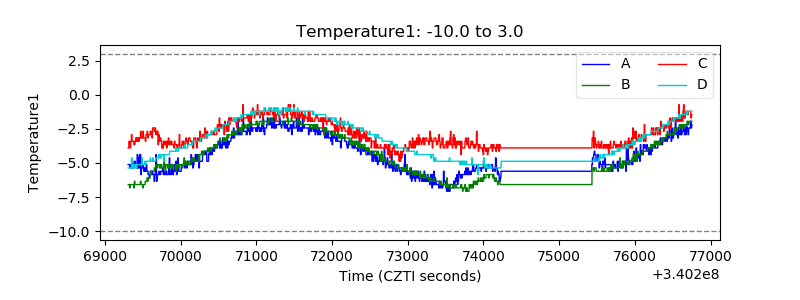 |
| Veto HV Monitor | 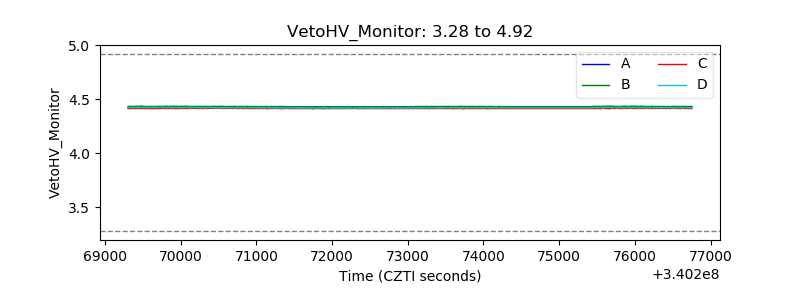 |
| Veto LLD | 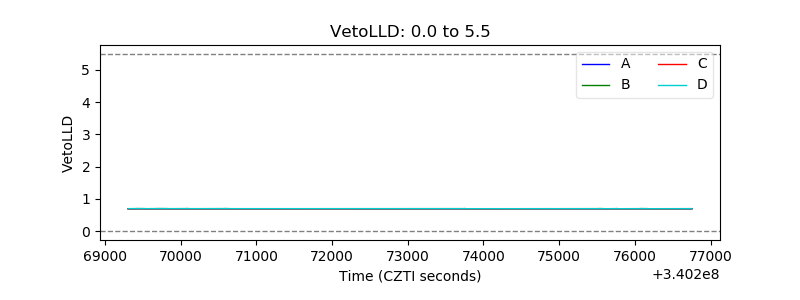 |
| Alpha Counter | 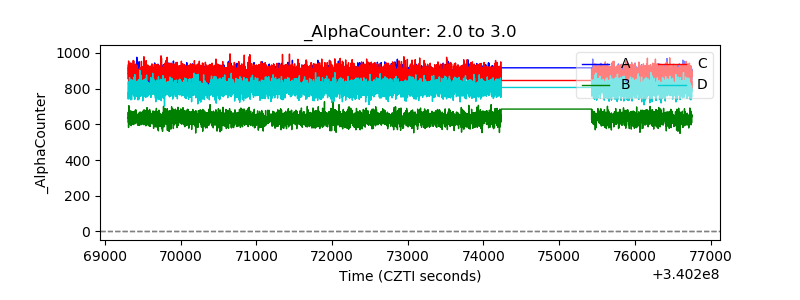 |
| _CPM_Rate |  |
| CZT Counter | 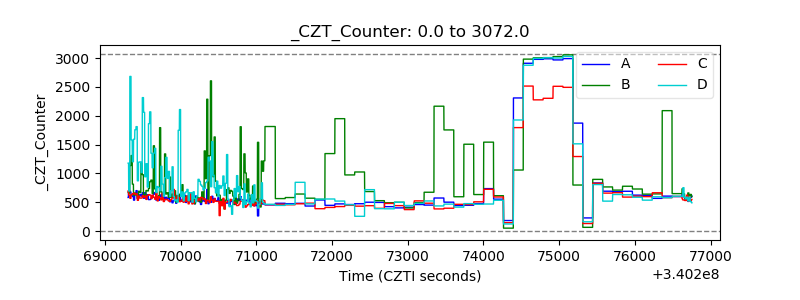 |
| +2.5 Volts monitor |  |
| +5 Volts monitor |  |
| _ROLL_ROT |  |
| _Roll_DEC | 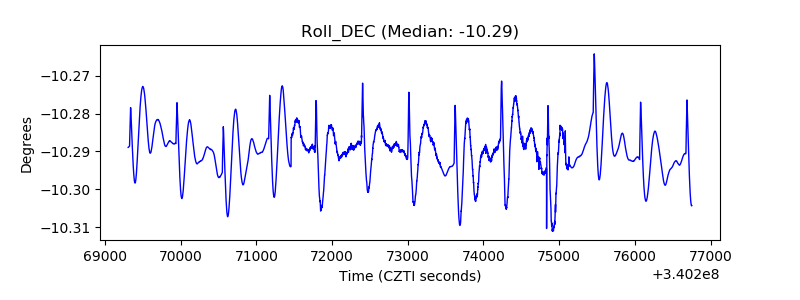 |
| _Roll_RA | 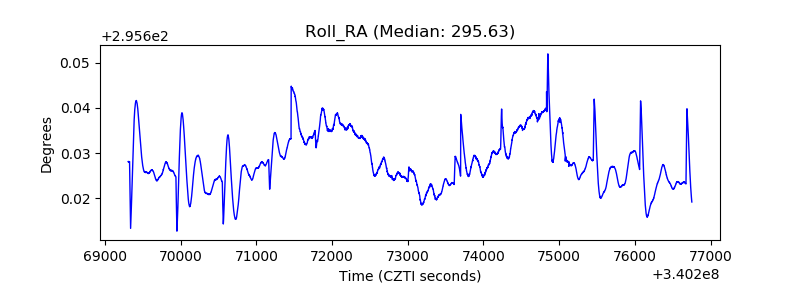 |
| Veto Counter | 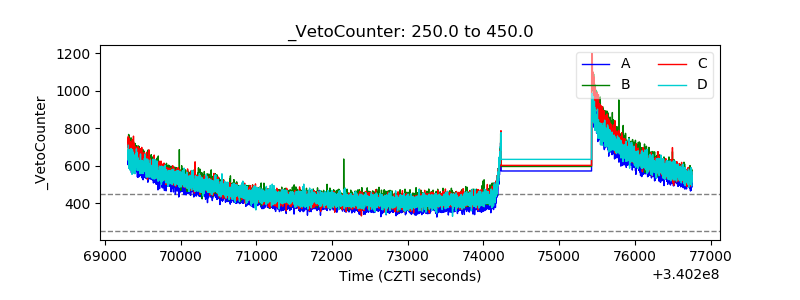 |