| Param | Original file | Final file |
|---|---|---|
| Filename | modeM0/AS1T03_243T01_9000003918_27269cztM0_level2.evt | modeM0/AS1T03_243T01_9000003918_27269cztM0_level2_quad_clean.evt |
| Size (bytes) | 489,309,120 | 105,773,760 |
| Size | 466.6 MB | 100.9 MB |
| Events in quadrant A | 3,054,257 | 732,084 |
| Events in quadrant B | 5,093,730 | 702,448 |
| Events in quadrant C | 2,973,863 | 690,541 |
| Events in quadrant D | 3,319,065 | 688,507 |
| Mode M9 | |||
|---|---|---|---|
| Quadrant | BADHDUFLAG | Total packets | Discarded packets |
| A | 0 | 13 | 0 |
| B | 0 | 13 | 0 |
| C | 0 | 13 | 0 |
| D | 0 | 13 | 0 |
| Mode M0 | |||
|---|---|---|---|
| Quadrant | BADHDUFLAG | Total packets | Discarded packets |
| A | 0 | 12674 | 0 |
| B | 0 | 19067 | 0 |
| C | 0 | 12378 | 0 |
| D | 0 | 13433 | 0 |
| Quadrant | Total seconds | Saturated seconds | Saturation percentage |
|---|---|---|---|
| A | 5577 | 92 | 1.649632% |
| B | 5577 | 564 | 10.112964% |
| C | 5577 | 114 | 2.044110% |
| D | 5577 | 128 | 2.295141% |
Noise dominated data is calculated using 1-second bins in cleaned event files. If a bin has >2000 counts, and if more than 50% of those come from <1% of pixels, then it is considered to be noise-dominated and hence unusable.
| Quadrant | # 1 sec bins | Bins with >0 counts | Bins with >2000 counts | High rate bins dominated by noise | Noise dominated (total time) | Noise dominated (detector-on time) | Marked lightcurve |
|---|---|---|---|---|---|---|---|
| A | 6837 | 5577 | 1 | 1 | 0.01% | 0.02% | 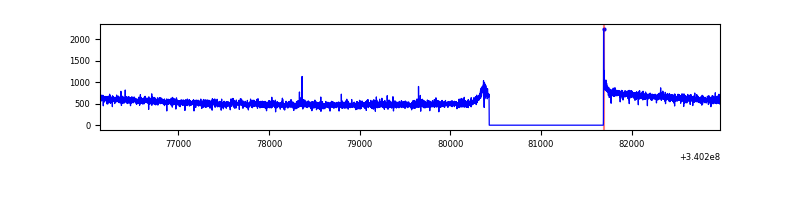 |
| B | 6837 | 5577 | 350 | 350 | 5.12% | 6.28% | 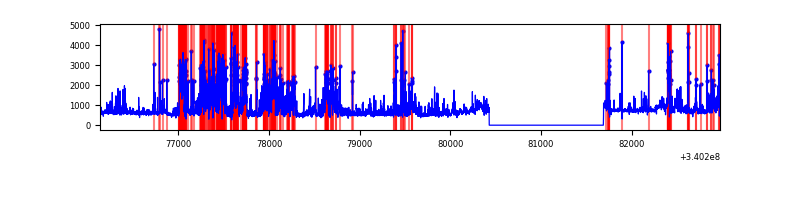 |
| C | 6837 | 5577 | 0 | 0 | 0.00% | 0.00% | 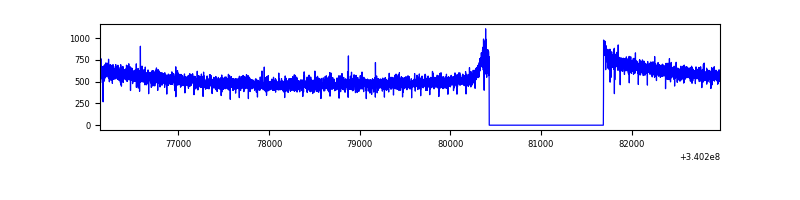 |
| D | 6837 | 5577 | 44 | 44 | 0.64% | 0.79% | 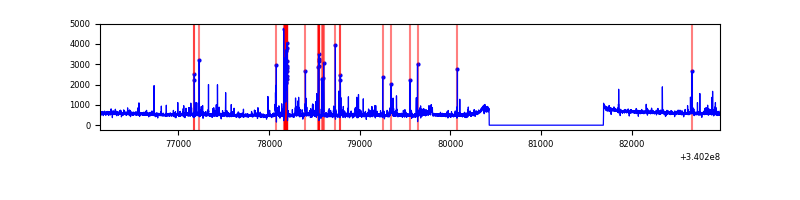 |
Top three noisy pixels from each quadrant. If the there are fewer than three noisy pixels in the level2.evt file, extra rows are filled as -1
| Pixel properties | Quadrant properties | ||||||
|---|---|---|---|---|---|---|---|
| Quadrant | DetID | PixID | Counts | Sigma | Mean | Median | Sigma |
| A | 13 | 254 | 8608 | 50.3 | 788 | 775 | 155.7 |
| A | 12 | 96 | 7758 | 44.84 | 788 | 775 | 155.7 |
| A | 0 | 226 | 6792 | 38.64 | 788 | 775 | 155.7 |
| B | 10 | 245 | 1497376 | 10546.84 | 748 | 731 | 141.9 |
| B | 3 | 64 | 532394 | 3746.62 | 748 | 731 | 141.9 |
| B | 10 | 247 | 111542 | 780.88 | 748 | 731 | 141.9 |
| C | 14 | 238 | 118682 | 696.36 | 732 | 738 | 169.4 |
| C | 13 | 61 | 5035 | 25.37 | 732 | 738 | 169.4 |
| C | 7 | 247 | 2020 | 7.57 | 732 | 738 | 169.4 |
| D | 1 | 52 | 270889 | 1524.18 | 748 | 733 | 177.2 |
| D | 12 | 233 | 128728 | 722.13 | 748 | 733 | 177.2 |
| D | 2 | 250 | 52340 | 291.16 | 748 | 733 | 177.2 |
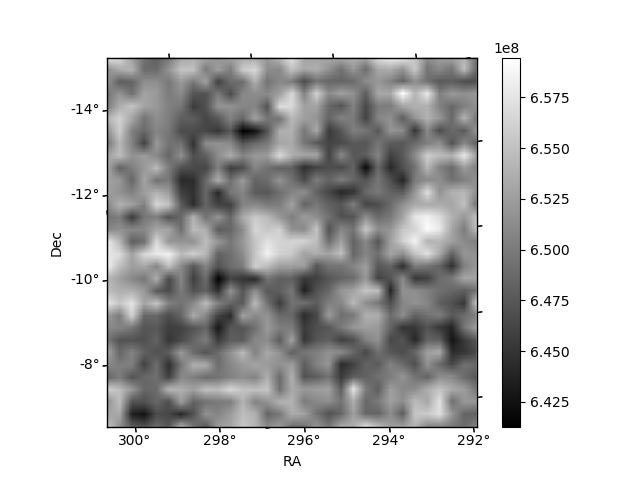
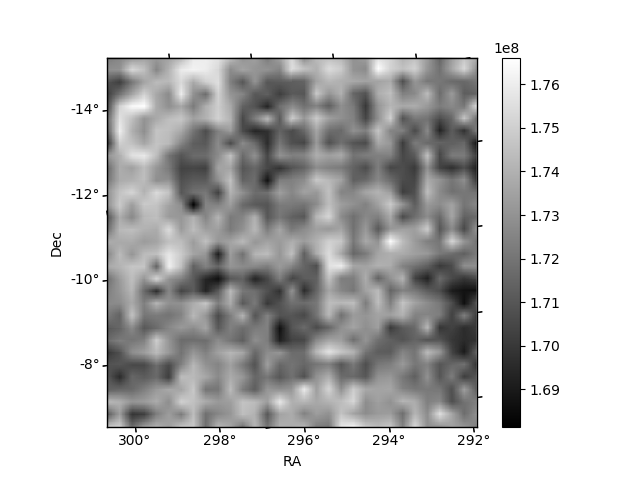
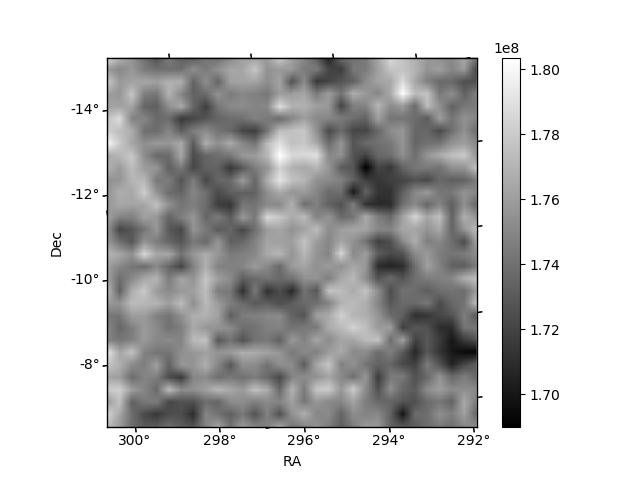
Histogram calculated using DETX and DETY for each event in the final _common_clean file
| Quadrant A | 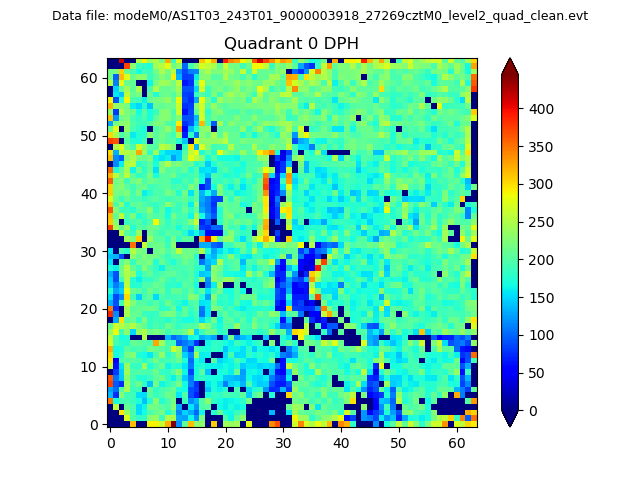 |
 |
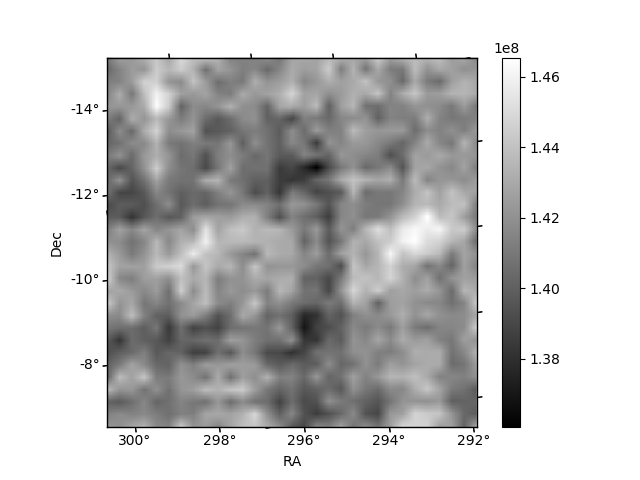
Quadrant B |
|---|---|---|---|
| Quadrant D | 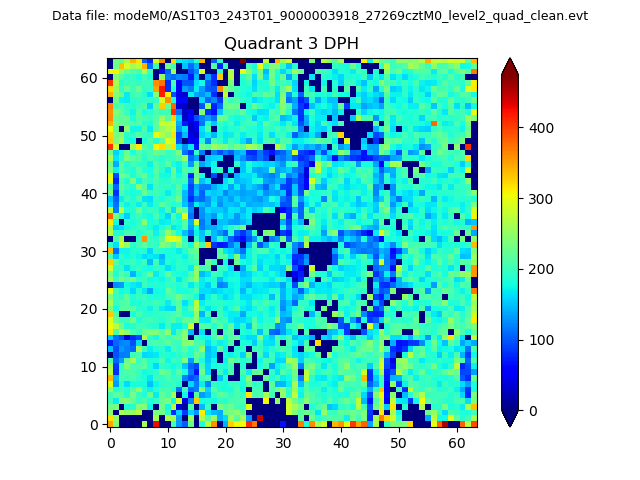 |
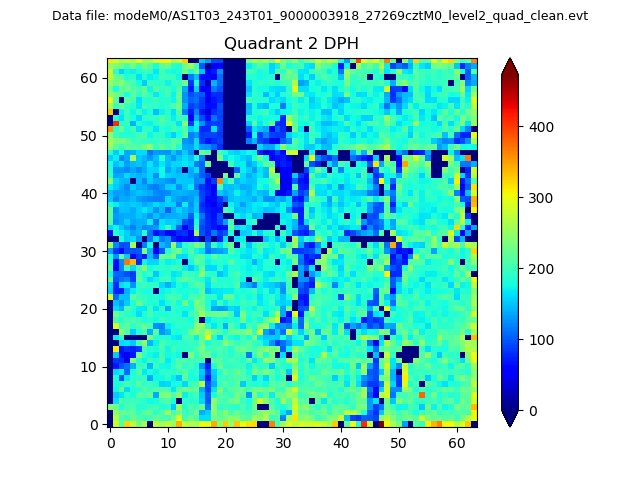 |
Quadrant C |
| Plot type | Count rate plots | Images |
|---|---|---|
| Comparison with Poisson distribution Blue bars denote a histogram of data divided into 1 sec bins. Red curve is a Poisson curve with rate = median count rate of data. |
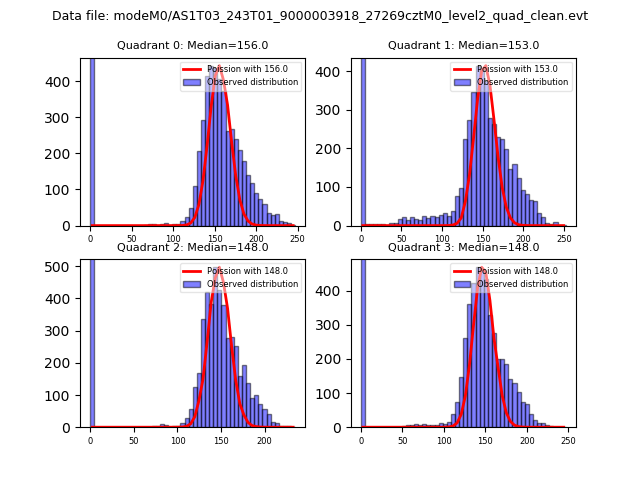 |
 |
| Quadrant-wise count rates Data is divided into 100 sec bins |
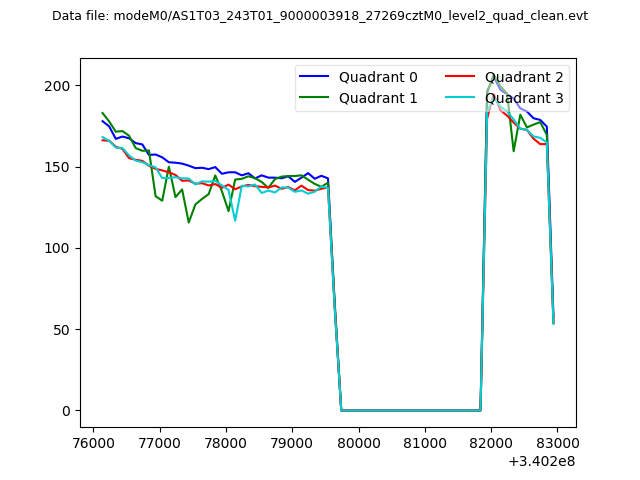 |
|
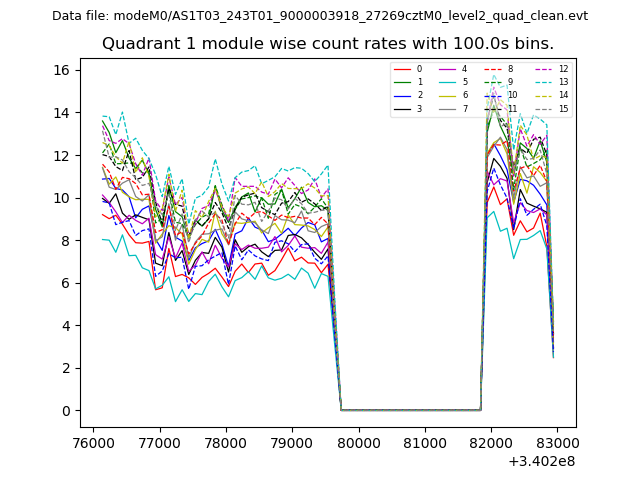
| Module-wise count rates for Quadrant A Data is divided into 100 sec bins |
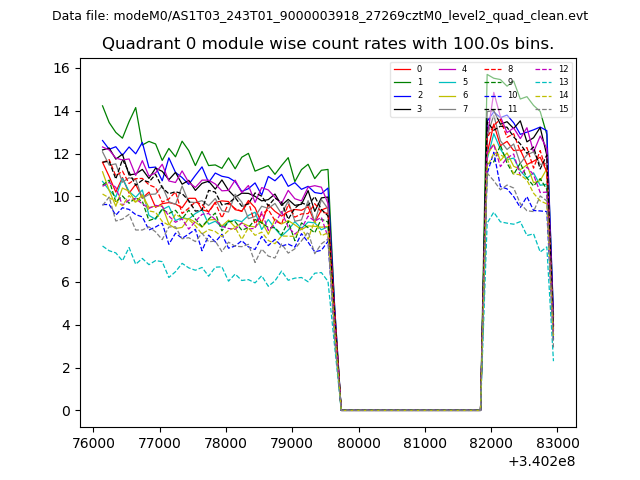 |
 |
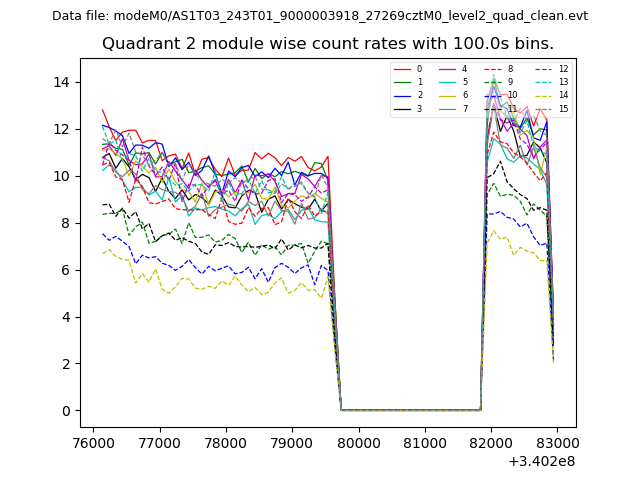
| Module-wise count rates for Quadrant B Data is divided into 100 sec bins |
 |
 |
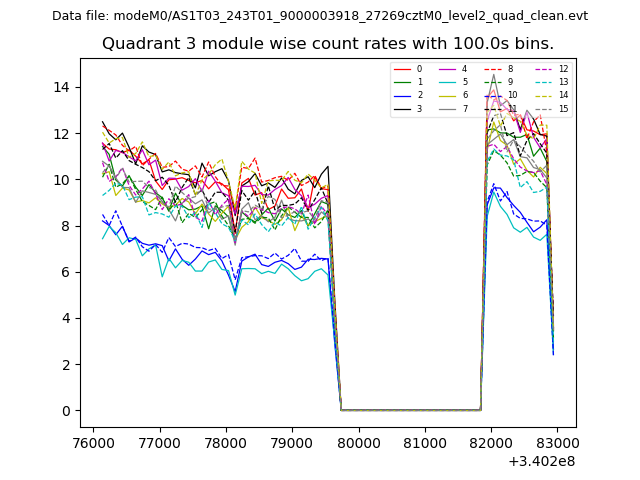
| Module-wise count rates for Quadrant C Data is divided into 100 sec bins |
 |
 |
| Module-wise count rates for Quadrant D Data is divided into 100 sec bins |
 |
 |
| Parameter | Plot |
|---|---|
| CZT HV Monitor | 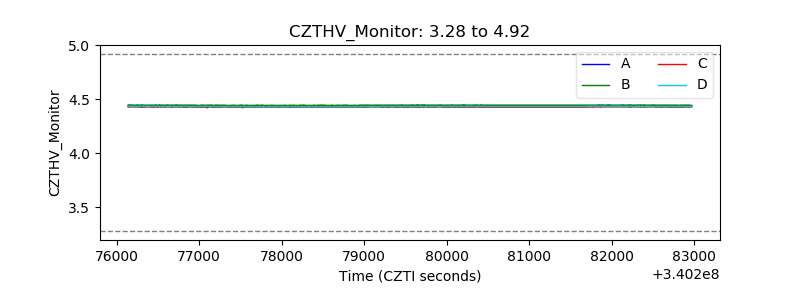 |
| D_VDD | 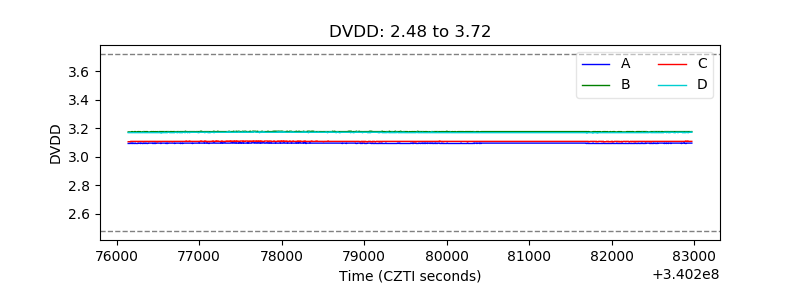 |
| Temperature 1 | 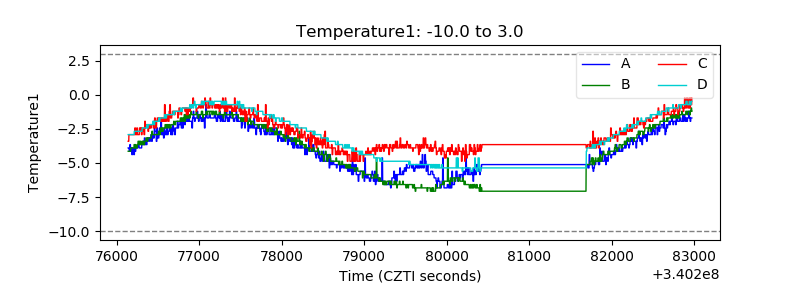 |
| Veto HV Monitor |  |
| Veto LLD | 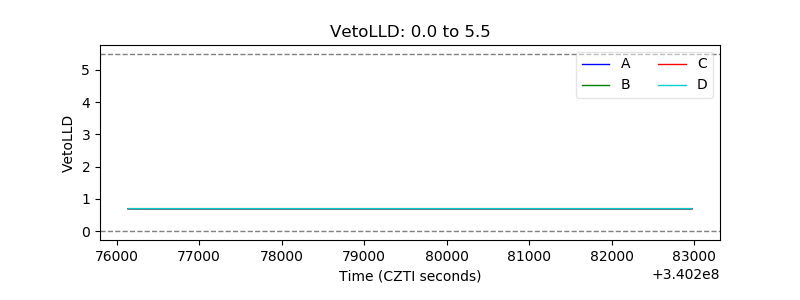 |
| Alpha Counter | 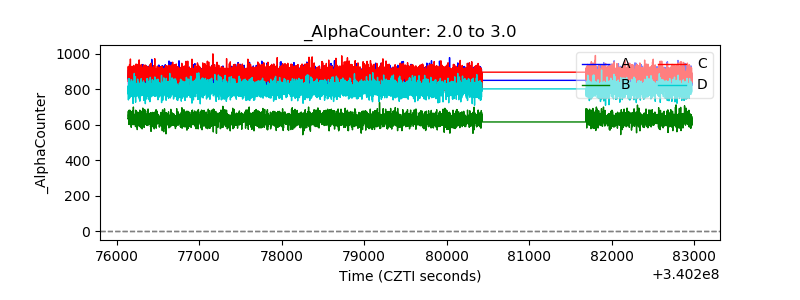 |
| _CPM_Rate | 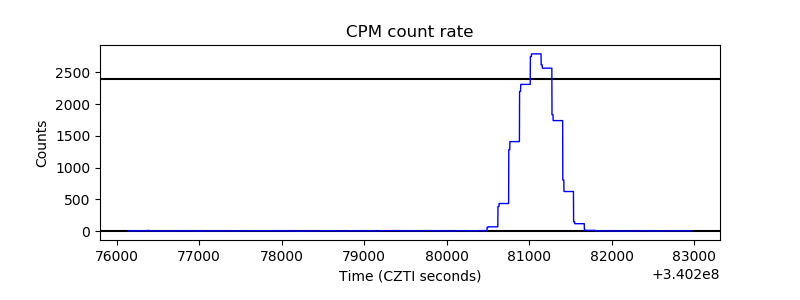 |
| CZT Counter | 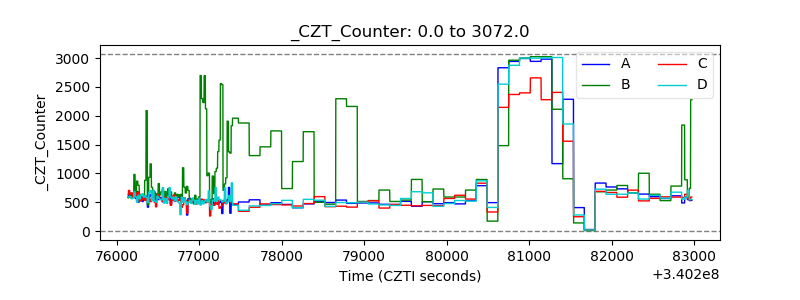 |
| +2.5 Volts monitor | 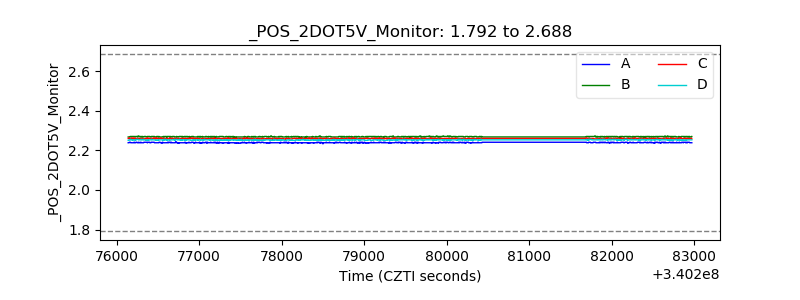 |
| +5 Volts monitor |  |
| _ROLL_ROT | 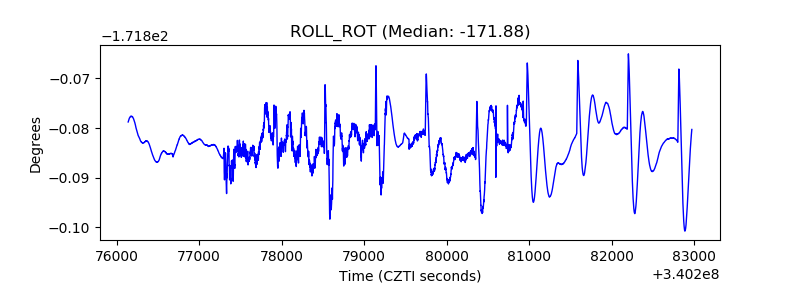 |
| _Roll_DEC |  |
| _Roll_RA | 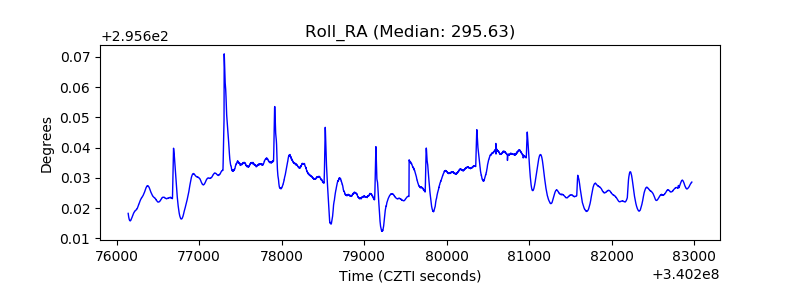 |
| Veto Counter | 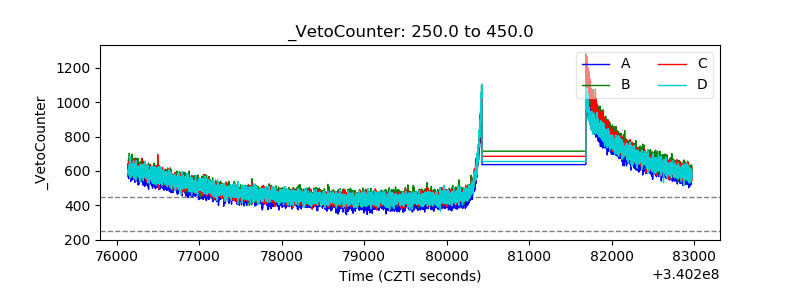 |