| Param | Original file | Final file |
|---|---|---|
| Filename | modeM0/AS1T03_243T01_9000003918_27270cztM0_level2.evt | modeM0/AS1T03_243T01_9000003918_27270cztM0_level2_quad_clean.evt |
| Size (bytes) | 491,592,960 | 119,177,280 |
| Size | 468.8 MB | 113.7 MB |
| Events in quadrant A | 3,327,656 | 827,954 |
| Events in quadrant B | 4,064,782 | 821,745 |
| Events in quadrant C | 3,215,618 | 773,517 |
| Events in quadrant D | 3,878,744 | 773,255 |
| Mode M9 | |||
|---|---|---|---|
| Quadrant | BADHDUFLAG | Total packets | Discarded packets |
| A | 0 | 13 | 0 |
| B | 0 | 13 | 0 |
| C | 0 | 13 | 0 |
| D | 0 | 13 | 0 |
| Mode M0 | |||
|---|---|---|---|
| Quadrant | BADHDUFLAG | Total packets | Discarded packets |
| A | 0 | 13812 | 0 |
| B | 0 | 16011 | 0 |
| C | 0 | 13363 | 0 |
| D | 0 | 15425 | 0 |
| Quadrant | Total seconds | Saturated seconds | Saturation percentage |
|---|---|---|---|
| A | 5915 | 101 | 1.707523% |
| B | 5916 | 247 | 4.175118% |
| C | 5916 | 137 | 2.315754% |
| D | 5916 | 191 | 3.228533% |
Noise dominated data is calculated using 1-second bins in cleaned event files. If a bin has >2000 counts, and if more than 50% of those come from <1% of pixels, then it is considered to be noise-dominated and hence unusable.
| Quadrant | # 1 sec bins | Bins with >0 counts | Bins with >2000 counts | High rate bins dominated by noise | Noise dominated (total time) | Noise dominated (detector-on time) | Marked lightcurve |
|---|---|---|---|---|---|---|---|
| A | 7240 | 5916 | 0 | 0 | 0.00% | 0.00% | 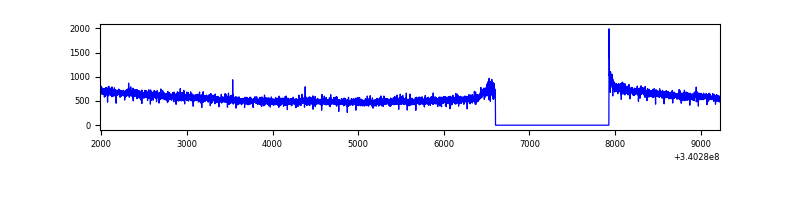 |
| B | 7241 | 5917 | 81 | 81 | 1.12% | 1.37% | 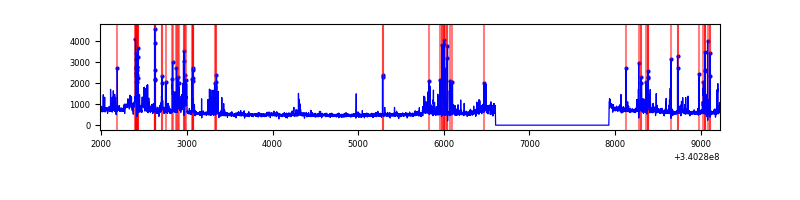 |
| C | 7241 | 5917 | 0 | 0 | 0.00% | 0.00% | 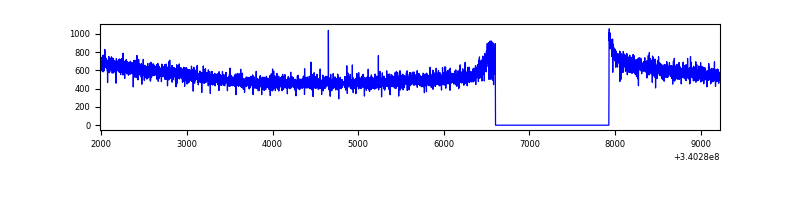 |
| D | 7241 | 5917 | 66 | 66 | 0.91% | 1.12% |  |
Top three noisy pixels from each quadrant. If the there are fewer than three noisy pixels in the level2.evt file, extra rows are filled as -1
| Pixel properties | Quadrant properties | ||||||
|---|---|---|---|---|---|---|---|
| Quadrant | DetID | PixID | Counts | Sigma | Mean | Median | Sigma |
| A | 0 | 13 | 10880 | 59.65 | 856 | 844 | 168.3 |
| A | 12 | 96 | 10456 | 57.13 | 856 | 844 | 168.3 |
| A | 13 | 254 | 9105 | 49.1 | 856 | 844 | 168.3 |
| B | 10 | 245 | 482732 | 3102.34 | 828 | 811 | 155.3 |
| B | 3 | 64 | 160390 | 1027.28 | 828 | 811 | 155.3 |
| B | 10 | 247 | 111379 | 711.78 | 828 | 811 | 155.3 |
| C | 14 | 238 | 129863 | 708.32 | 792 | 799 | 182.2 |
| C | 13 | 61 | 5433 | 25.43 | 792 | 799 | 182.2 |
| C | 15 | 78 | 1901 | 6.05 | 792 | 799 | 182.2 |
| D | 1 | 52 | 627230 | 3247.88 | 810 | 793 | 192.9 |
| D | 12 | 233 | 93255 | 479.39 | 810 | 793 | 192.9 |
| D | 2 | 250 | 58901 | 301.27 | 810 | 793 | 192.9 |
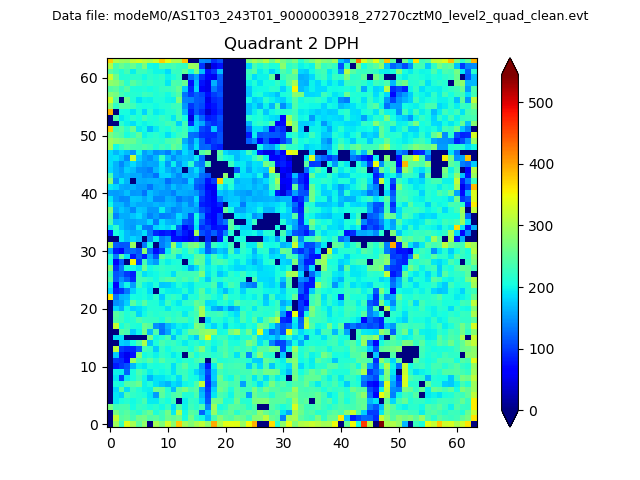
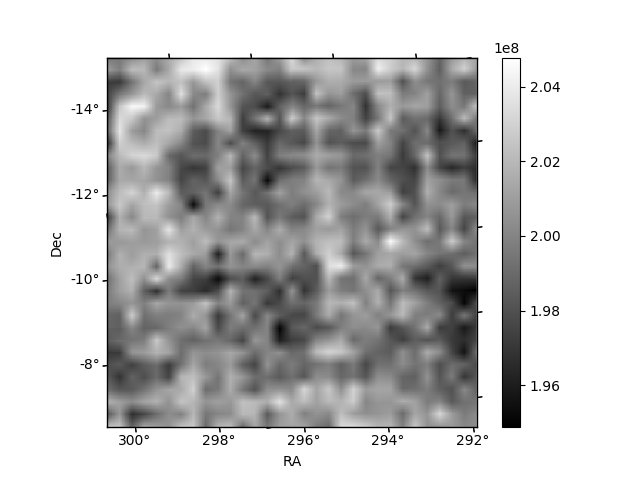
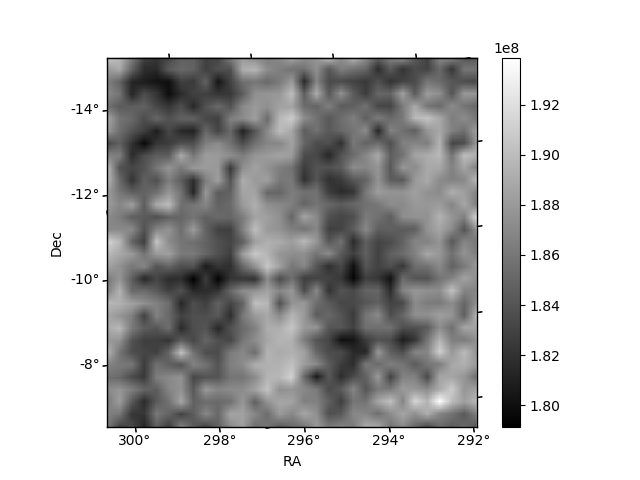
Histogram calculated using DETX and DETY for each event in the final _common_clean file
| Quadrant A | 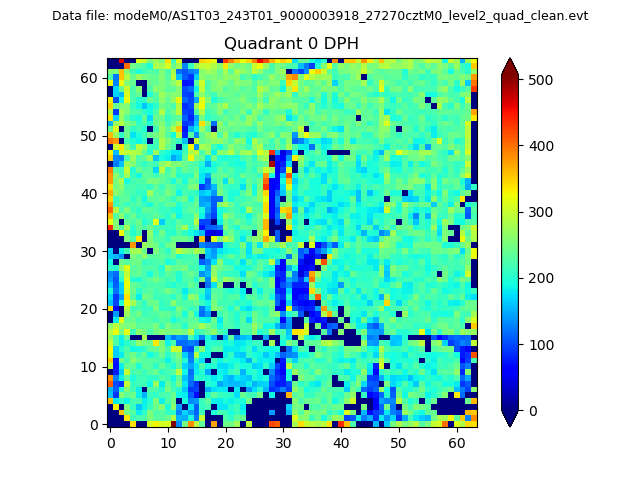 |
 |
Quadrant B |
|---|---|---|---|
| Quadrant D | 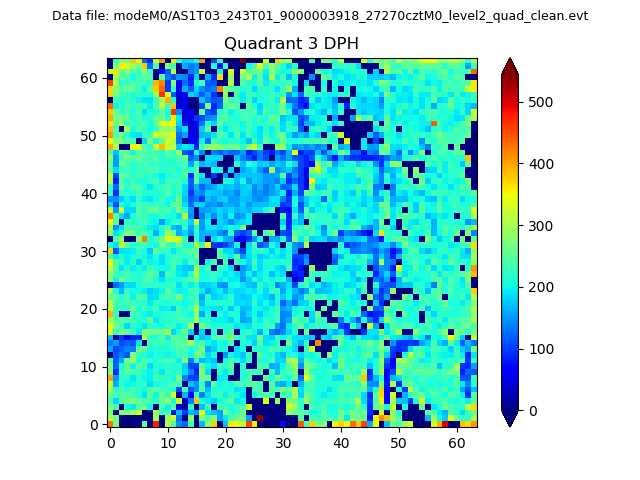 |
 |
Quadrant C |
| Plot type | Count rate plots | Images |
|---|---|---|
| Comparison with Poisson distribution Blue bars denote a histogram of data divided into 1 sec bins. Red curve is a Poisson curve with rate = median count rate of data. |
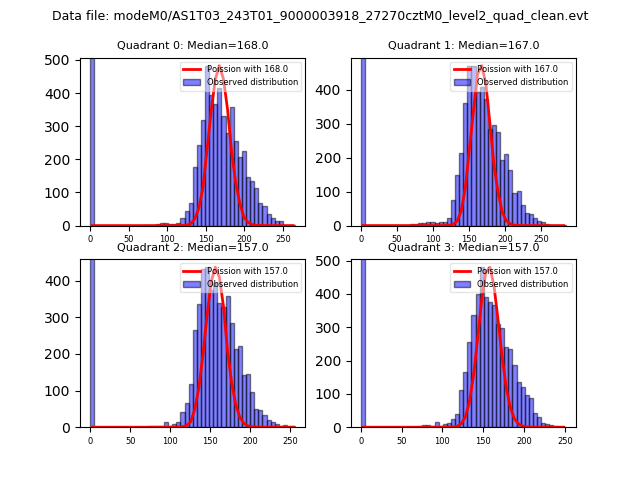 |
 |
| Quadrant-wise count rates Data is divided into 100 sec bins |
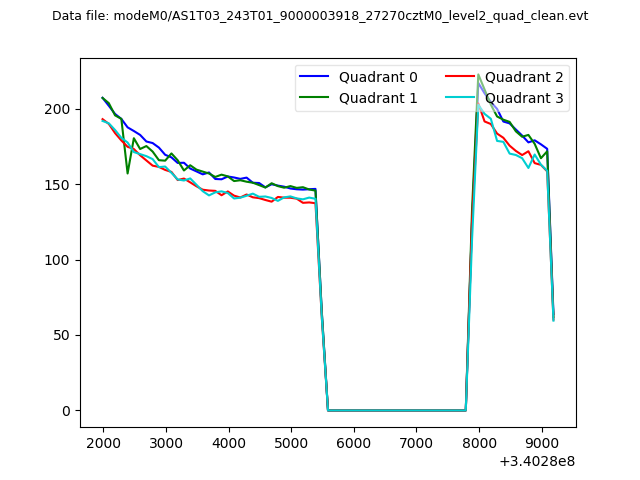 |
|
| Module-wise count rates for Quadrant A Data is divided into 100 sec bins |
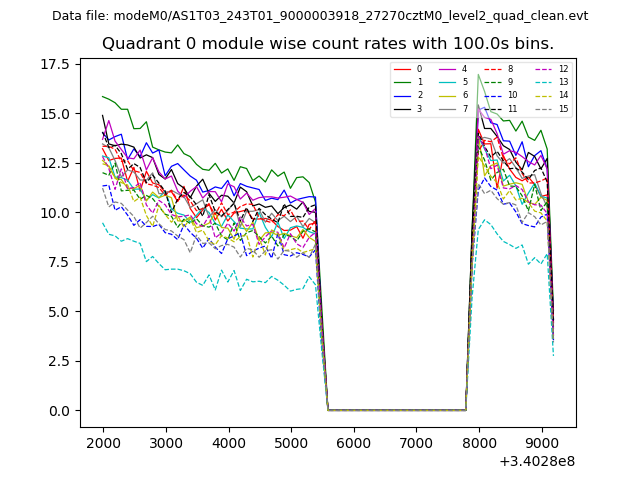 |
 |
| Module-wise count rates for Quadrant B Data is divided into 100 sec bins |
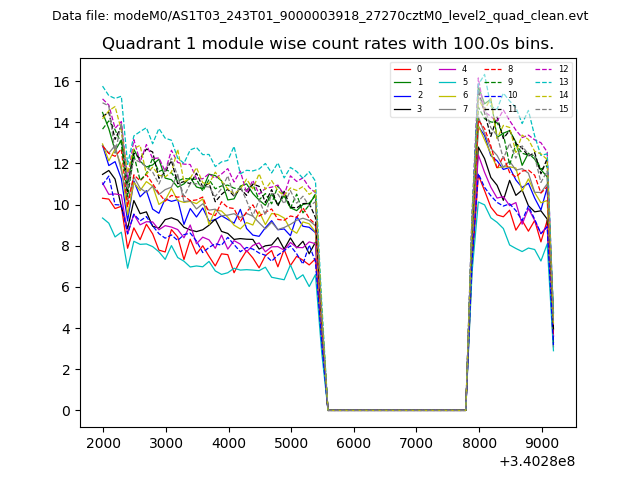 |
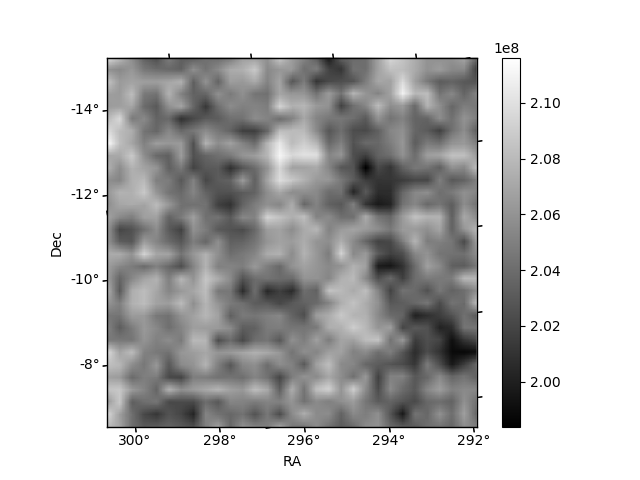 |
| Module-wise count rates for Quadrant C Data is divided into 100 sec bins |
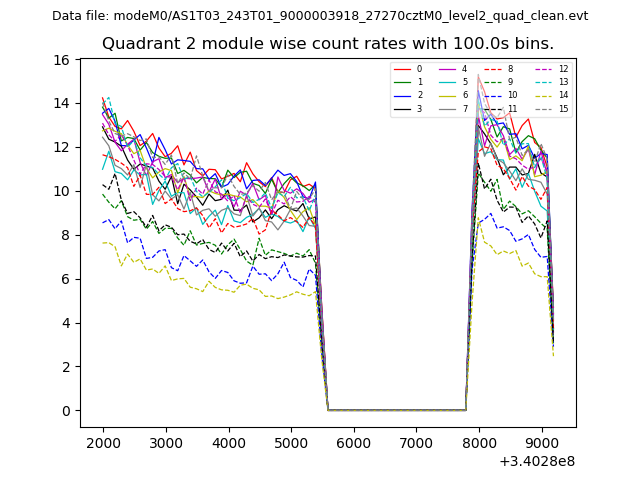 |
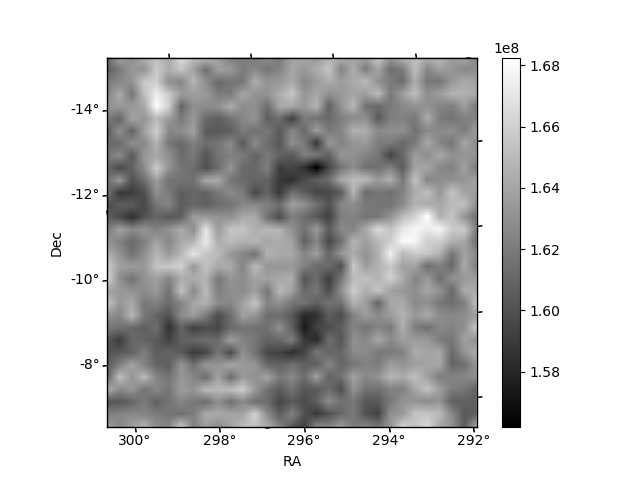 |
| Module-wise count rates for Quadrant D Data is divided into 100 sec bins |
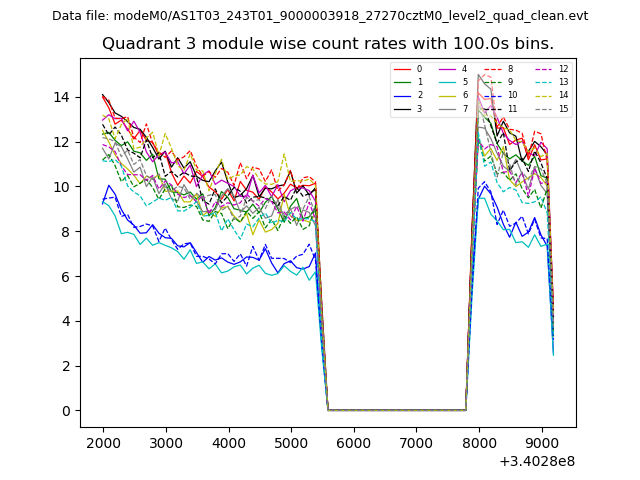 |
 |
| Parameter | Plot |
|---|---|
| CZT HV Monitor | 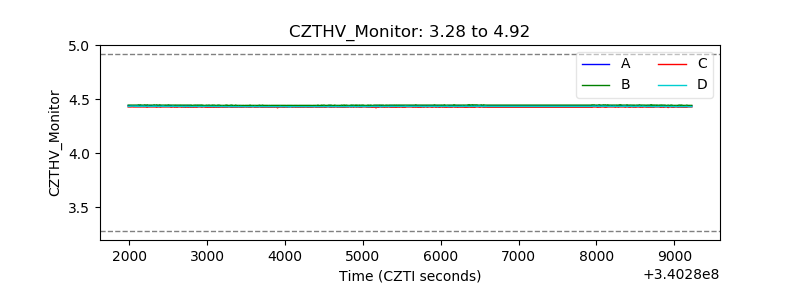 |
| D_VDD | 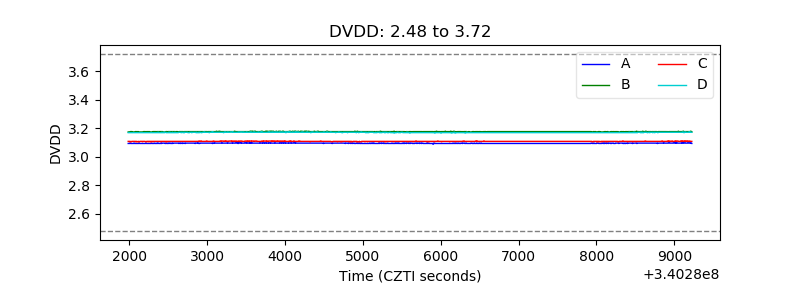 |
| Temperature 1 | 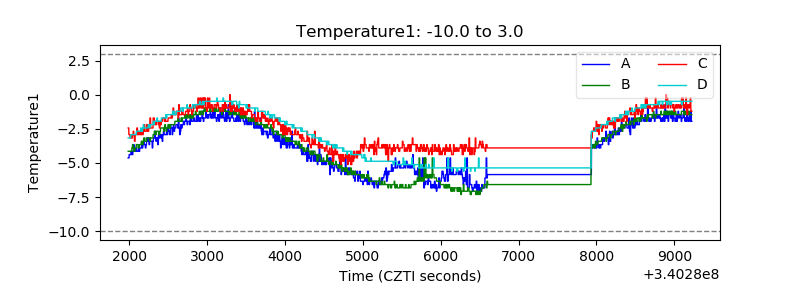 |
| Veto HV Monitor |  |
| Veto LLD | 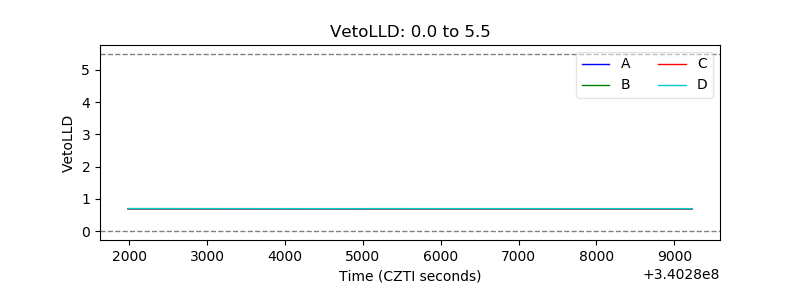 |
| Alpha Counter | 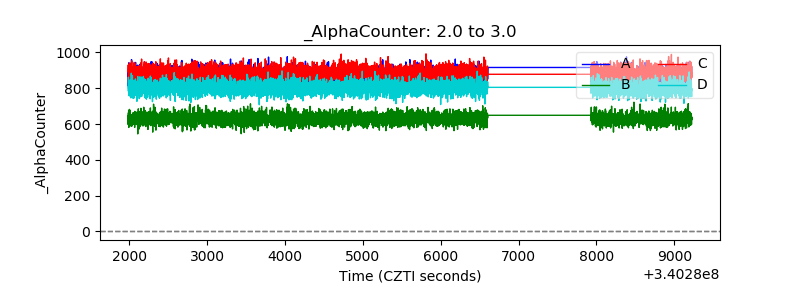 |
| _CPM_Rate |  |
| CZT Counter | 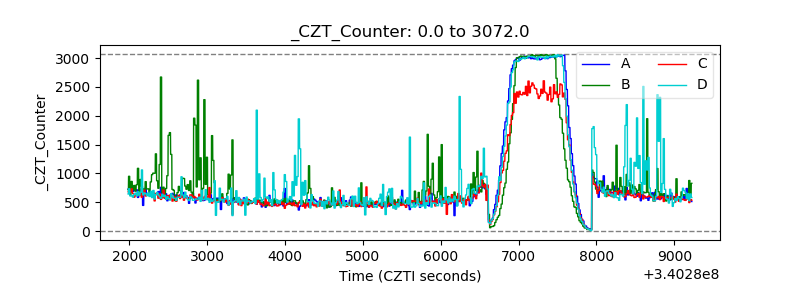 |
| +2.5 Volts monitor |  |
| +5 Volts monitor |  |
| _ROLL_ROT | 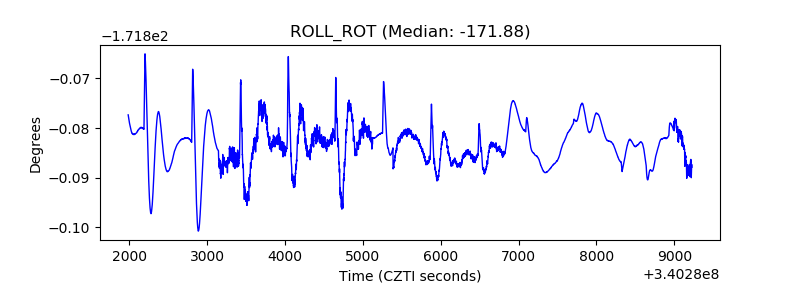 |
| _Roll_DEC |  |
| _Roll_RA | 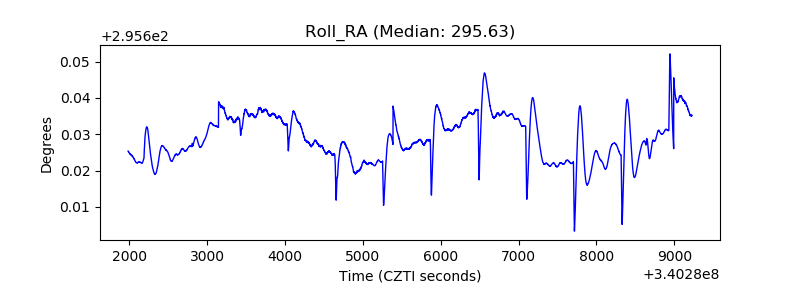 |
| Veto Counter | 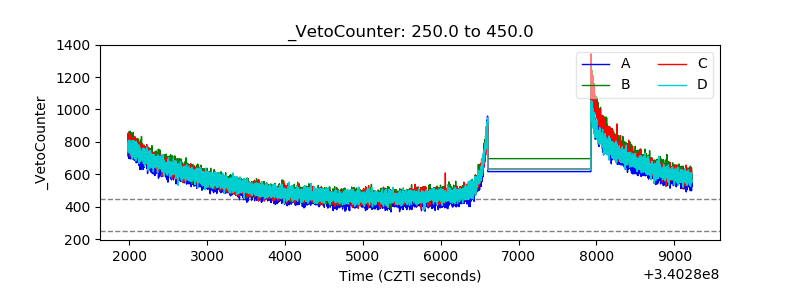 |