| Param | Original file | Final file |
|---|---|---|
| Filename | modeM0/AS1T03_243T01_9000003918_27272cztM0_level2.evt | modeM0/AS1T03_243T01_9000003918_27272cztM0_level2_quad_clean.evt |
| Size (bytes) | 511,963,200 | 90,636,480 |
| Size | 488.2 MB | 86.4 MB |
| Events in quadrant A | 3,188,805 | 615,532 |
| Events in quadrant B | 4,411,395 | 573,931 |
| Events in quadrant C | 3,037,777 | 576,322 |
| Events in quadrant D | 4,464,111 | 563,863 |
| Mode M9 | |||
|---|---|---|---|
| Quadrant | BADHDUFLAG | Total packets | Discarded packets |
| A | 0 | 13 | 0 |
| B | 0 | 13 | 0 |
| C | 0 | 13 | 0 |
| D | 0 | 13 | 0 |
| Mode M0 | |||
|---|---|---|---|
| Quadrant | BADHDUFLAG | Total packets | Discarded packets |
| A | 0 | 13110 | 0 |
| B | 0 | 17054 | 0 |
| C | 0 | 12621 | 0 |
| D | 0 | 17746 | 0 |
| Quadrant | Total seconds | Saturated seconds | Saturation percentage |
|---|---|---|---|
| A | 5944 | 111 | 1.867429% |
| B | 5944 | 474 | 7.974428% |
| C | 5944 | 106 | 1.783311% |
| D | 5945 | 136 | 2.287637% |
Noise dominated data is calculated using 1-second bins in cleaned event files. If a bin has >2000 counts, and if more than 50% of those come from <1% of pixels, then it is considered to be noise-dominated and hence unusable.
| Quadrant | # 1 sec bins | Bins with >0 counts | Bins with >2000 counts | High rate bins dominated by noise | Noise dominated (total time) | Noise dominated (detector-on time) | Marked lightcurve |
|---|---|---|---|---|---|---|---|
| A | 7199 | 5945 | 9 | 9 | 0.13% | 0.15% | 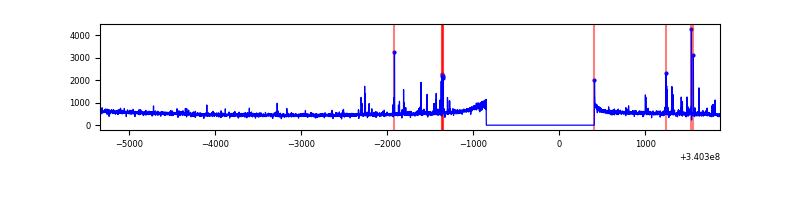 |
| B | 7199 | 5945 | 260 | 260 | 3.61% | 4.37% | 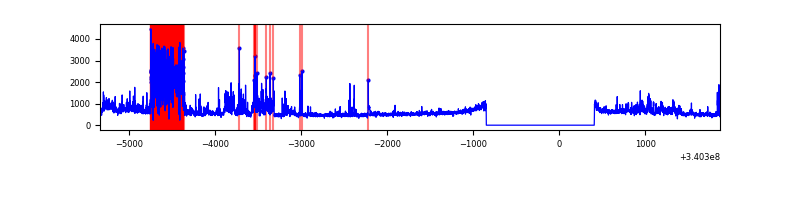 |
| C | 7199 | 5945 | 0 | 0 | 0.00% | 0.00% | 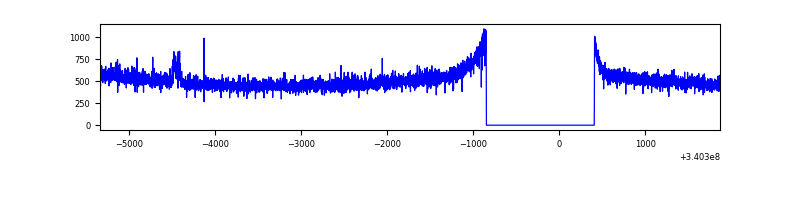 |
| D | 7200 | 5946 | 86 | 86 | 1.19% | 1.45% | 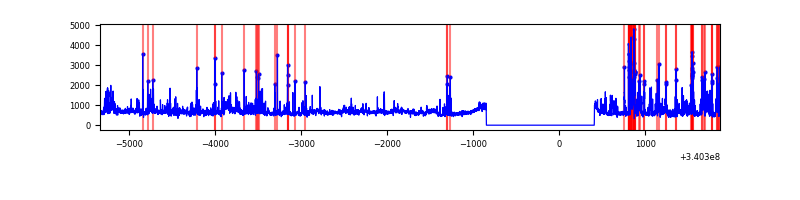 |
Top three noisy pixels from each quadrant. If the there are fewer than three noisy pixels in the level2.evt file, extra rows are filled as -1
| Pixel properties | Quadrant properties | ||||||
|---|---|---|---|---|---|---|---|
| Quadrant | DetID | PixID | Counts | Sigma | Mean | Median | Sigma |
| A | 12 | 96 | 71936 | 449.22 | 793 | 780 | 158.4 |
| A | 13 | 248 | 44941 | 278.79 | 793 | 780 | 158.4 |
| A | 12 | 189 | 9500 | 55.05 | 793 | 780 | 158.4 |
| B | 10 | 245 | 992687 | 6949.07 | 753 | 738 | 142.7 |
| B | 3 | 64 | 259721 | 1814.3 | 753 | 738 | 142.7 |
| B | 0 | 230 | 165213 | 1152.23 | 753 | 738 | 142.7 |
| C | 14 | 238 | 121476 | 695.42 | 744 | 751 | 173.6 |
| C | 0 | 207 | 17229 | 94.92 | 744 | 751 | 173.6 |
| C | 13 | 61 | 5185 | 25.54 | 744 | 751 | 173.6 |
| D | 1 | 52 | 1324030 | 7155.99 | 750 | 733 | 184.9 |
| D | 2 | 250 | 200710 | 1081.42 | 750 | 733 | 184.9 |
| D | 12 | 233 | 41810 | 222.13 | 750 | 733 | 184.9 |
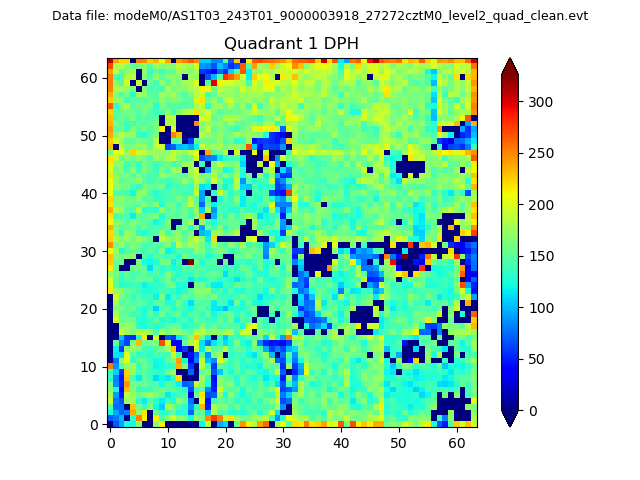
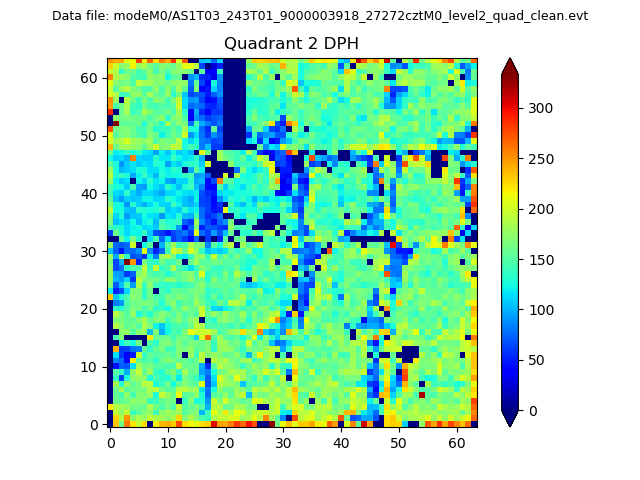
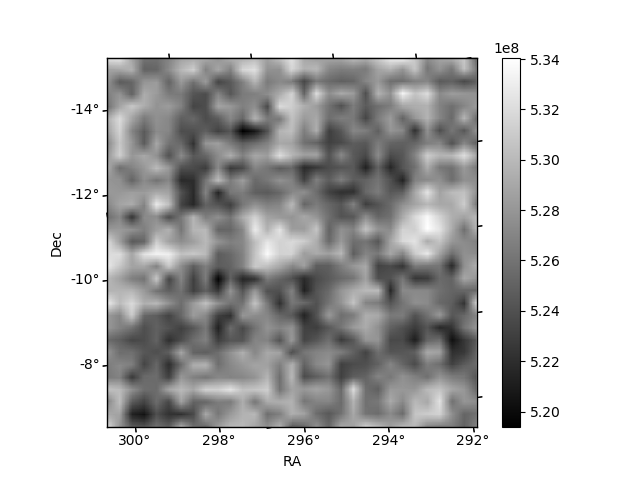
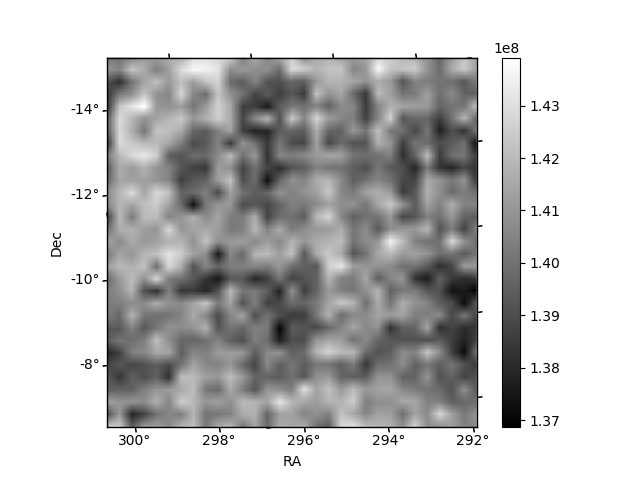
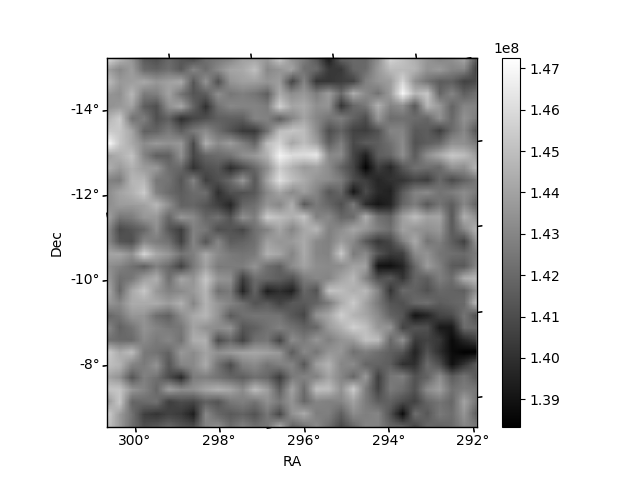
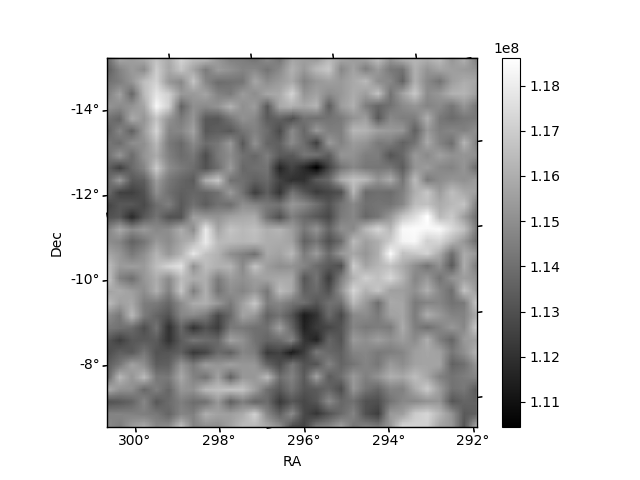
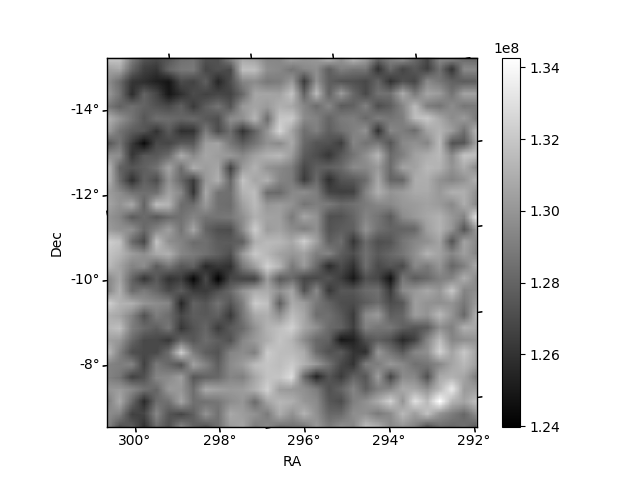
Histogram calculated using DETX and DETY for each event in the final _common_clean file
| Quadrant A |  |
 |
Quadrant B |
|---|---|---|---|
| Quadrant D | 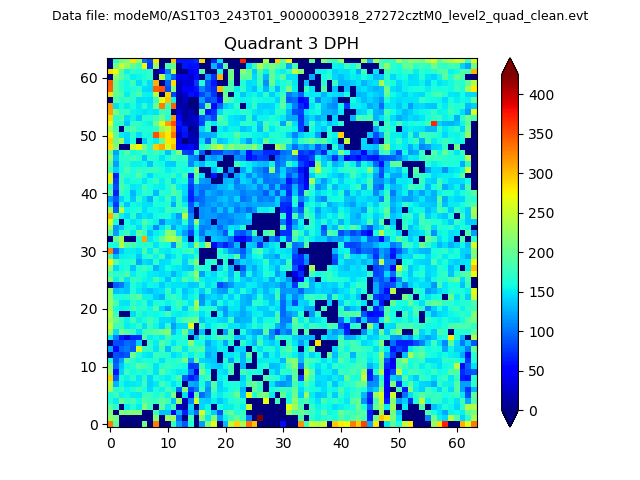 |
 |
Quadrant C |
| Plot type | Count rate plots | Images |
|---|---|---|
| Comparison with Poisson distribution Blue bars denote a histogram of data divided into 1 sec bins. Red curve is a Poisson curve with rate = median count rate of data. |
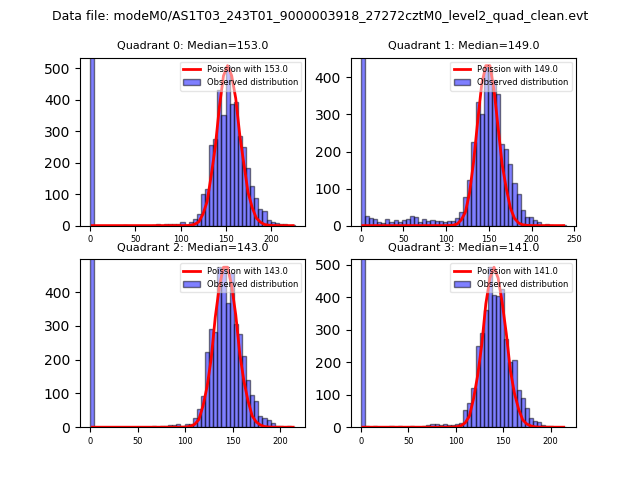 |
 |
| Quadrant-wise count rates Data is divided into 100 sec bins |
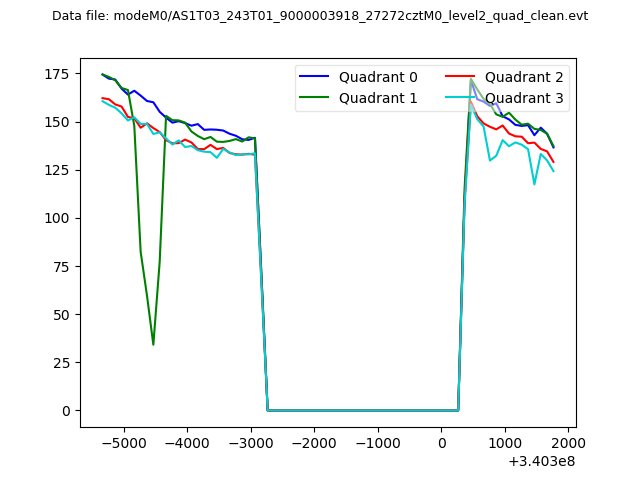 |
|
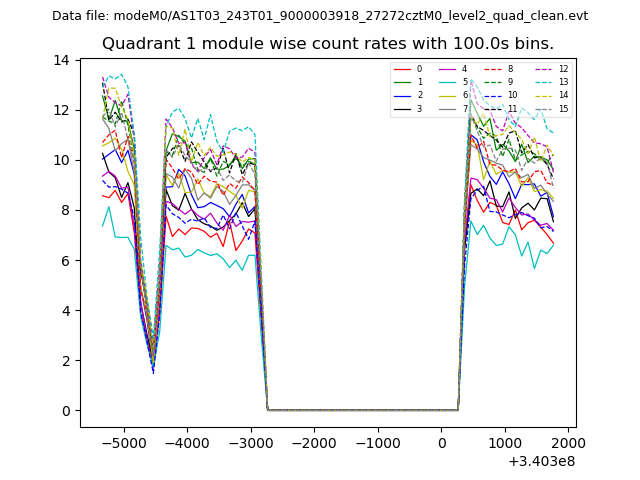
| Module-wise count rates for Quadrant A Data is divided into 100 sec bins |
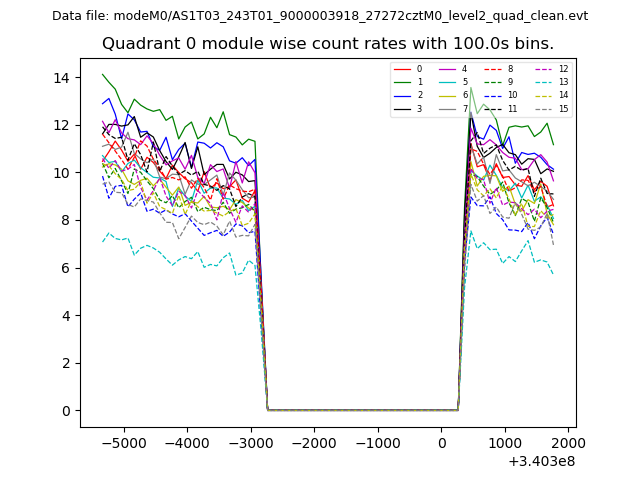 |
 |
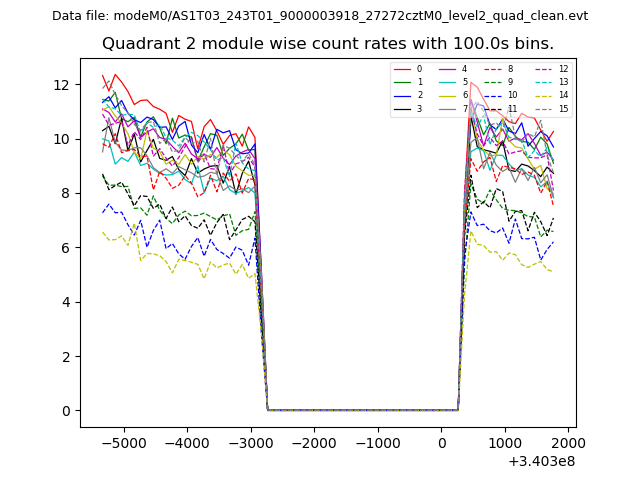
| Module-wise count rates for Quadrant B Data is divided into 100 sec bins |
 |
 |
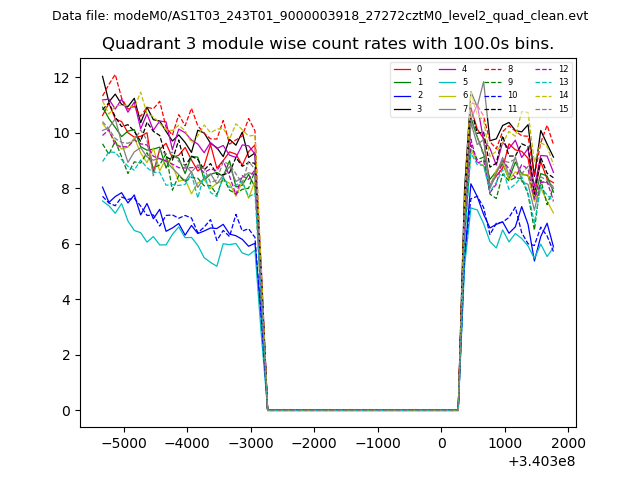
| Module-wise count rates for Quadrant C Data is divided into 100 sec bins |
 |
 |
| Module-wise count rates for Quadrant D Data is divided into 100 sec bins |
 |
 |
| Parameter | Plot |
|---|---|
| CZT HV Monitor | 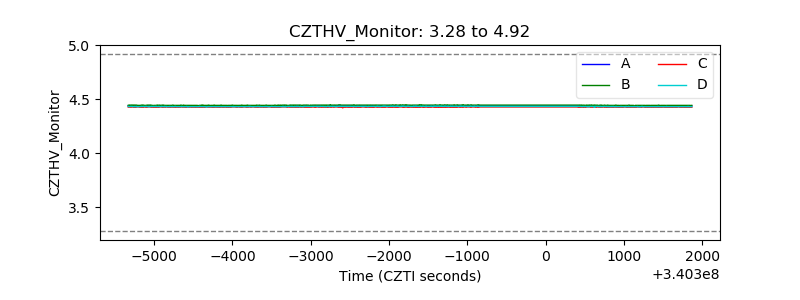 |
| D_VDD | 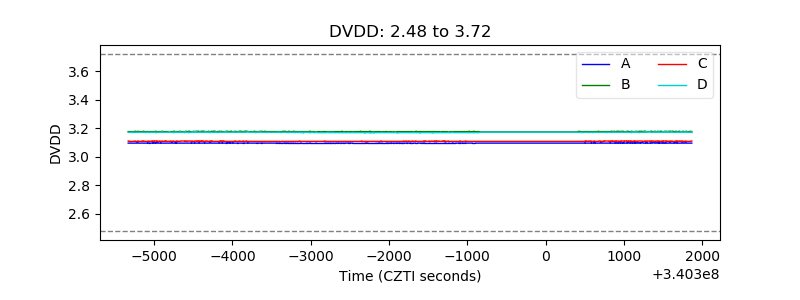 |
| Temperature 1 | 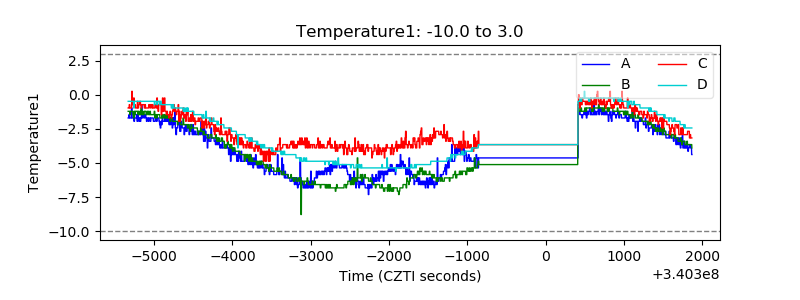 |
| Veto HV Monitor |  |
| Veto LLD | 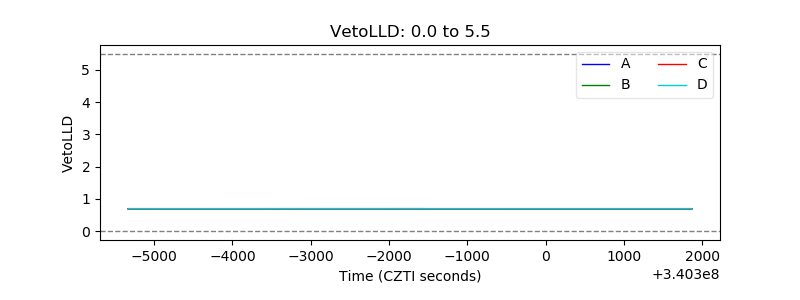 |
| Alpha Counter | 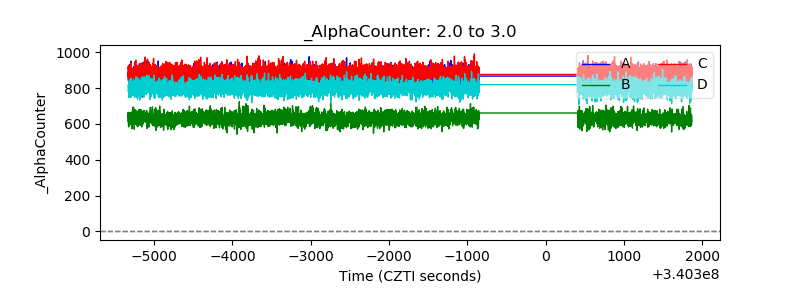 |
| _CPM_Rate | 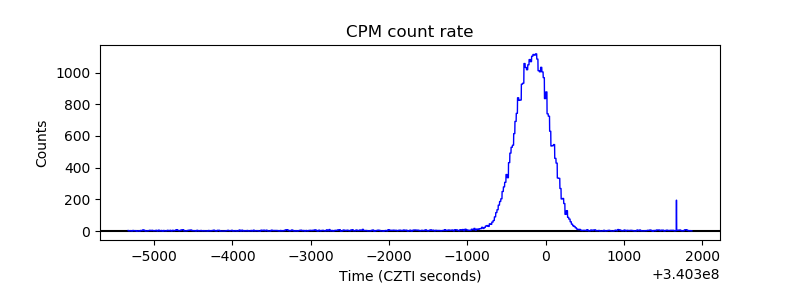 |
| CZT Counter | 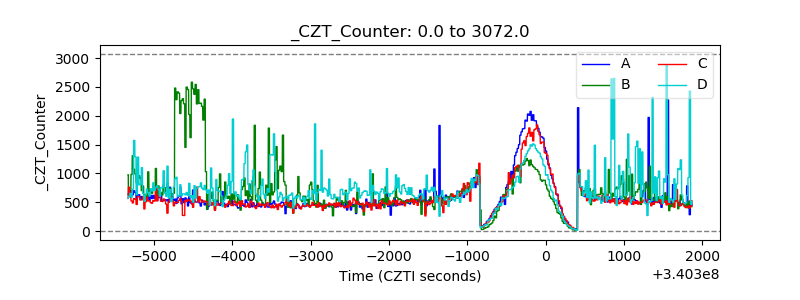 |
| +2.5 Volts monitor |  |
| +5 Volts monitor | 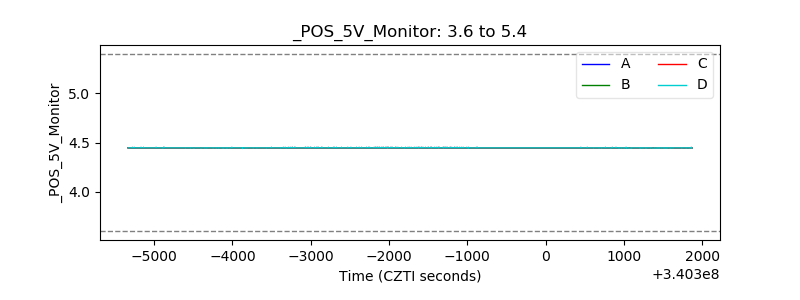 |
| _ROLL_ROT | 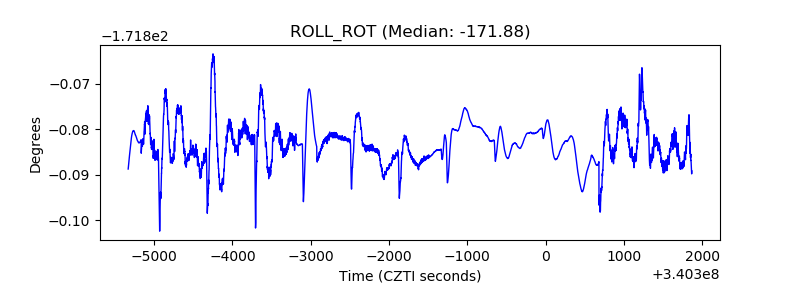 |
| _Roll_DEC | 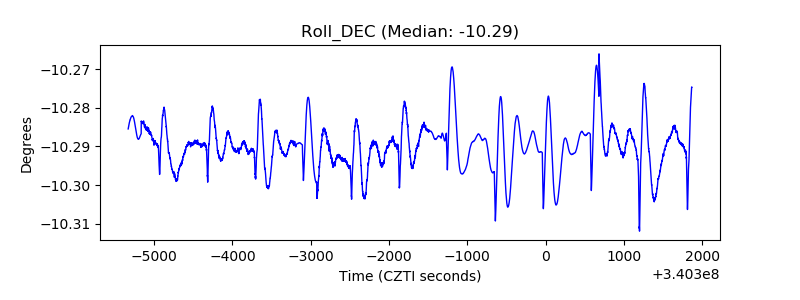 |
| _Roll_RA | 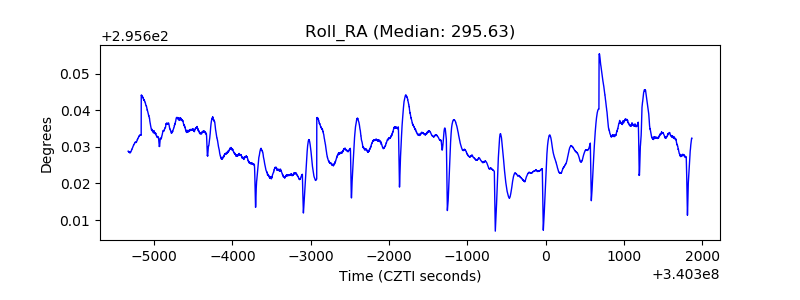 |
| Veto Counter | 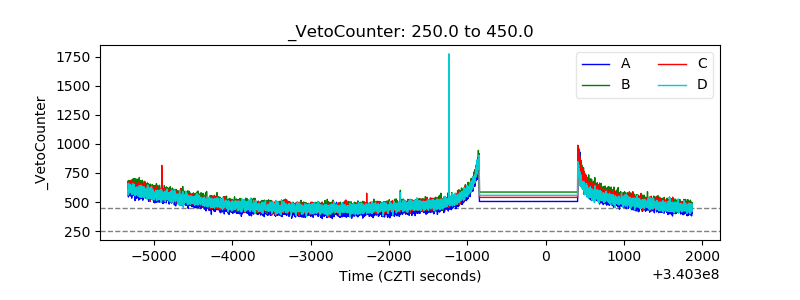 |