| Param | Original file | Final file |
|---|---|---|
| Filename | modeM0/AS1T03_243T01_9000003918_27274cztM0_level2.evt | modeM0/AS1T03_243T01_9000003918_27274cztM0_level2_quad_clean.evt |
| Size (bytes) | 669,844,800 | 101,946,240 |
| Size | 638.8 MB | 97.2 MB |
| Events in quadrant A | 3,970,323 | 670,671 |
| Events in quadrant B | 4,221,136 | 678,666 |
| Events in quadrant C | 3,506,412 | 649,263 |
| Events in quadrant D | 8,100,859 | 586,795 |
| Mode M9 | |||
|---|---|---|---|
| Quadrant | BADHDUFLAG | Total packets | Discarded packets |
| A | 0 | 5 | 0 |
| B | 0 | 6 | 0 |
| C | 0 | 6 | 0 |
| D | 0 | 6 | 0 |
| Mode M0 | |||
|---|---|---|---|
| Quadrant | BADHDUFLAG | Total packets | Discarded packets |
| A | 0 | 16492 | 0 |
| B | 0 | 17161 | 0 |
| C | 0 | 15005 | 0 |
| D | 0 | 28858 | 0 |
| Quadrant | Total seconds | Saturated seconds | Saturation percentage |
|---|---|---|---|
| A | 7202 | 246 | 3.415718% |
| B | 7202 | 221 | 3.068592% |
| C | 7202 | 93 | 1.291308% |
| D | 7202 | 1383 | 19.202999% |
Noise dominated data is calculated using 1-second bins in cleaned event files. If a bin has >2000 counts, and if more than 50% of those come from <1% of pixels, then it is considered to be noise-dominated and hence unusable.
| Quadrant | # 1 sec bins | Bins with >0 counts | Bins with >2000 counts | High rate bins dominated by noise | Noise dominated (total time) | Noise dominated (detector-on time) | Marked lightcurve |
|---|---|---|---|---|---|---|---|
| A | 7732 | 7203 | 86 | 86 | 1.11% | 1.19% | 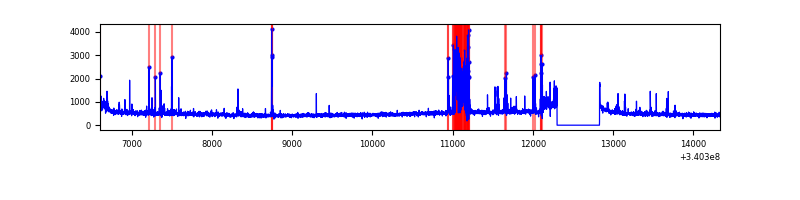 |
| B | 7732 | 7203 | 60 | 60 | 0.78% | 0.83% | 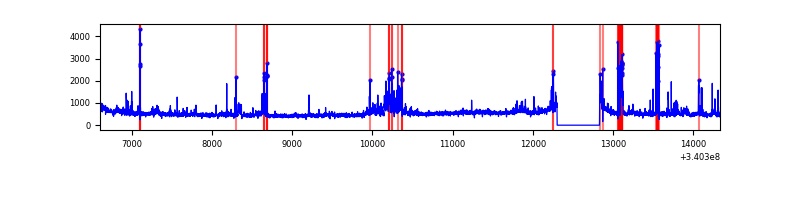 |
| C | 7732 | 7203 | 0 | 0 | 0.00% | 0.00% | 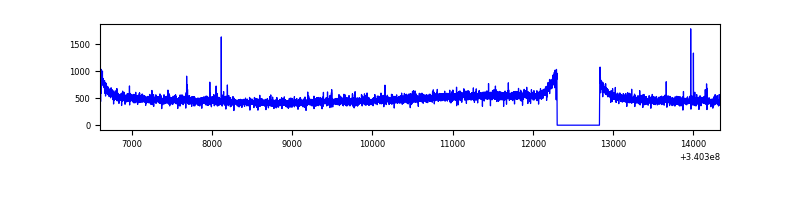 |
| D | 7732 | 7203 | 1266 | 1266 | 16.37% | 17.58% | 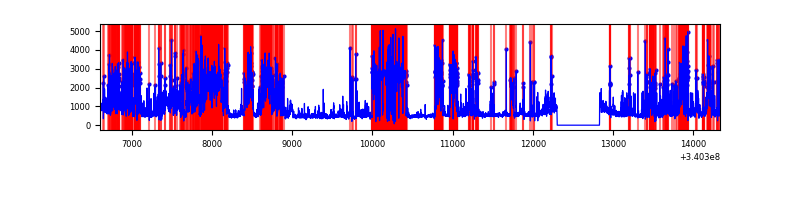 |
Top three noisy pixels from each quadrant. If the there are fewer than three noisy pixels in the level2.evt file, extra rows are filled as -1
| Pixel properties | Quadrant properties | ||||||
|---|---|---|---|---|---|---|---|
| Quadrant | DetID | PixID | Counts | Sigma | Mean | Median | Sigma |
| A | 12 | 96 | 462523 | 2571.13 | 895 | 878 | 179.5 |
| A | 13 | 248 | 38893 | 211.72 | 895 | 878 | 179.5 |
| A | 13 | 254 | 11474 | 59.01 | 895 | 878 | 179.5 |
| B | 10 | 245 | 403145 | 2333.09 | 896 | 873 | 172.4 |
| B | 3 | 64 | 130982 | 754.6 | 896 | 873 | 172.4 |
| B | 15 | 32 | 74618 | 427.7 | 896 | 873 | 172.4 |
| C | 14 | 238 | 136002 | 666.96 | 859 | 864 | 202.6 |
| C | 15 | 208 | 16909 | 79.19 | 859 | 864 | 202.6 |
| C | 3 | 233 | 8379 | 37.09 | 859 | 864 | 202.6 |
| D | 1 | 52 | 4779398 | 24507.18 | 790 | 771 | 195.0 |
| D | 2 | 250 | 199992 | 1021.7 | 790 | 771 | 195.0 |
| D | 12 | 233 | 51823 | 261.82 | 790 | 771 | 195.0 |
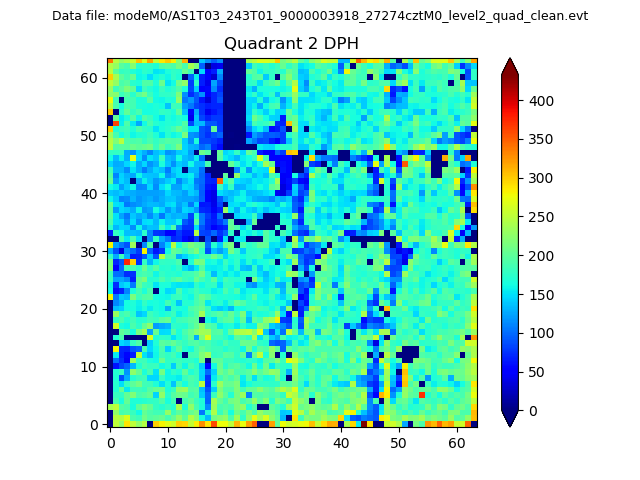
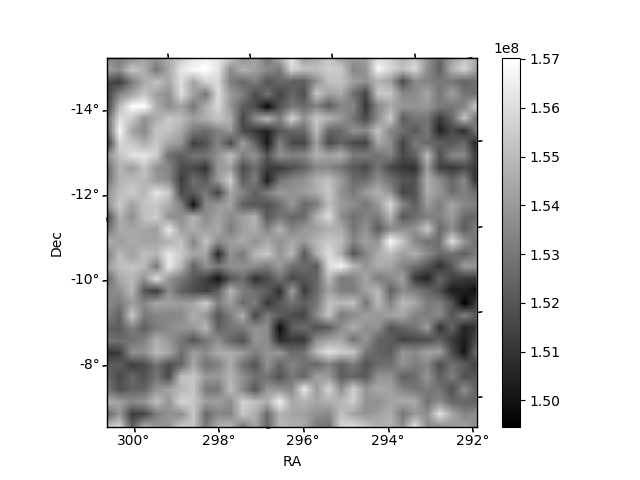
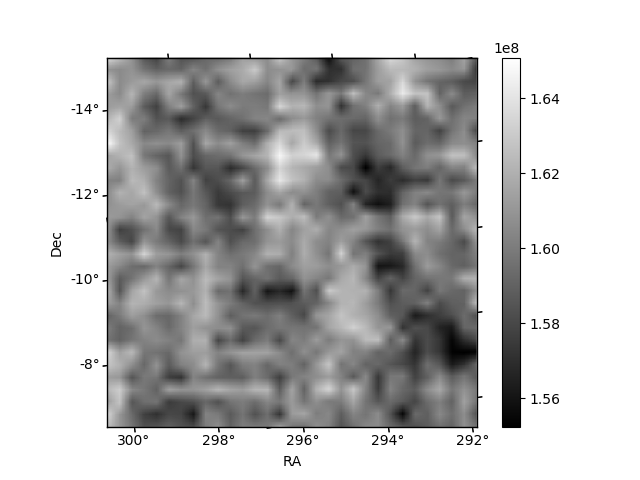
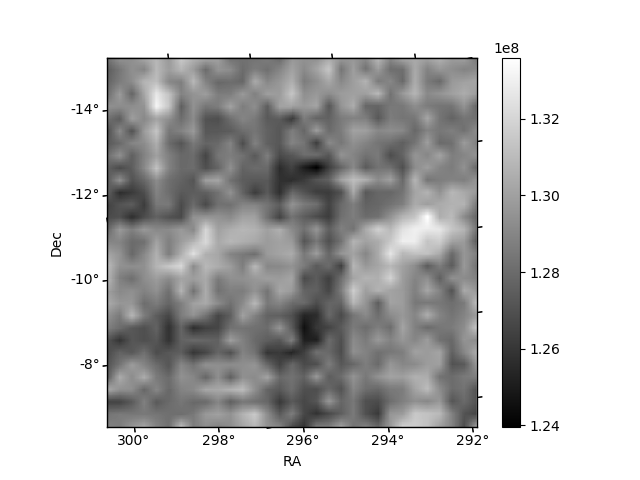
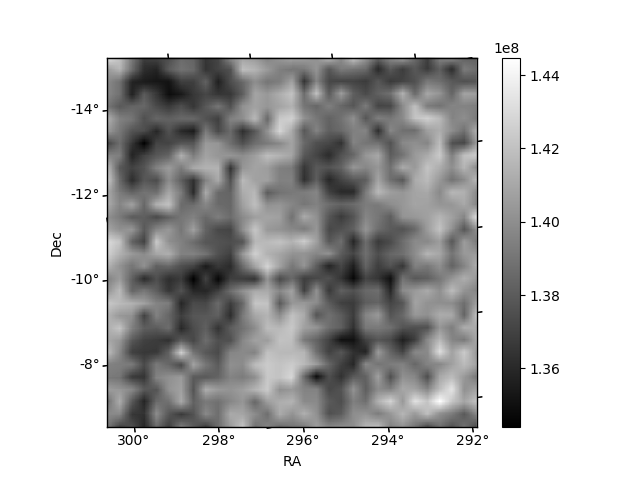
Histogram calculated using DETX and DETY for each event in the final _common_clean file
| Quadrant A | 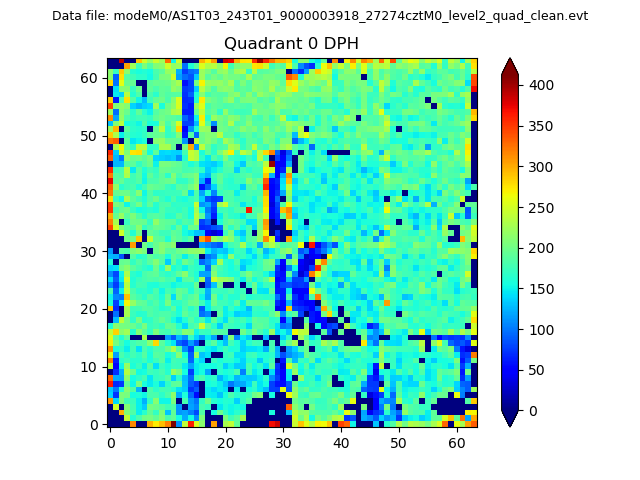 |
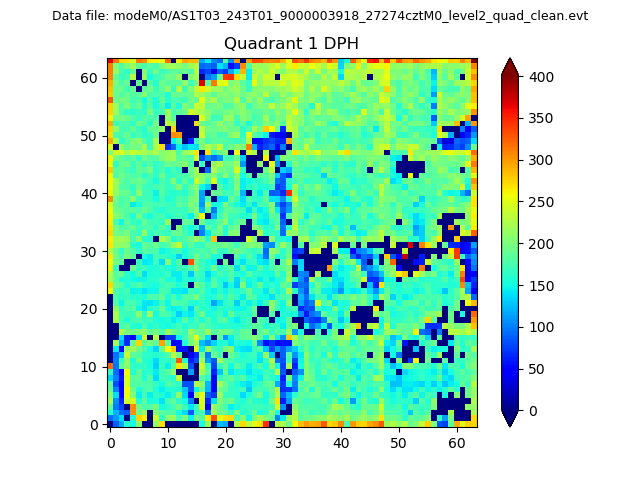 |
Quadrant B |
|---|---|---|---|
| Quadrant D | 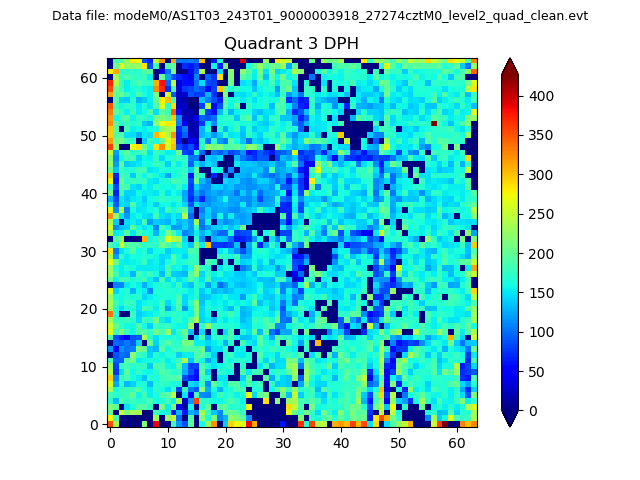 |
 |
Quadrant C |
| Plot type | Count rate plots | Images |
|---|---|---|
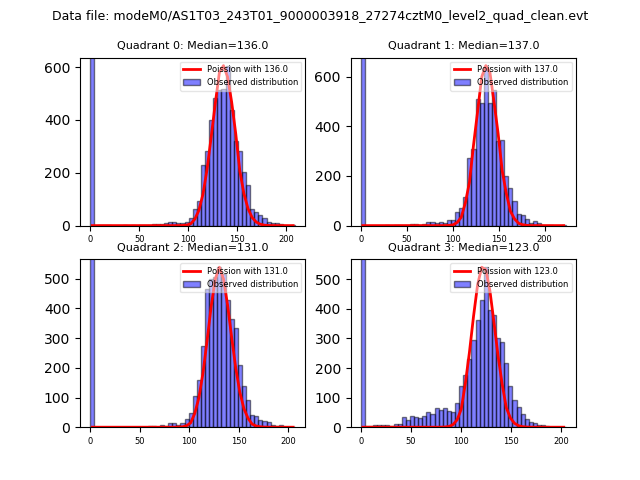
| Comparison with Poisson distribution Blue bars denote a histogram of data divided into 1 sec bins. Red curve is a Poisson curve with rate = median count rate of data. |
 |
 |
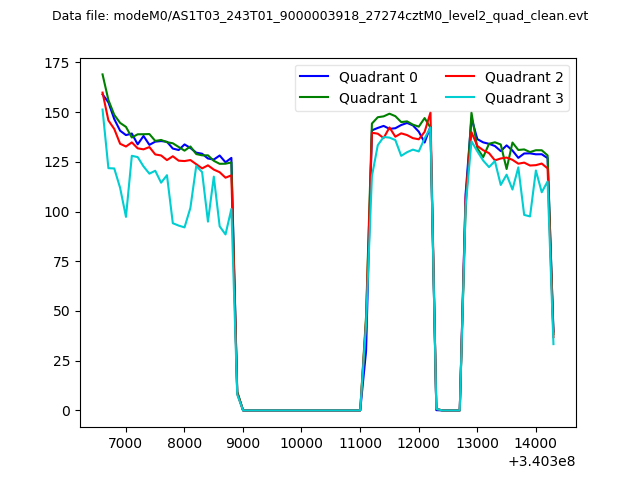
| Quadrant-wise count rates Data is divided into 100 sec bins |
 |
|
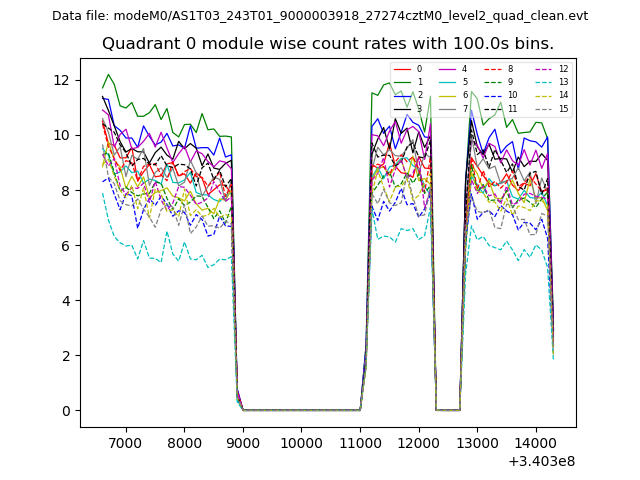
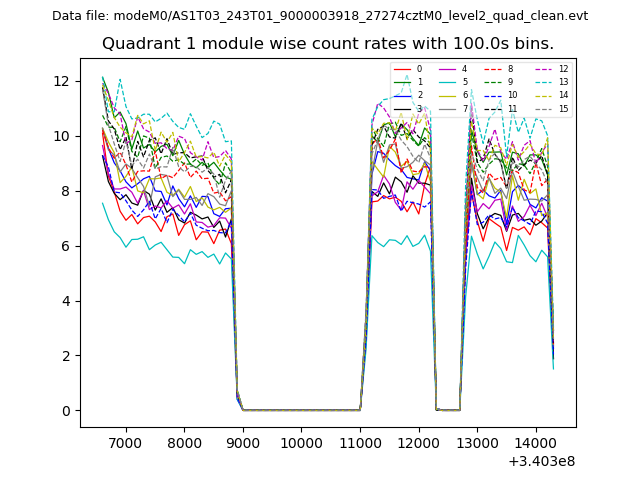
| Module-wise count rates for Quadrant A Data is divided into 100 sec bins |
 |
 |
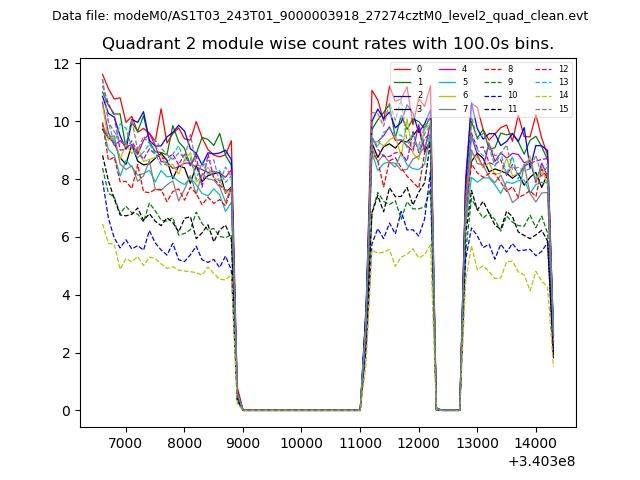
| Module-wise count rates for Quadrant B Data is divided into 100 sec bins |
 |
 |
| Module-wise count rates for Quadrant C Data is divided into 100 sec bins |
 |
 |
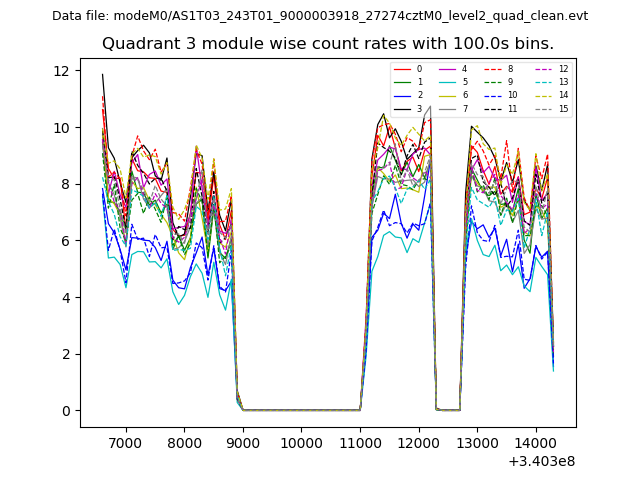
| Module-wise count rates for Quadrant D Data is divided into 100 sec bins |
 |
 |
| Parameter | Plot |
|---|---|
| CZT HV Monitor | 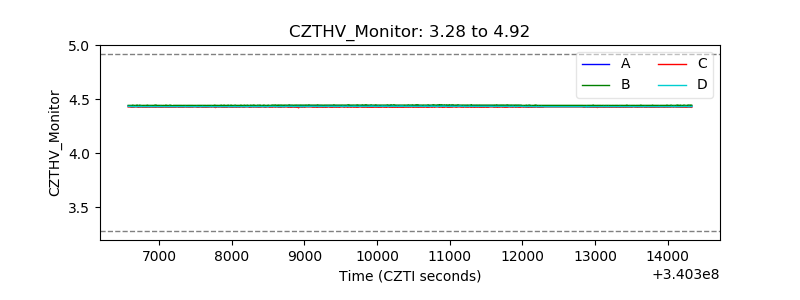 |
| D_VDD | 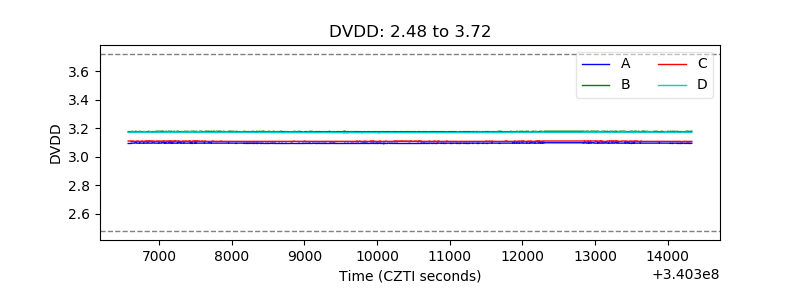 |
| Temperature 1 | 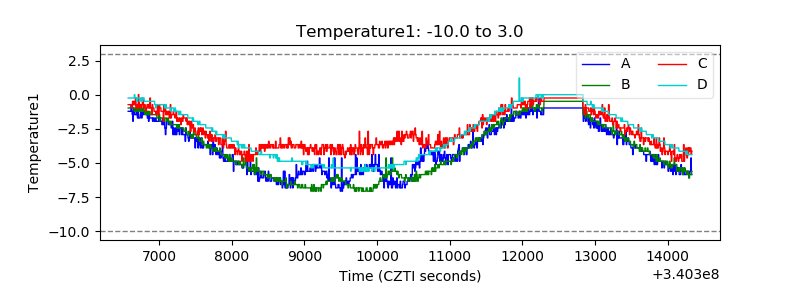 |
| Veto HV Monitor | 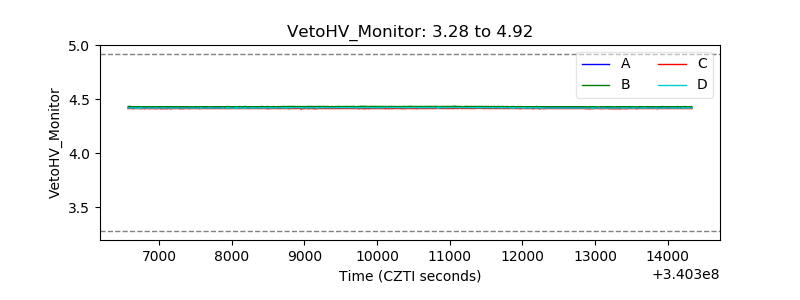 |
| Veto LLD | 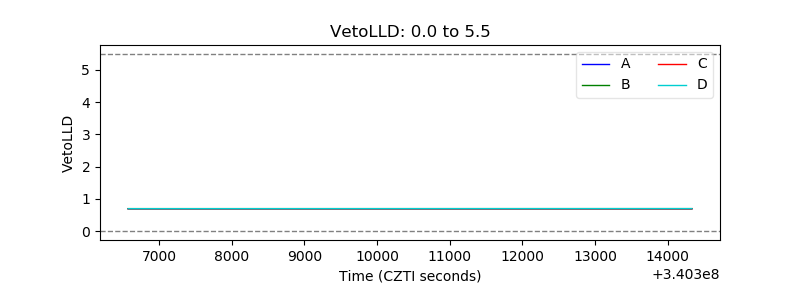 |
| Alpha Counter | 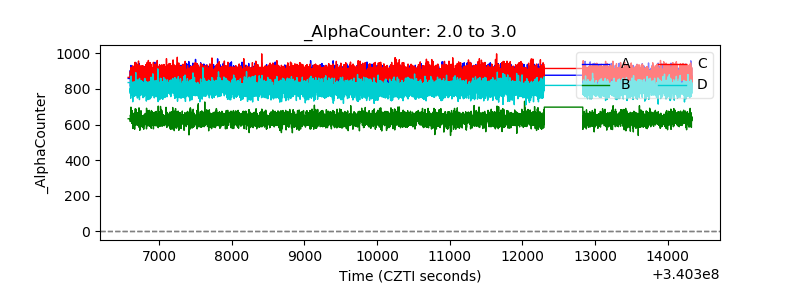 |
| _CPM_Rate | 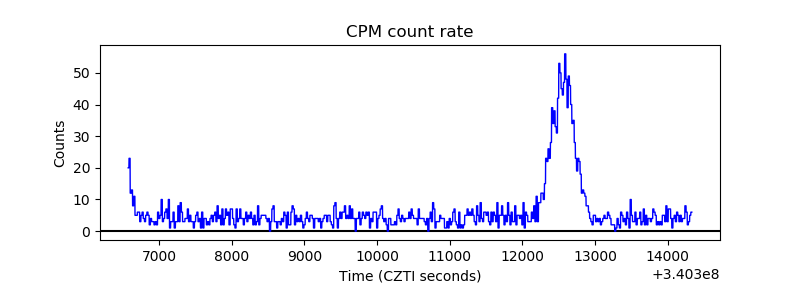 |
| CZT Counter | 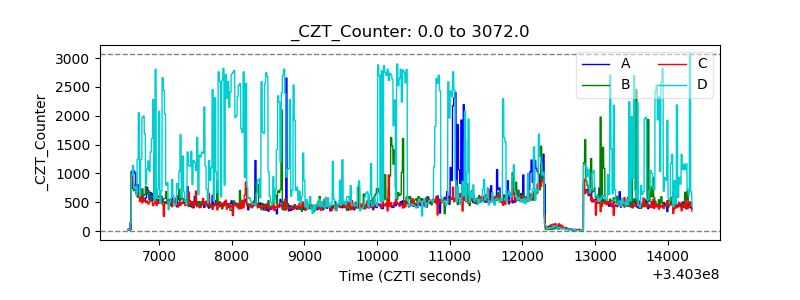 |
| +2.5 Volts monitor |  |
| +5 Volts monitor | 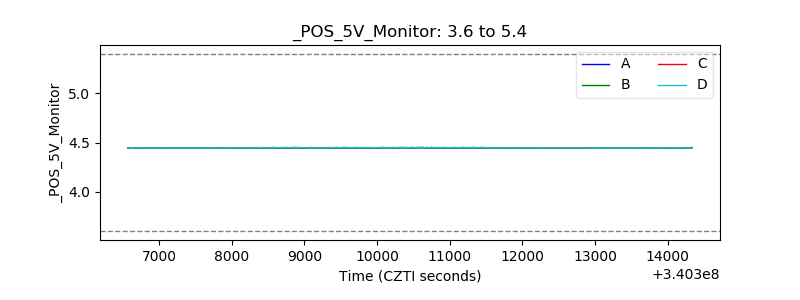 |
| _ROLL_ROT | 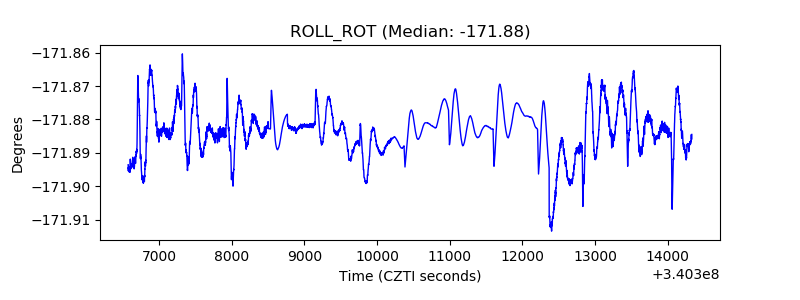 |
| _Roll_DEC |  |
| _Roll_RA | 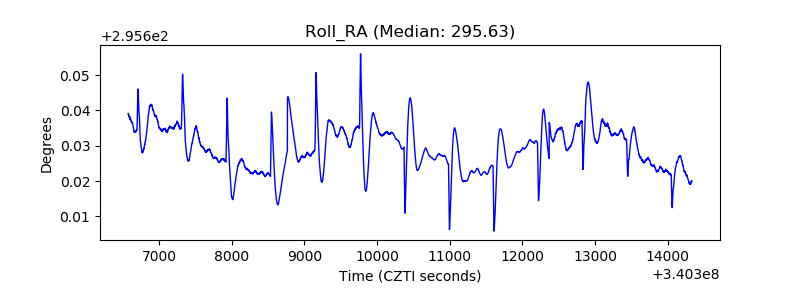 |
| Veto Counter | 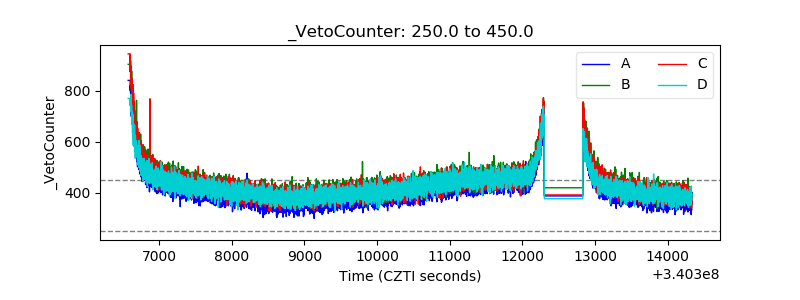 |