| Param | Original file | Final file |
|---|---|---|
| Filename | modeM0/AS1T03_243T01_9000003918_27275cztM0_level2.evt | modeM0/AS1T03_243T01_9000003918_27275cztM0_level2_quad_clean.evt |
| Size (bytes) | 623,943,360 | 105,546,240 |
| Size | 595.0 MB | 100.7 MB |
| Events in quadrant A | 3,628,498 | 691,610 |
| Events in quadrant B | 4,406,842 | 694,287 |
| Events in quadrant C | 3,575,353 | 666,436 |
| Events in quadrant D | 6,778,484 | 623,039 |
| Mode M9 | |||
|---|---|---|---|
| Quadrant | BADHDUFLAG | Total packets | Discarded packets |
| A | 0 | 2 | 0 |
| B | 0 | 2 | 0 |
| C | 0 | 2 | 0 |
| D | 0 | 2 | 0 |
| Mode M0 | |||
|---|---|---|---|
| Quadrant | BADHDUFLAG | Total packets | Discarded packets |
| A | 0 | 15683 | 0 |
| B | 0 | 17789 | 0 |
| C | 0 | 15440 | 0 |
| D | 0 | 25207 | 0 |
| Quadrant | Total seconds | Saturated seconds | Saturation percentage |
|---|---|---|---|
| A | 7483 | 29 | 0.387545% |
| B | 7483 | 231 | 3.086997% |
| C | 7484 | 65 | 0.868520% |
| D | 7484 | 690 | 9.219669% |
Noise dominated data is calculated using 1-second bins in cleaned event files. If a bin has >2000 counts, and if more than 50% of those come from <1% of pixels, then it is considered to be noise-dominated and hence unusable.
| Quadrant | # 1 sec bins | Bins with >0 counts | Bins with >2000 counts | High rate bins dominated by noise | Noise dominated (total time) | Noise dominated (detector-on time) | Marked lightcurve |
|---|---|---|---|---|---|---|---|
| A | 7723 | 7484 | 2 | 2 | 0.03% | 0.03% |  |
| B | 7723 | 7484 | 114 | 114 | 1.48% | 1.52% |  |
| C | 7724 | 7485 | 2 | 2 | 0.03% | 0.03% |  |
| D | 7724 | 7485 | 617 | 617 | 7.99% | 8.24% |  |
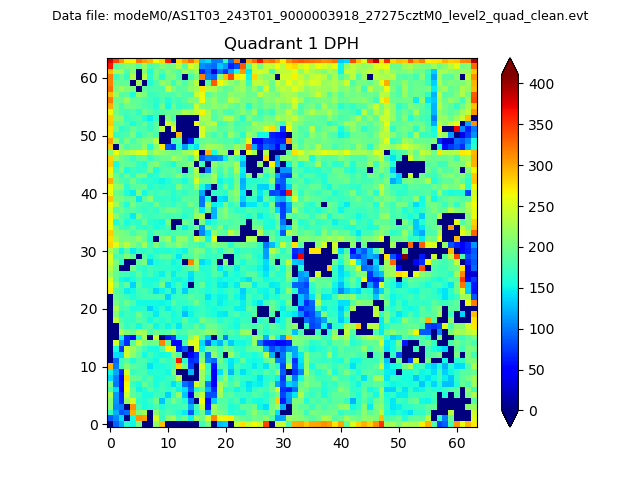
Top three noisy pixels from each quadrant. If the there are fewer than three noisy pixels in the level2.evt file, extra rows are filled as -1
| Pixel properties | Quadrant properties | ||||||
|---|---|---|---|---|---|---|---|
| Quadrant | DetID | PixID | Counts | Sigma | Mean | Median | Sigma |
| A | 12 | 96 | 54432 | 289.74 | 916 | 899 | 184.8 |
| A | 13 | 248 | 33396 | 175.89 | 916 | 899 | 184.8 |
| A | 13 | 254 | 12244 | 61.4 | 916 | 899 | 184.8 |
| B | 10 | 245 | 564964 | 3273.22 | 904 | 882 | 172.3 |
| B | 3 | 64 | 141137 | 813.86 | 904 | 882 | 172.3 |
| B | 15 | 32 | 98715 | 567.7 | 904 | 882 | 172.3 |
| C | 14 | 238 | 140117 | 676.71 | 871 | 874 | 205.8 |
| C | 15 | 208 | 37092 | 176.02 | 871 | 874 | 205.8 |
| C | 3 | 233 | 7654 | 32.95 | 871 | 874 | 205.8 |
| D | 1 | 52 | 3042144 | 14586.27 | 848 | 830 | 208.5 |
| D | 2 | 250 | 306114 | 1464.16 | 848 | 830 | 208.5 |
| D | 12 | 233 | 105385 | 501.45 | 848 | 830 | 208.5 |
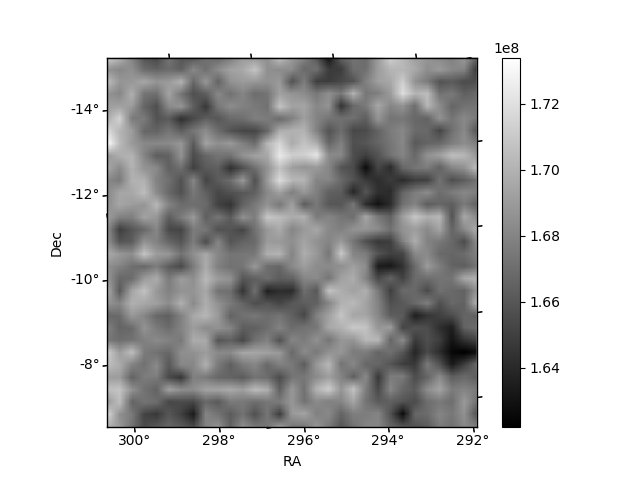
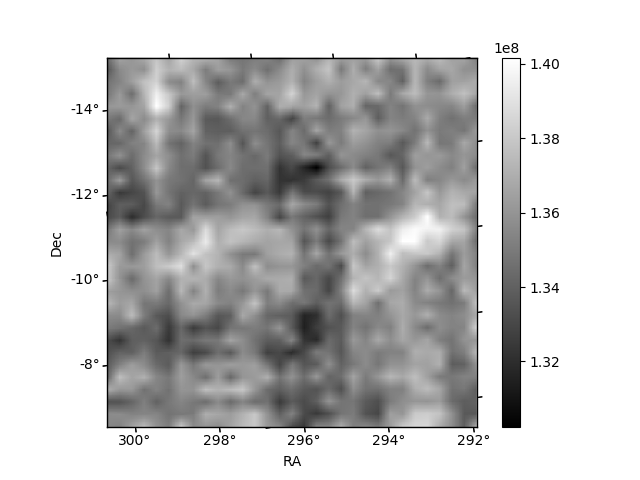
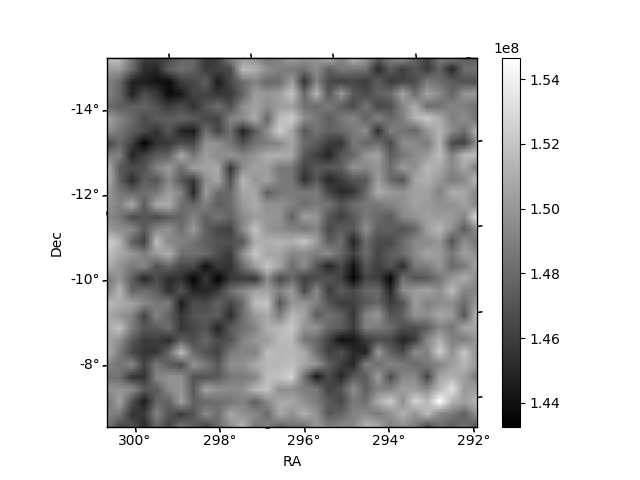
Histogram calculated using DETX and DETY for each event in the final _common_clean file
| Quadrant A | 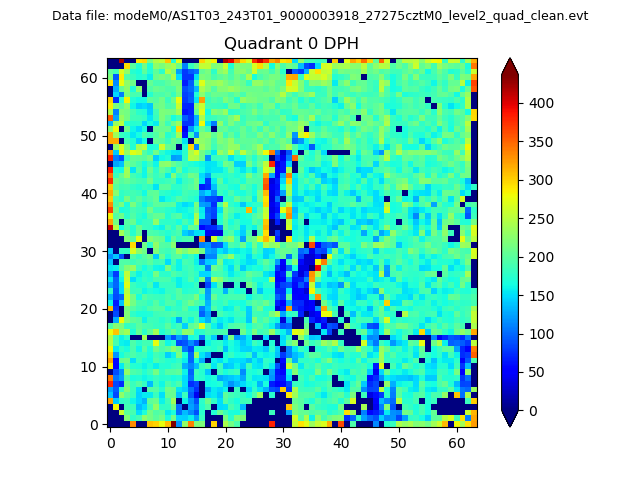 |
 |
Quadrant B |
|---|---|---|---|
| Quadrant D | 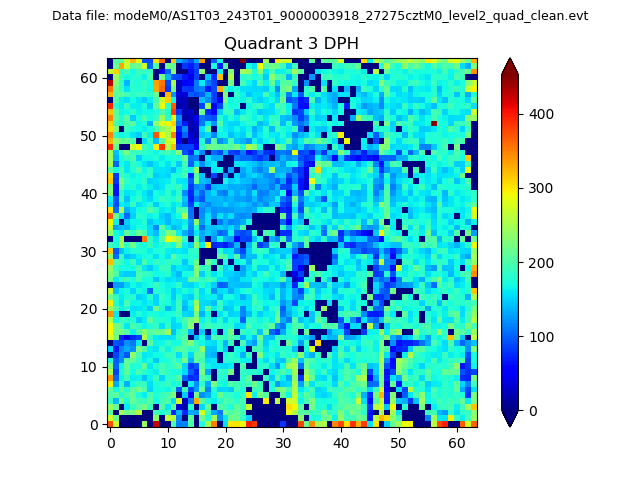 |
 |
Quadrant C |
| Plot type | Count rate plots | Images |
|---|---|---|
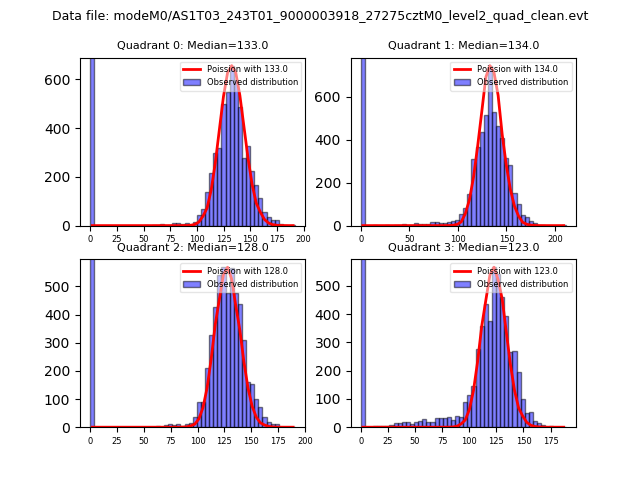
| Comparison with Poisson distribution Blue bars denote a histogram of data divided into 1 sec bins. Red curve is a Poisson curve with rate = median count rate of data. |
 |
 |
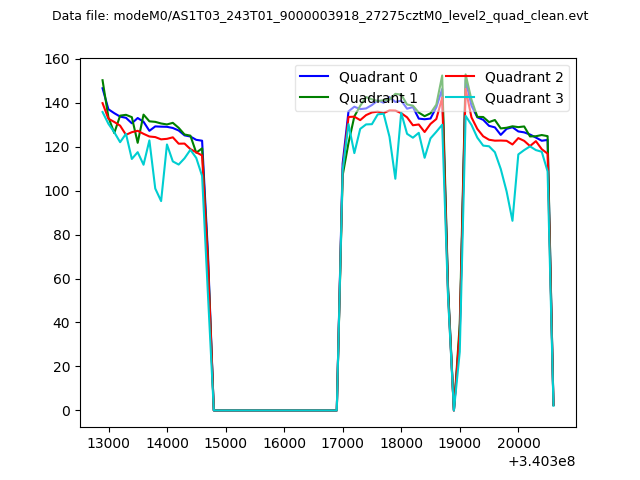
| Quadrant-wise count rates Data is divided into 100 sec bins |
 |
|
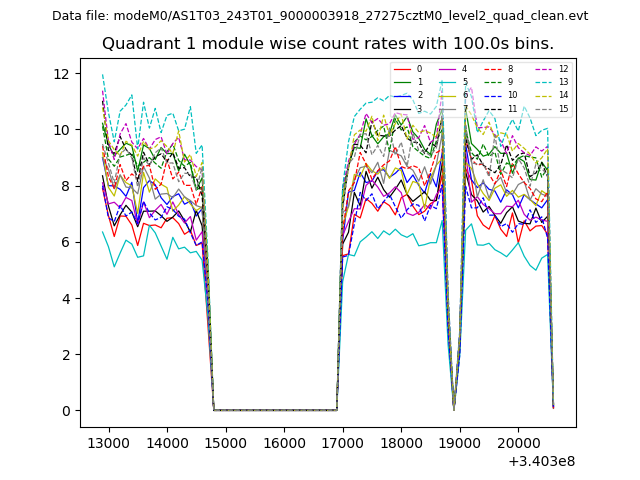
| Module-wise count rates for Quadrant A Data is divided into 100 sec bins |
 |
 |
| Module-wise count rates for Quadrant B Data is divided into 100 sec bins |
 |
 |
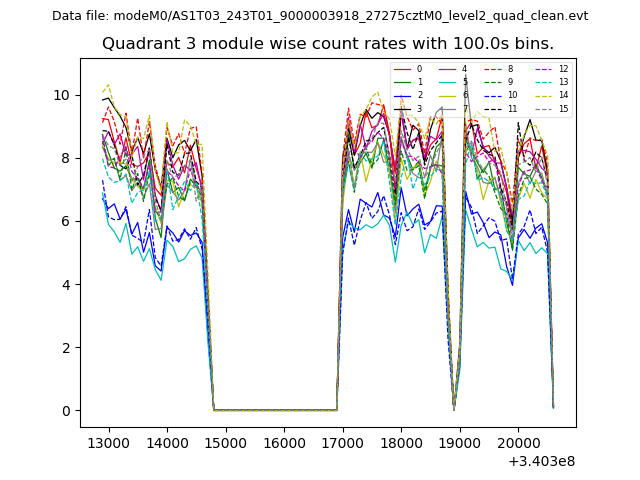
| Module-wise count rates for Quadrant C Data is divided into 100 sec bins |
 |
 |
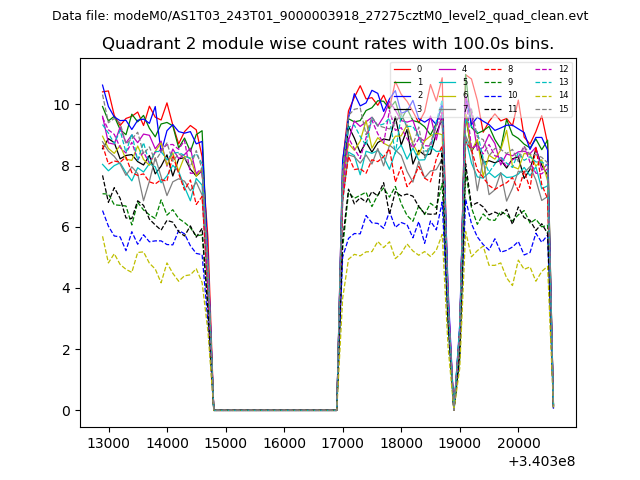
| Module-wise count rates for Quadrant D Data is divided into 100 sec bins |
 |
 |
| Parameter | Plot |
|---|---|
| CZT HV Monitor | 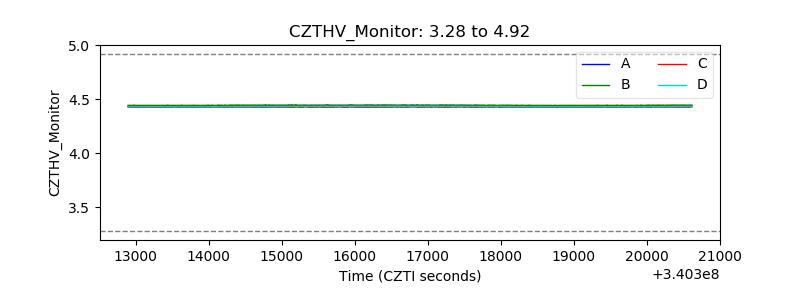 |
| D_VDD | 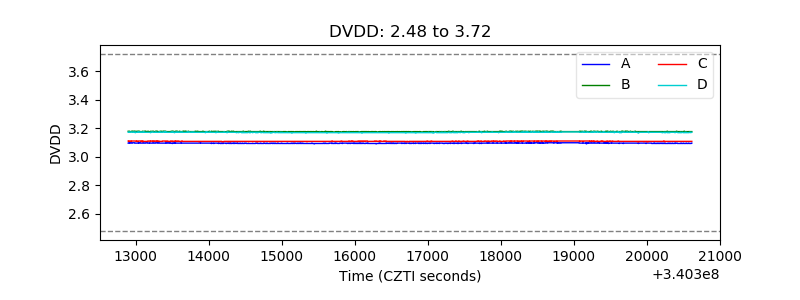 |
| Temperature 1 | 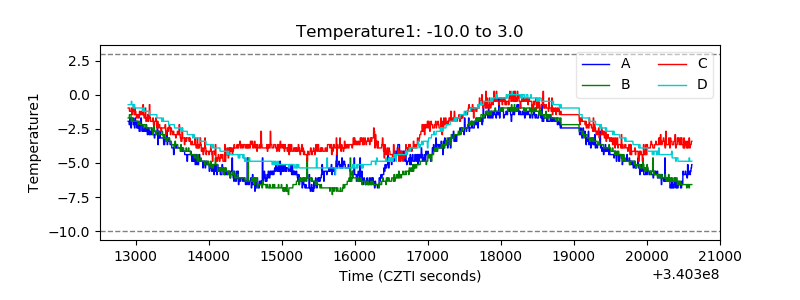 |
| Veto HV Monitor | 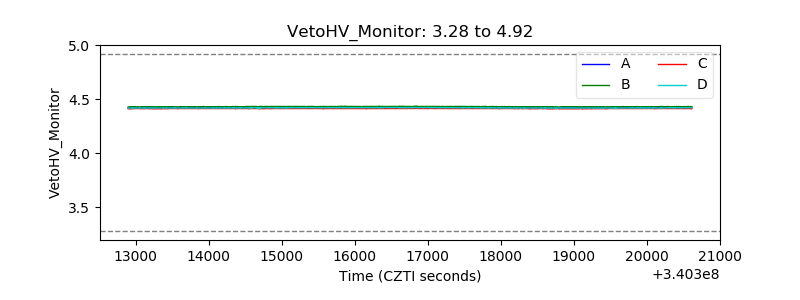 |
| Veto LLD | 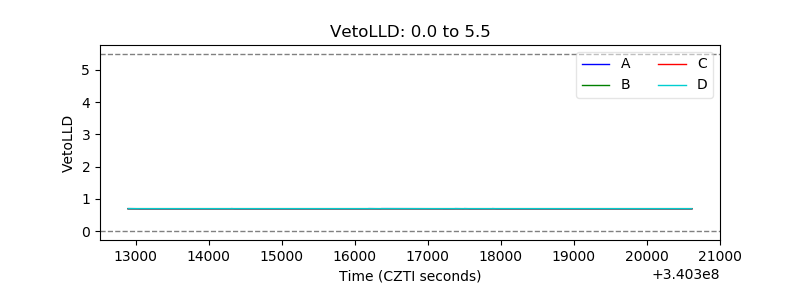 |
| Alpha Counter | 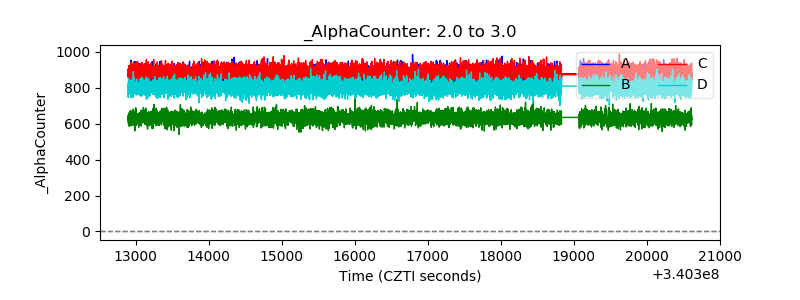 |
| _CPM_Rate | 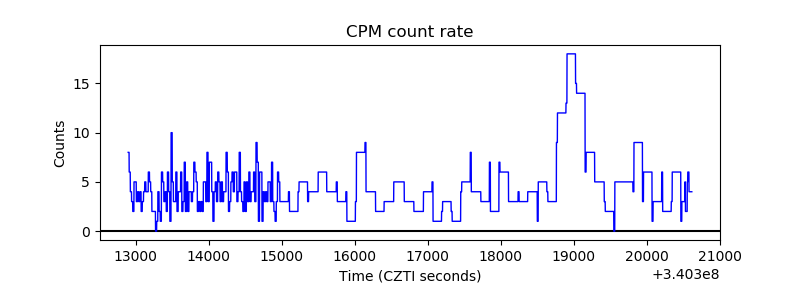 |
| CZT Counter | 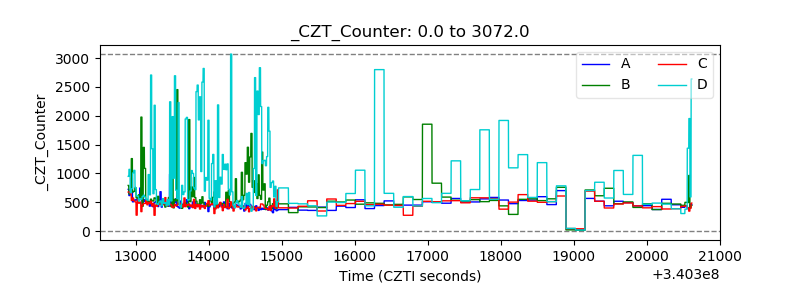 |
| +2.5 Volts monitor | 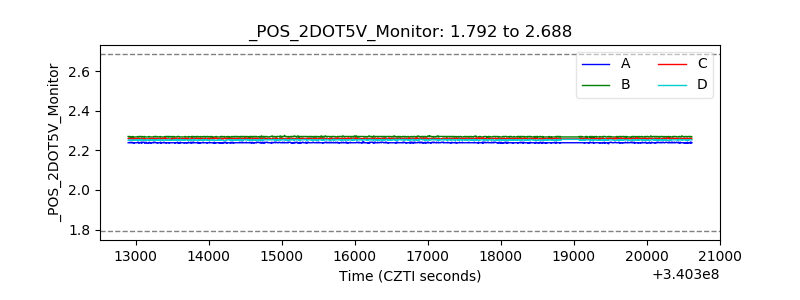 |
| +5 Volts monitor |  |
| _ROLL_ROT | 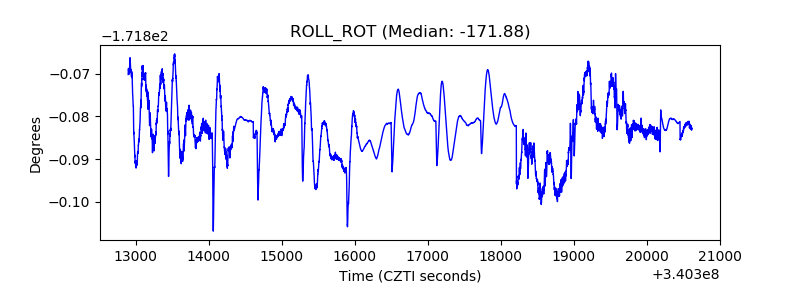 |
| _Roll_DEC |  |
| _Roll_RA | 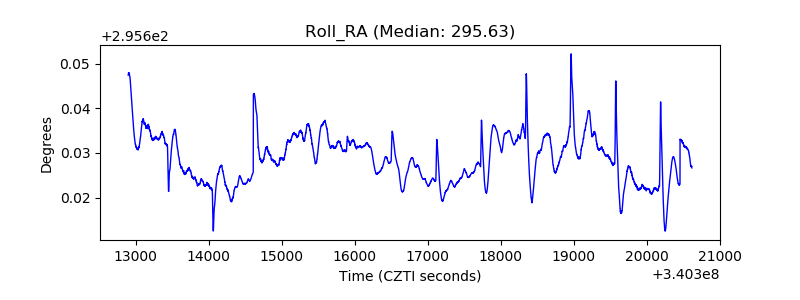 |
| Veto Counter | 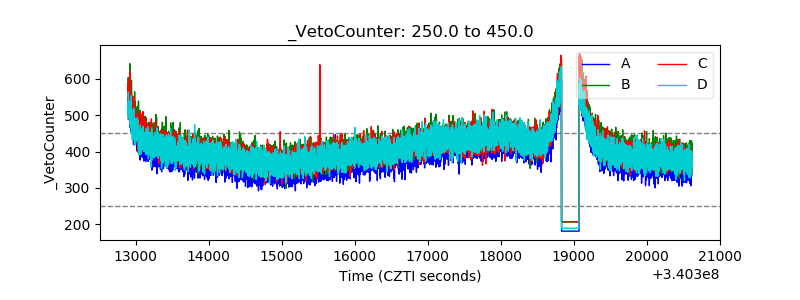 |