| Param | Original file | Final file |
|---|---|---|
| Filename | modeM0/AS1T03_243T01_9000003918_27276cztM0_level2.evt | modeM0/AS1T03_243T01_9000003918_27276cztM0_level2_quad_clean.evt |
| Size (bytes) | 684,731,520 | 113,045,760 |
| Size | 653.0 MB | 107.8 MB |
| Events in quadrant A | 4,079,392 | 735,065 |
| Events in quadrant B | 5,305,388 | 732,879 |
| Events in quadrant C | 4,035,596 | 707,092 |
| Events in quadrant D | 6,754,639 | 671,330 |
| Mode M9 | |||
|---|---|---|---|
| Quadrant | BADHDUFLAG | Total packets | Discarded packets |
| A | 0 | 5 | 0 |
| B | 0 | 5 | 0 |
| C | 0 | 5 | 0 |
| D | 0 | 5 | 0 |
| Mode M0 | |||
|---|---|---|---|
| Quadrant | BADHDUFLAG | Total packets | Discarded packets |
| A | 0 | 17528 | 0 |
| B | 0 | 21036 | 0 |
| C | 0 | 17364 | 0 |
| D | 0 | 25799 | 0 |
| Quadrant | Total seconds | Saturated seconds | Saturation percentage |
|---|---|---|---|
| A | 8302 | 109 | 1.312937% |
| B | 8302 | 425 | 5.119248% |
| C | 8302 | 150 | 1.806794% |
| D | 8302 | 607 | 7.311491% |
Noise dominated data is calculated using 1-second bins in cleaned event files. If a bin has >2000 counts, and if more than 50% of those come from <1% of pixels, then it is considered to be noise-dominated and hence unusable.
| Quadrant | # 1 sec bins | Bins with >0 counts | Bins with >2000 counts | High rate bins dominated by noise | Noise dominated (total time) | Noise dominated (detector-on time) | Marked lightcurve |
|---|---|---|---|---|---|---|---|
| A | 8797 | 8304 | 10 | 10 | 0.11% | 0.12% | 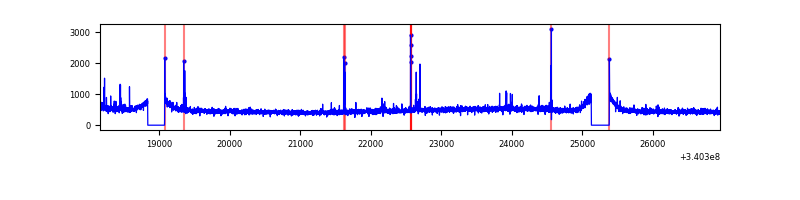 |
| B | 8797 | 8304 | 173 | 173 | 1.97% | 2.08% | 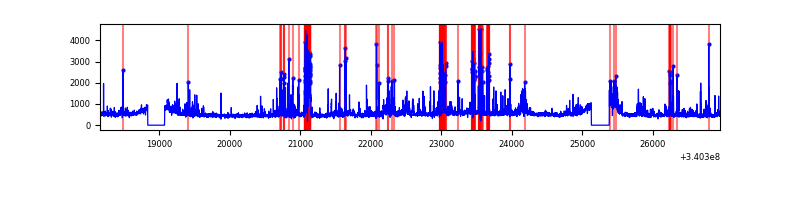 |
| C | 8797 | 8304 | 7 | 7 | 0.08% | 0.08% | 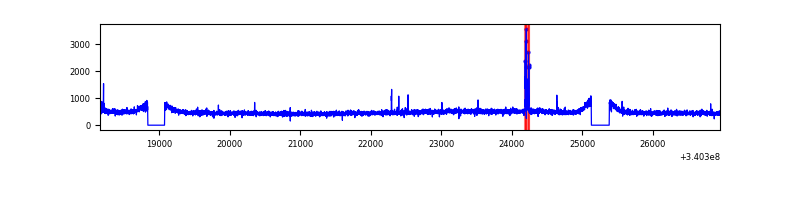 |
| D | 8797 | 8304 | 456 | 456 | 5.18% | 5.49% | 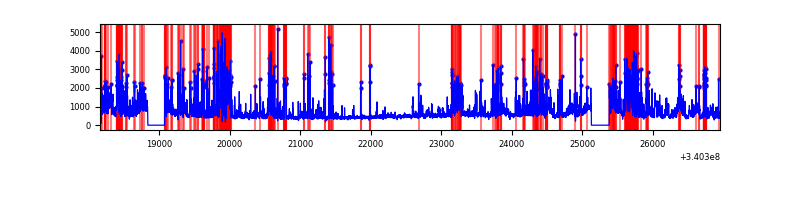 |
Top three noisy pixels from each quadrant. If the there are fewer than three noisy pixels in the level2.evt file, extra rows are filled as -1
| Pixel properties | Quadrant properties | ||||||
|---|---|---|---|---|---|---|---|
| Quadrant | DetID | PixID | Counts | Sigma | Mean | Median | Sigma |
| A | 13 | 170 | 42376 | 199.01 | 1028 | 1005 | 207.9 |
| A | 13 | 248 | 28721 | 133.32 | 1028 | 1005 | 207.9 |
| A | 12 | 96 | 18852 | 85.85 | 1028 | 1005 | 207.9 |
| B | 10 | 245 | 816660 | 4227.2 | 1008 | 983 | 193.0 |
| B | 3 | 64 | 294179 | 1519.47 | 1008 | 983 | 193.0 |
| B | 15 | 32 | 183272 | 944.7 | 1008 | 983 | 193.0 |
| C | 14 | 238 | 153834 | 663.9 | 976 | 980 | 230.2 |
| C | 15 | 208 | 68440 | 293.0 | 976 | 980 | 230.2 |
| C | 13 | 61 | 6723 | 24.94 | 976 | 980 | 230.2 |
| D | 1 | 52 | 2657142 | 11048.53 | 967 | 944 | 240.4 |
| D | 2 | 250 | 289627 | 1200.79 | 967 | 944 | 240.4 |
| D | 12 | 233 | 78393 | 322.15 | 967 | 944 | 240.4 |
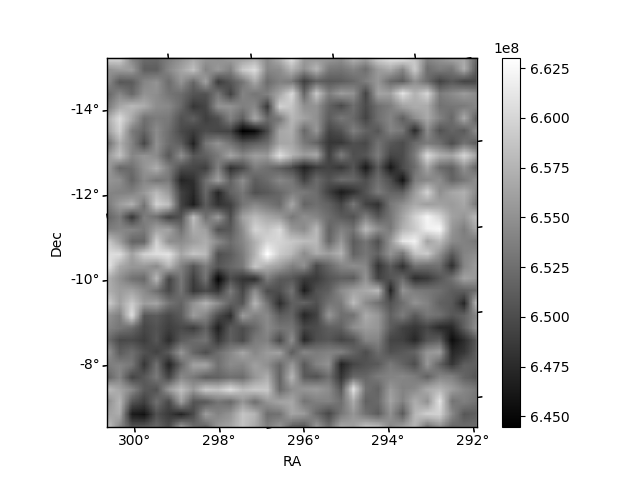
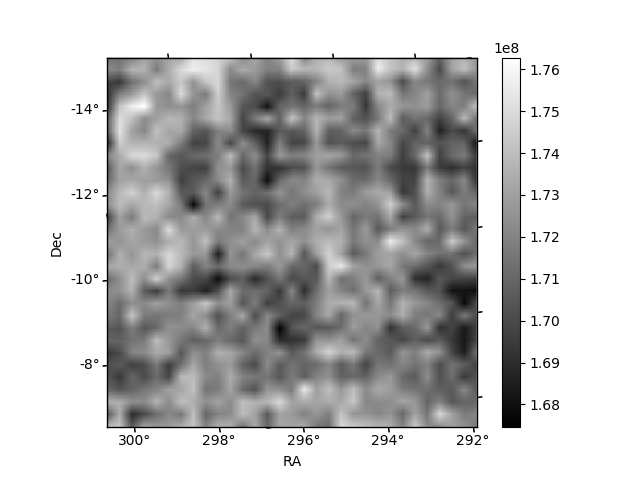
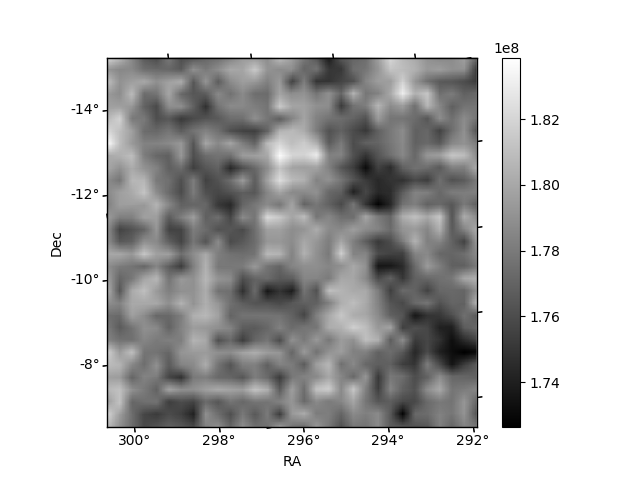
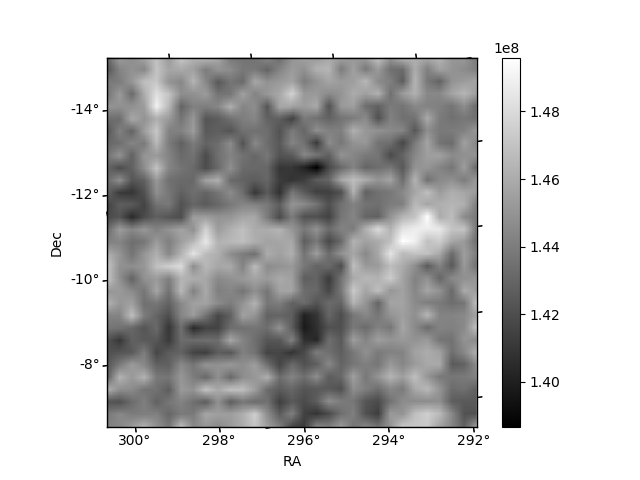
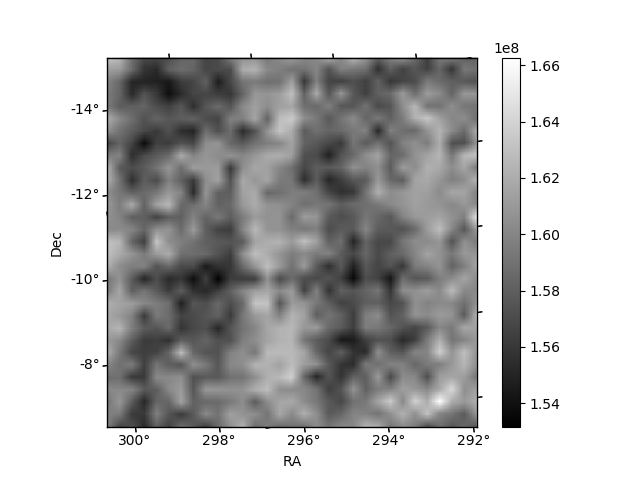
Histogram calculated using DETX and DETY for each event in the final _common_clean file
| Quadrant A | 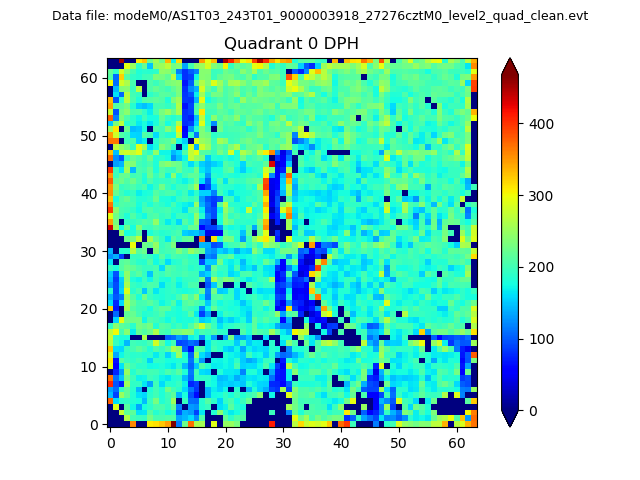 |
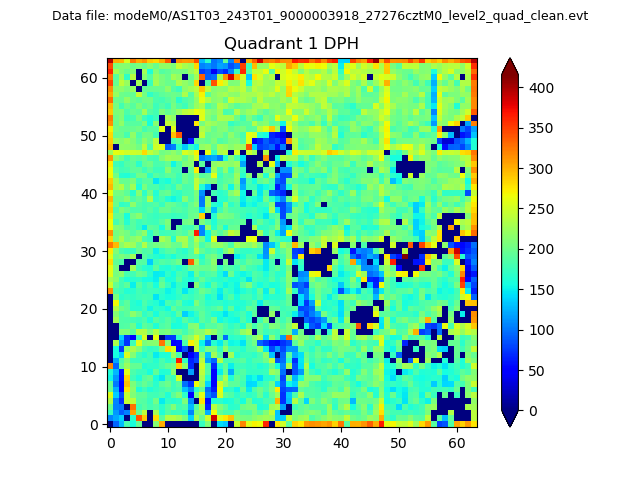 |
Quadrant B |
|---|---|---|---|
| Quadrant D | 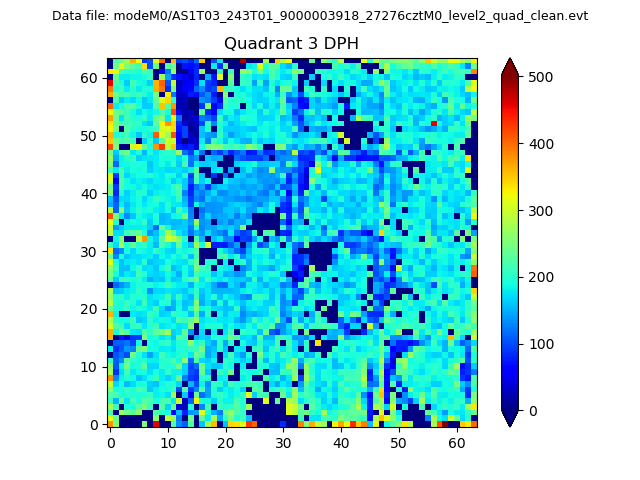 |
 |
Quadrant C |
| Plot type | Count rate plots | Images |
|---|---|---|
| Comparison with Poisson distribution Blue bars denote a histogram of data divided into 1 sec bins. Red curve is a Poisson curve with rate = median count rate of data. |
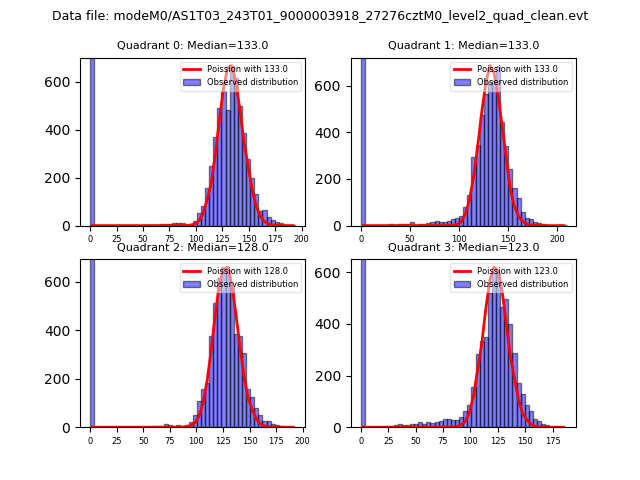 |
 |
| Quadrant-wise count rates Data is divided into 100 sec bins |
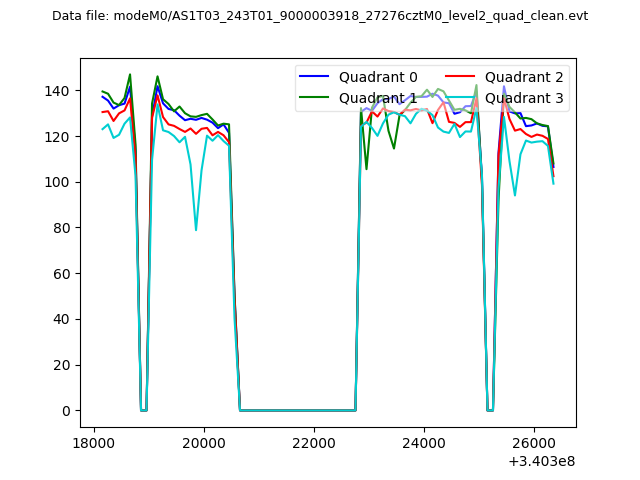 |
|
| Module-wise count rates for Quadrant A Data is divided into 100 sec bins |
 |
 |
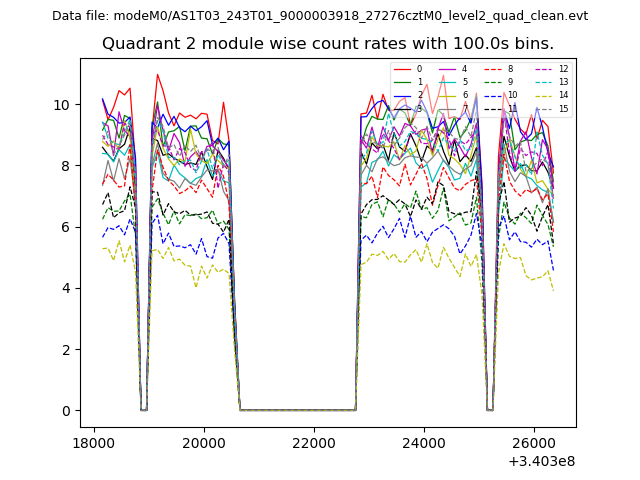
| Module-wise count rates for Quadrant B Data is divided into 100 sec bins |
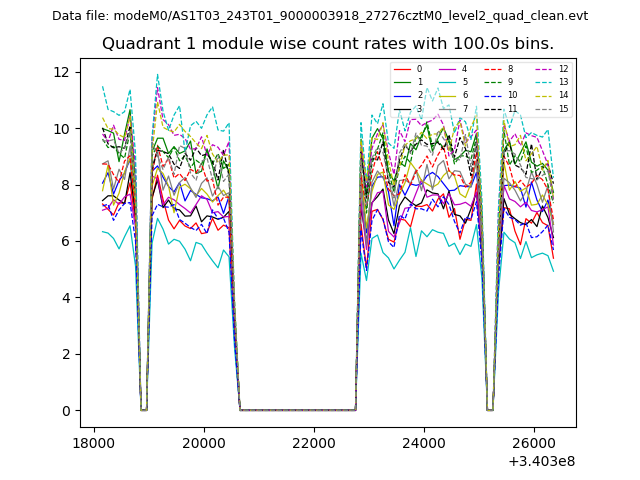 |
 |
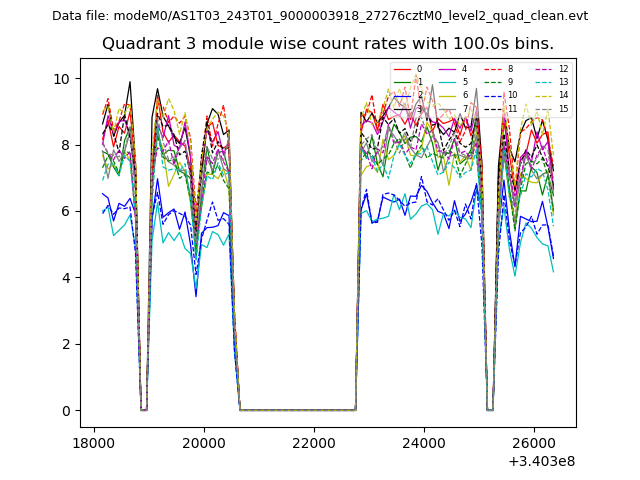
| Module-wise count rates for Quadrant C Data is divided into 100 sec bins |
 |
 |
| Module-wise count rates for Quadrant D Data is divided into 100 sec bins |
 |
 |
| Parameter | Plot |
|---|---|
| CZT HV Monitor | 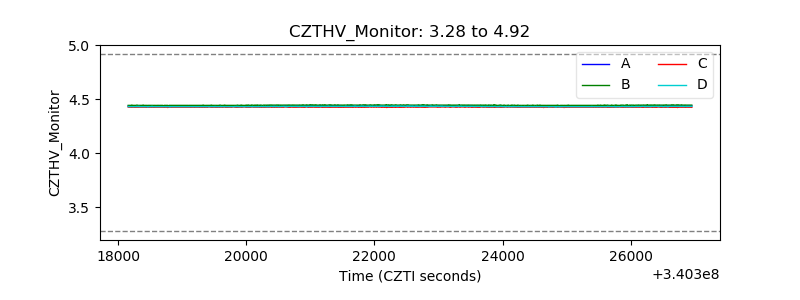 |
| D_VDD | 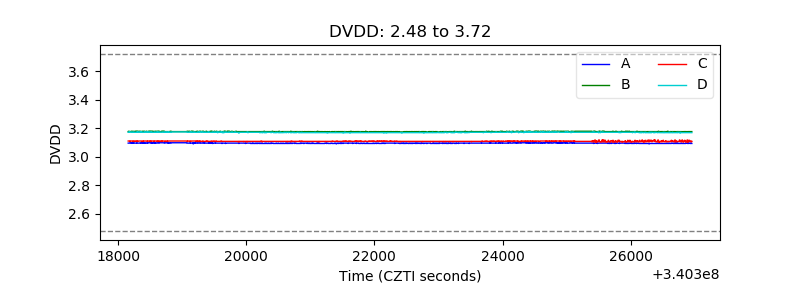 |
| Temperature 1 | 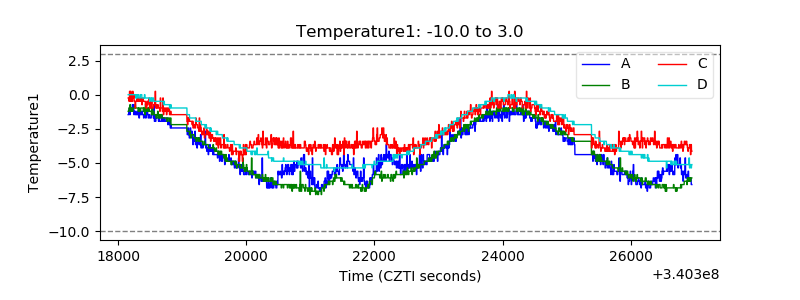 |
| Veto HV Monitor | 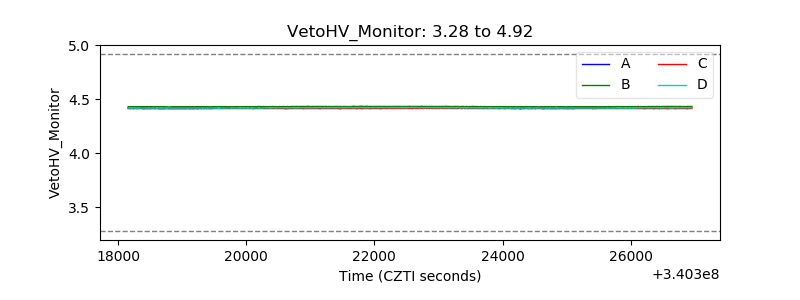 |
| Veto LLD | 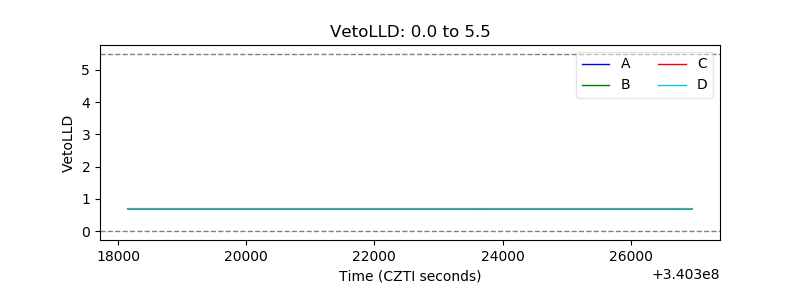 |
| Alpha Counter | 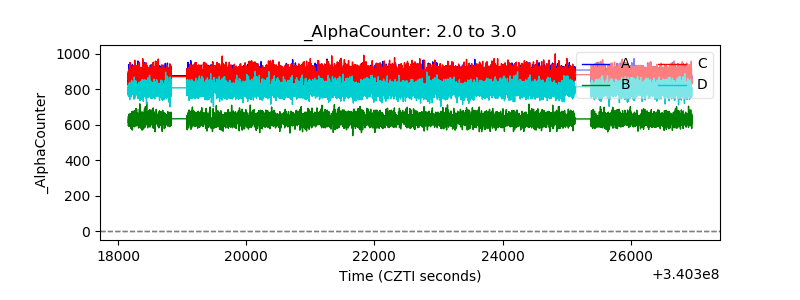 |
| _CPM_Rate | 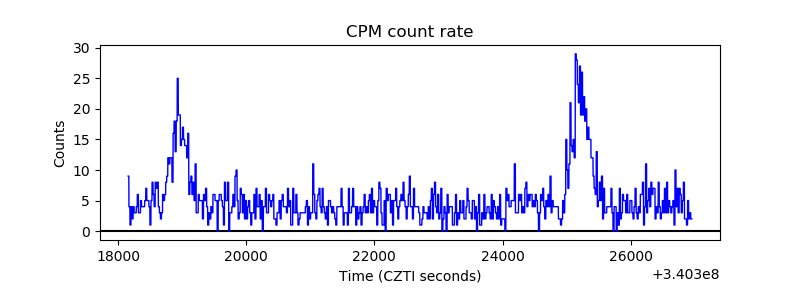 |
| CZT Counter | 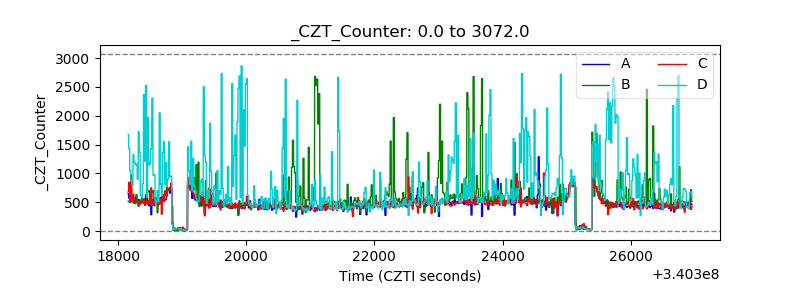 |
| +2.5 Volts monitor |  |
| +5 Volts monitor | 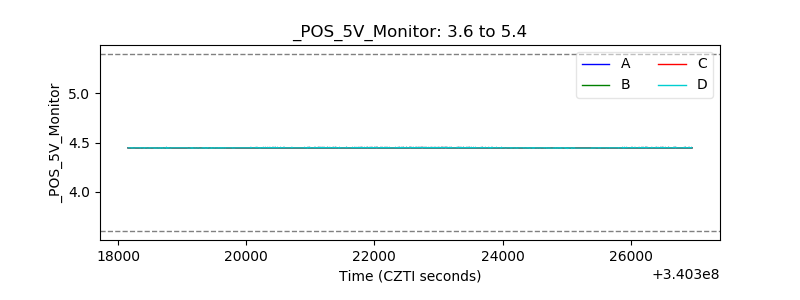 |
| _ROLL_ROT | 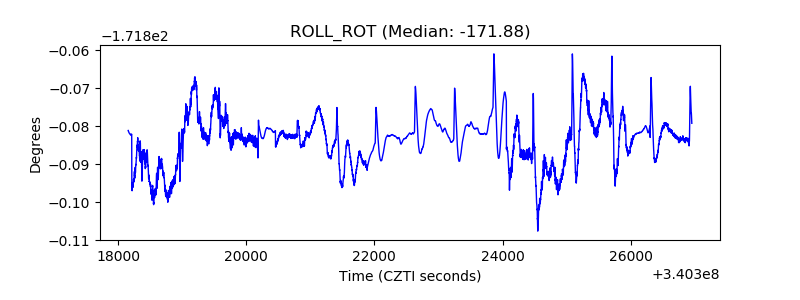 |
| _Roll_DEC | 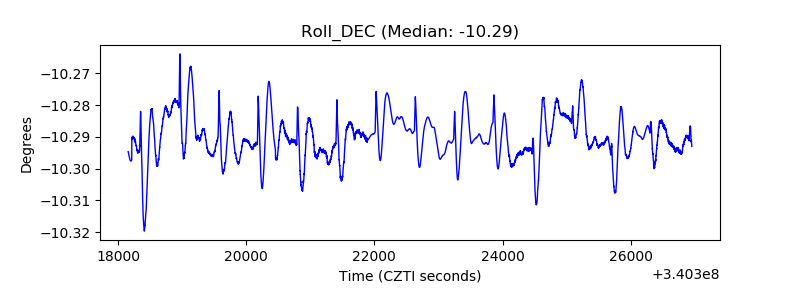 |
| _Roll_RA | 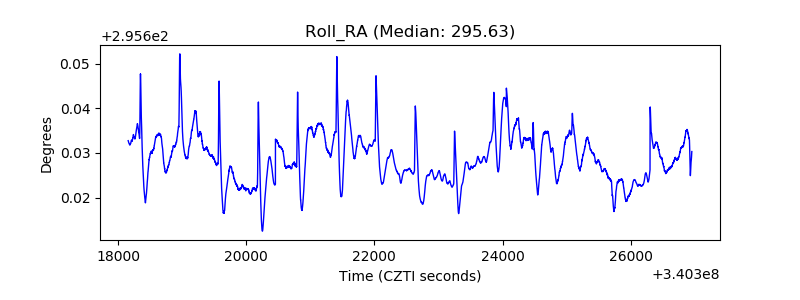 |
| Veto Counter | 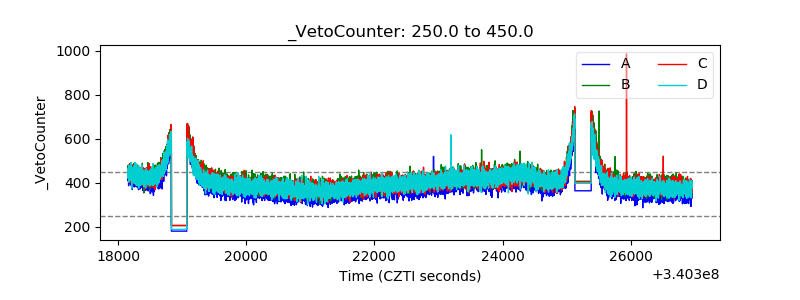 |