| Param | Original file | Final file |
|---|---|---|
| Filename | modeM0/AS1T03_243T01_9000003918_27279cztM0_level2.evt | modeM0/AS1T03_243T01_9000003918_27279cztM0_level2_quad_clean.evt |
| Size (bytes) | 1,375,315,200 | 225,011,520 |
| Size | 1.3 GB | 214.6 MB |
| Events in quadrant A | 9,080,560 | 1,405,694 |
| Events in quadrant B | 10,111,722 | 1,423,108 |
| Events in quadrant C | 9,182,525 | 1,358,103 |
| Events in quadrant D | 11,989,119 | 1,314,893 |
| Mode M9 | |||
|---|---|---|---|
| Quadrant | BADHDUFLAG | Total packets | Discarded packets |
| A | 0 | 21 | 0 |
| B | 0 | 21 | 0 |
| C | 0 | 21 | 0 |
| D | 0 | 21 | 0 |
| Mode M0 | |||
|---|---|---|---|
| Quadrant | BADHDUFLAG | Total packets | Discarded packets |
| A | 0 | 39141 | 0 |
| B | 0 | 41813 | 0 |
| C | 0 | 39329 | 0 |
| D | 0 | 48597 | 0 |
| Quadrant | Total seconds | Saturated seconds | Saturation percentage |
|---|---|---|---|
| A | 19050 | 216 | 1.133858% |
| B | 19049 | 449 | 2.357079% |
| C | 19049 | 323 | 1.695627% |
| D | 19050 | 700 | 3.674541% |
Noise dominated data is calculated using 1-second bins in cleaned event files. If a bin has >2000 counts, and if more than 50% of those come from <1% of pixels, then it is considered to be noise-dominated and hence unusable.
| Quadrant | # 1 sec bins | Bins with >0 counts | Bins with >2000 counts | High rate bins dominated by noise | Noise dominated (total time) | Noise dominated (detector-on time) | Marked lightcurve |
|---|---|---|---|---|---|---|---|
| A | 21165 | 19053 | 2 | 2 | 0.01% | 0.01% | 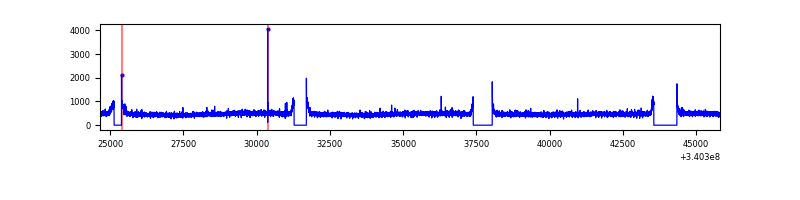 |
| B | 21164 | 19052 | 74 | 74 | 0.35% | 0.39% | 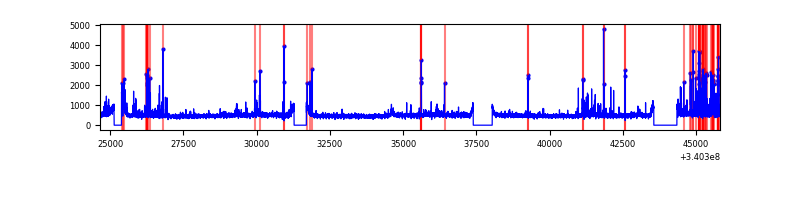 |
| C | 21164 | 19053 | 8 | 8 | 0.04% | 0.04% | 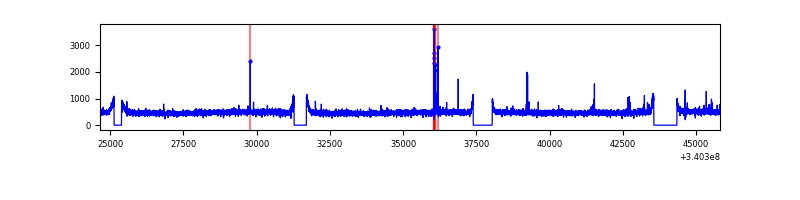 |
| D | 21165 | 19053 | 428 | 428 | 2.02% | 2.25% | 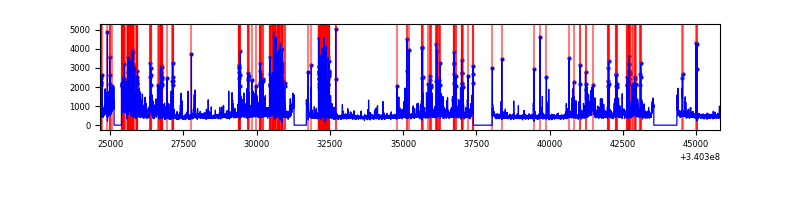 |
Top three noisy pixels from each quadrant. If the there are fewer than three noisy pixels in the level2.evt file, extra rows are filled as -1
| Pixel properties | Quadrant properties | ||||||
|---|---|---|---|---|---|---|---|
| Quadrant | DetID | PixID | Counts | Sigma | Mean | Median | Sigma |
| A | 13 | 254 | 30458 | 59.79 | 2344 | 2297 | 471.0 |
| A | 3 | 137 | 22600 | 43.11 | 2344 | 2297 | 471.0 |
| A | 8 | 192 | 22206 | 42.27 | 2344 | 2297 | 471.0 |
| B | 10 | 245 | 666262 | 1494.51 | 2327 | 2269 | 444.3 |
| B | 3 | 64 | 128412 | 283.92 | 2327 | 2269 | 444.3 |
| B | 15 | 32 | 106109 | 233.72 | 2327 | 2269 | 444.3 |
| C | 14 | 238 | 355175 | 670.45 | 2235 | 2248 | 526.4 |
| C | 15 | 208 | 108929 | 202.66 | 2235 | 2248 | 526.4 |
| C | 13 | 61 | 15501 | 25.18 | 2235 | 2248 | 526.4 |
| D | 1 | 52 | 2694156 | 5042.09 | 2223 | 2175 | 533.9 |
| D | 2 | 250 | 407486 | 759.15 | 2223 | 2175 | 533.9 |
| D | 12 | 233 | 212165 | 393.31 | 2223 | 2175 | 533.9 |
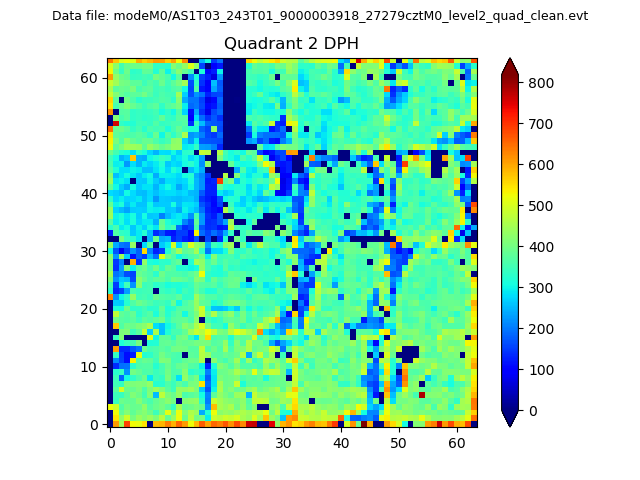
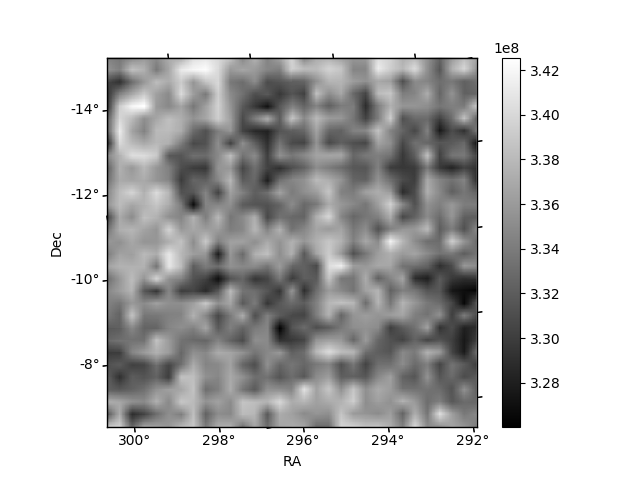
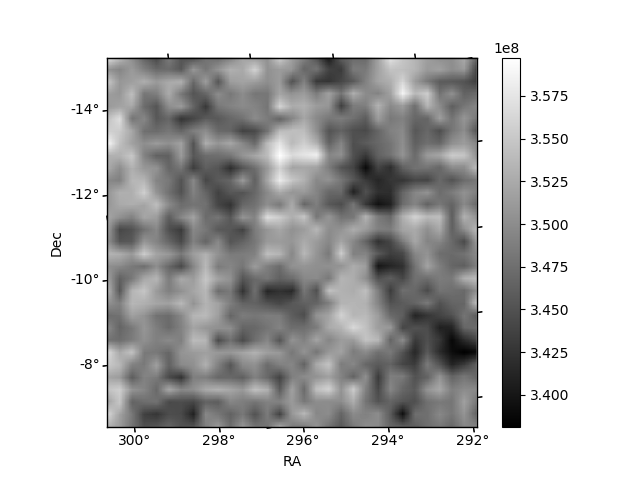
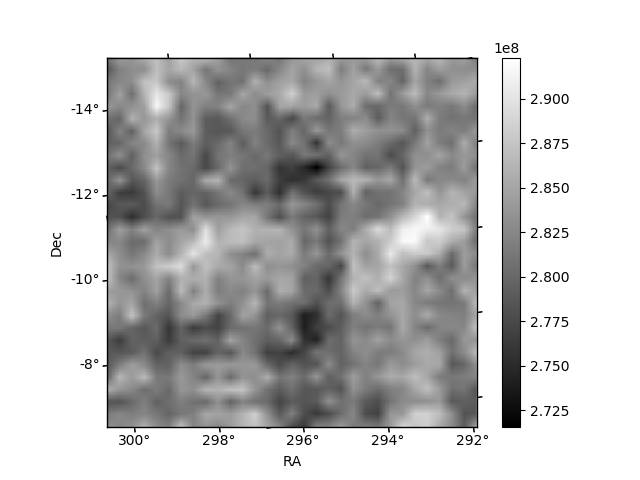
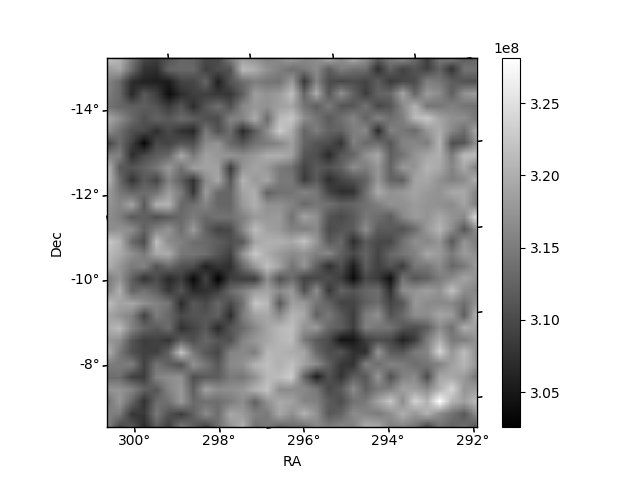
Histogram calculated using DETX and DETY for each event in the final _common_clean file
| Quadrant A | 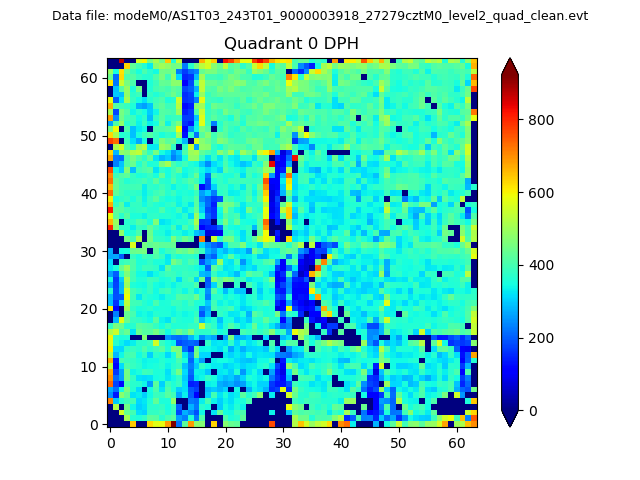 |
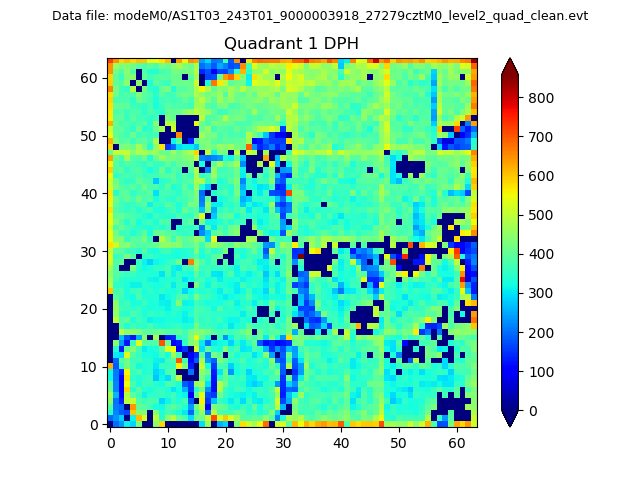 |
Quadrant B |
|---|---|---|---|
| Quadrant D | 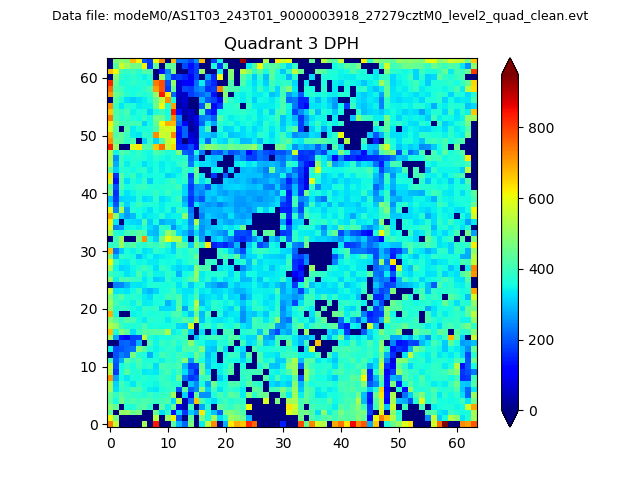 |
 |
Quadrant C |
| Plot type | Count rate plots | Images |
|---|---|---|
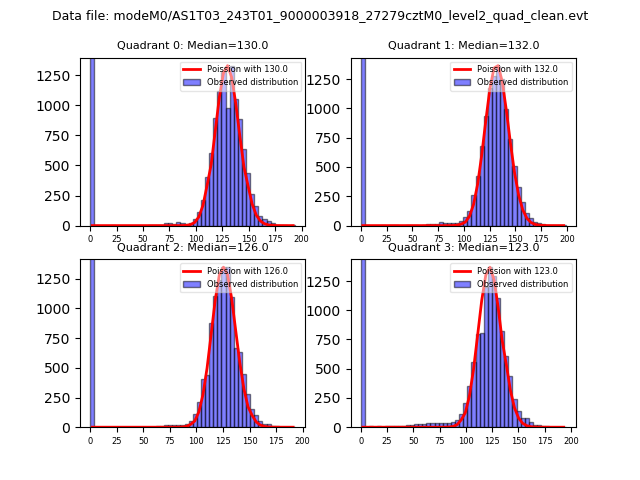
| Comparison with Poisson distribution Blue bars denote a histogram of data divided into 1 sec bins. Red curve is a Poisson curve with rate = median count rate of data. |
 |
 |
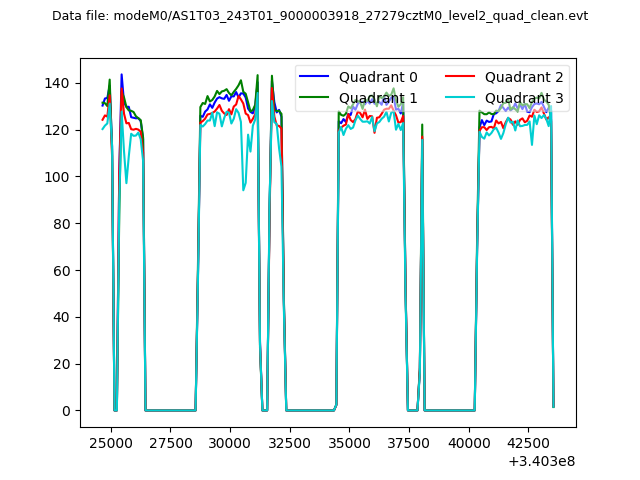
| Quadrant-wise count rates Data is divided into 100 sec bins |
 |
|
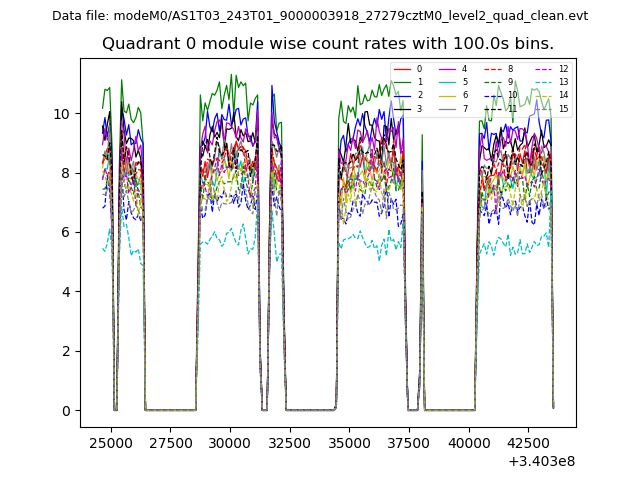
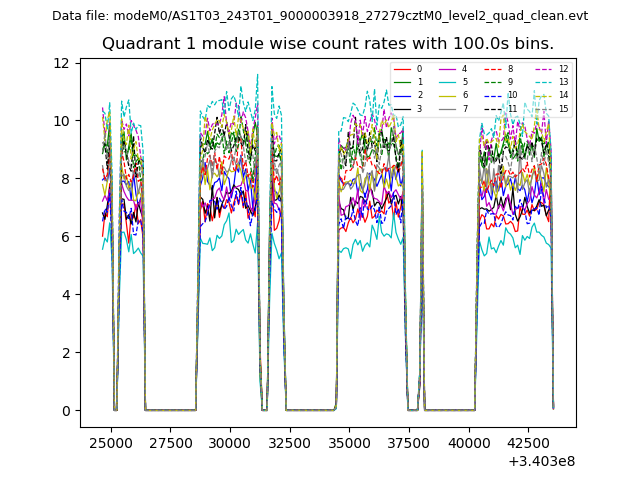
| Module-wise count rates for Quadrant A Data is divided into 100 sec bins |
 |
 |
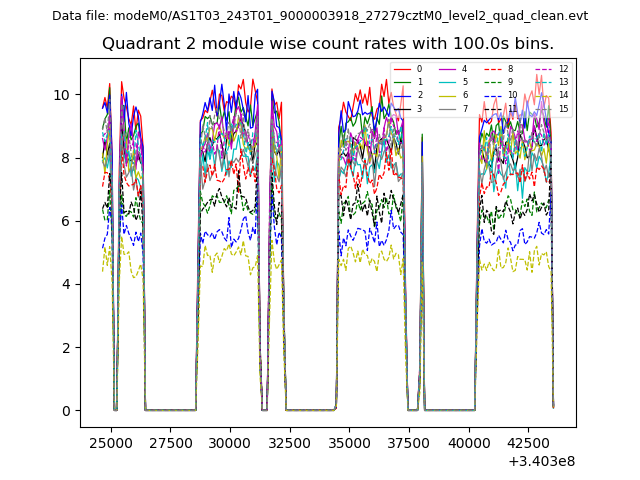
| Module-wise count rates for Quadrant B Data is divided into 100 sec bins |
 |
 |
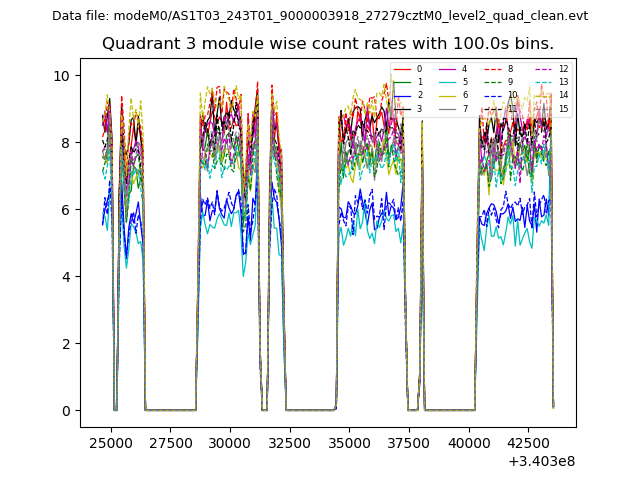
| Module-wise count rates for Quadrant C Data is divided into 100 sec bins |
 |
 |
| Module-wise count rates for Quadrant D Data is divided into 100 sec bins |
 |
 |
| Parameter | Plot |
|---|---|
| CZT HV Monitor | 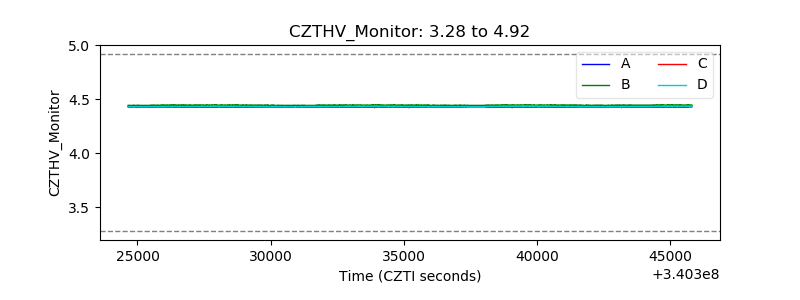 |
| D_VDD | 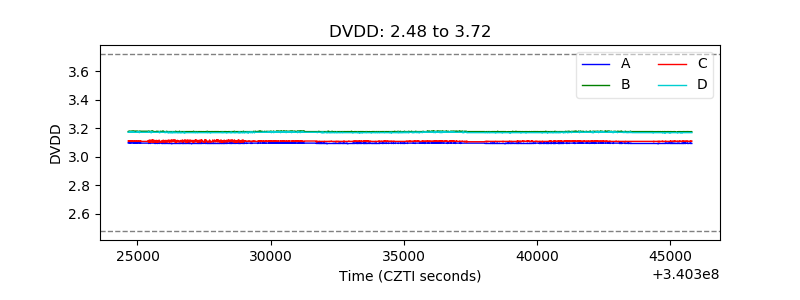 |
| Temperature 1 | 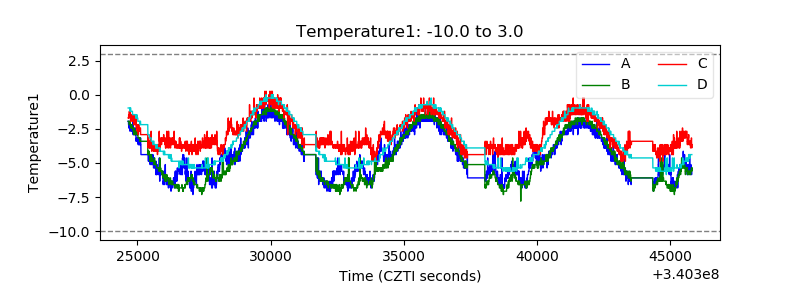 |
| Veto HV Monitor | 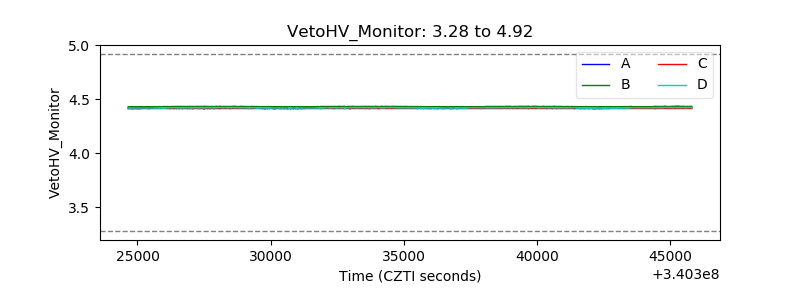 |
| Veto LLD | 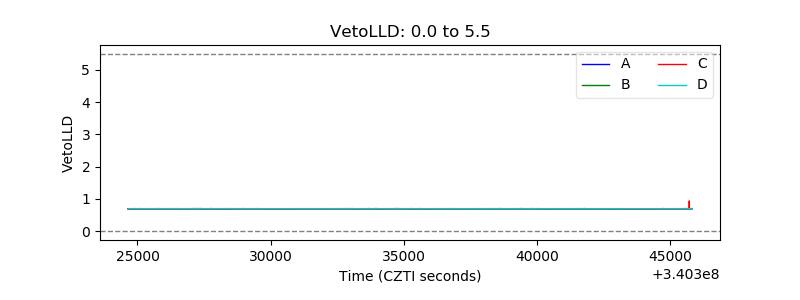 |
| Alpha Counter | 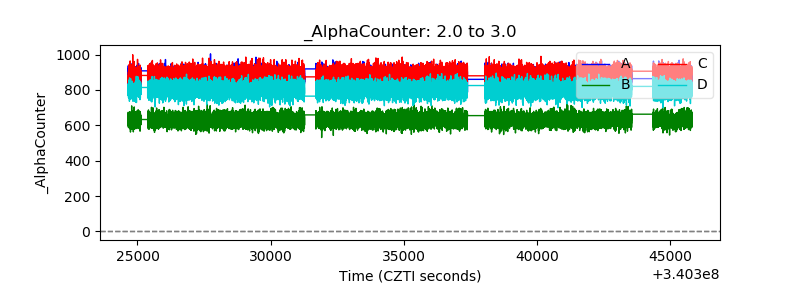 |
| _CPM_Rate | 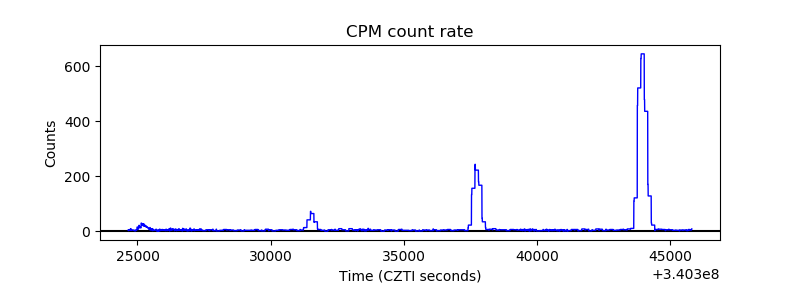 |
| CZT Counter | 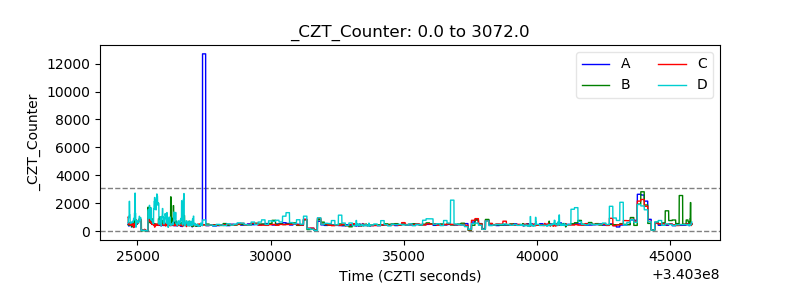 |
| +2.5 Volts monitor |  |
| +5 Volts monitor |  |
| _ROLL_ROT | 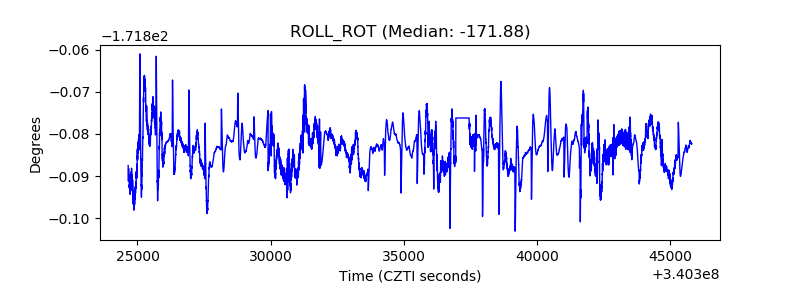 |
| _Roll_DEC | 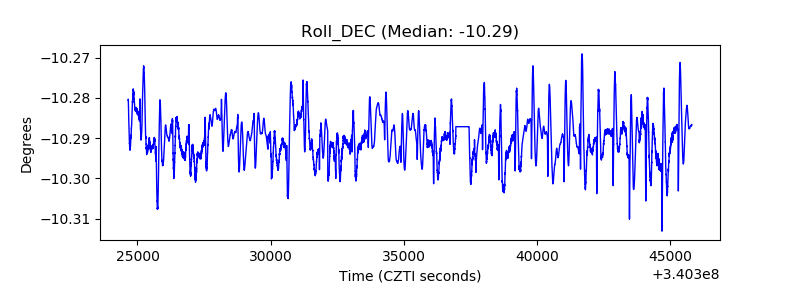 |
| _Roll_RA | 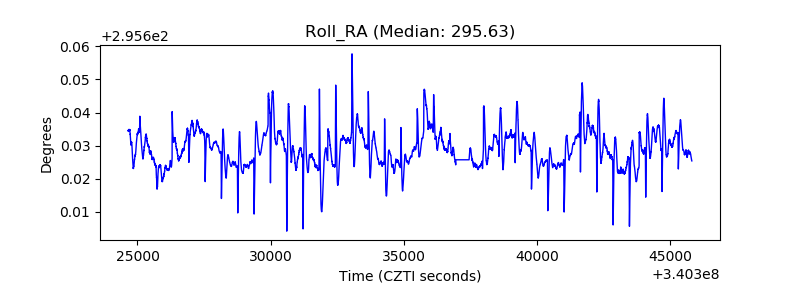 |
| Veto Counter | 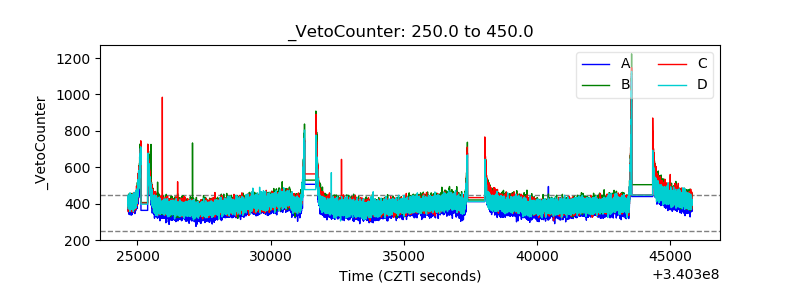 |